| Param | Original file | Final file |
|---|---|---|
| Filename | modeM0/AS1G08_036T01_9000002034_13724cztM0_level2.evt | modeM0/AS1G08_036T01_9000002034_13724cztM0_level2_quad_clean.evt |
| Size (bytes) | 243,172,800 | 33,428,160 |
| Size | 231.9 MB | 31.9 MB |
| Events in quadrant A | 1,641,944 | 193,434 |
| Events in quadrant B | 1,960,620 | 200,841 |
| Events in quadrant C | 1,638,297 | 186,116 |
| Events in quadrant D | 1,879,485 | 178,566 |
| Mode M0 | |||
|---|---|---|---|
| Quadrant | BADHDUFLAG | Total packets | Discarded packets |
| A | 0 | 7159 | 0 |
| B | 0 | 8084 | 0 |
| C | 0 | 7141 | 0 |
| D | 0 | 7717 | 0 |
| Mode SS | |||
|---|---|---|---|
| Quadrant | BADHDUFLAG | Total packets | Discarded packets |
| A | 0 | 72 | 0 |
| B | 0 | 72 | 0 |
| C | 0 | 72 | 0 |
| D | 0 | 72 | 0 |
| Quadrant | Total seconds | Saturated seconds | Saturation percentage |
|---|---|---|---|
| A | 3564 | 1 | 0.028058% |
| B | 3564 | 13 | 0.364759% |
| C | 3564 | 1 | 0.028058% |
| D | 3564 | 13 | 0.364759% |
Noise dominated data is calculated using 1-second bins in cleaned event files. If a bin has >2000 counts, and if more than 50% of those come from <1% of pixels, then it is considered to be noise-dominated and hence unusable.
| Quadrant | # 1 sec bins | Bins with >0 counts | Bins with >2000 counts | High rate bins dominated by noise | Noise dominated (total time) | Noise dominated (detector-on time) | Marked lightcurve |
|---|---|---|---|---|---|---|---|
| A | 3565 | 3565 | 0 | 0 | 0.00% | 0.00% | 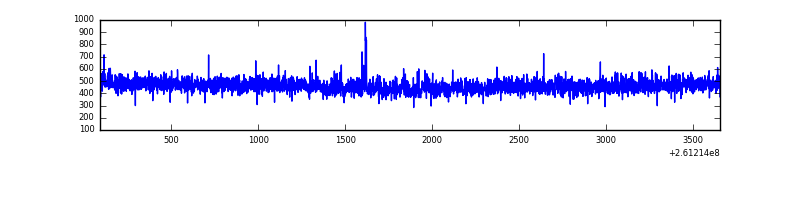 |
| B | 3565 | 3565 | 4 | 4 | 0.11% | 0.11% | 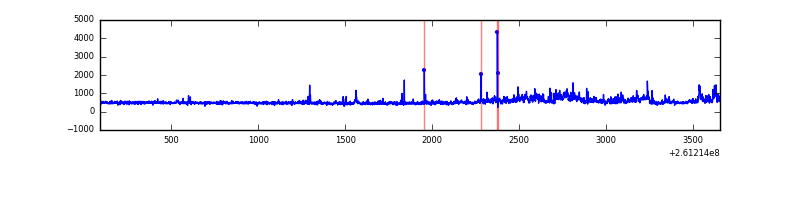 |
| C | 3565 | 3565 | 0 | 0 | 0.00% | 0.00% | 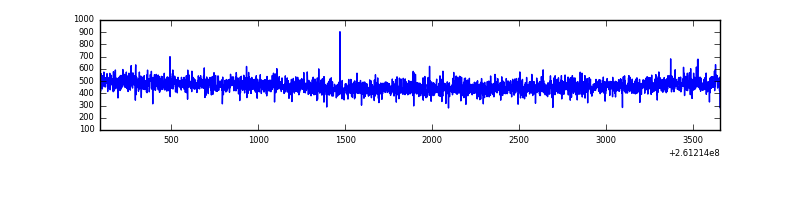 |
| D | 3565 | 3565 | 10 | 10 | 0.28% | 0.28% | 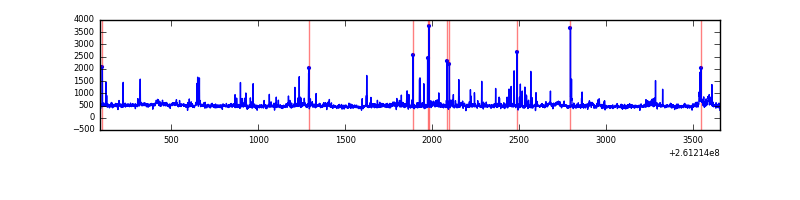 |
Top three noisy pixels from each quadrant. If the there are fewer than three noisy pixels in the level2.evt file, extra rows are filled as -1
| Pixel properties | Quadrant properties | ||||||
|---|---|---|---|---|---|---|---|
| Quadrant | DetID | PixID | Counts | Sigma | Mean | Median | Sigma |
| A | 1 | 162 | 10186 | 112.62 | 422 | 413 | 86.8 |
| A | 1 | 178 | 4092 | 42.4 | 422 | 413 | 86.8 |
| A | 0 | 226 | 3862 | 39.75 | 422 | 413 | 86.8 |
| B | 10 | 244 | 227582 | 2826.04 | 416 | 407 | 80.4 |
| B | 4 | 173 | 37933 | 466.82 | 416 | 407 | 80.4 |
| B | 0 | 219 | 33427 | 410.77 | 416 | 407 | 80.4 |
| C | 3 | 233 | 54731 | 575.86 | 405 | 407 | 94.3 |
| C | 13 | 61 | 3091 | 28.45 | 405 | 407 | 94.3 |
| C | 4 | 254 | 1759 | 14.33 | 405 | 407 | 94.3 |
| D | 8 | 195 | 159548 | 1440.53 | 406 | 399 | 110.5 |
| D | 5 | 222 | 108917 | 982.25 | 406 | 399 | 110.5 |
| D | 10 | 157 | 30709 | 274.35 | 406 | 399 | 110.5 |
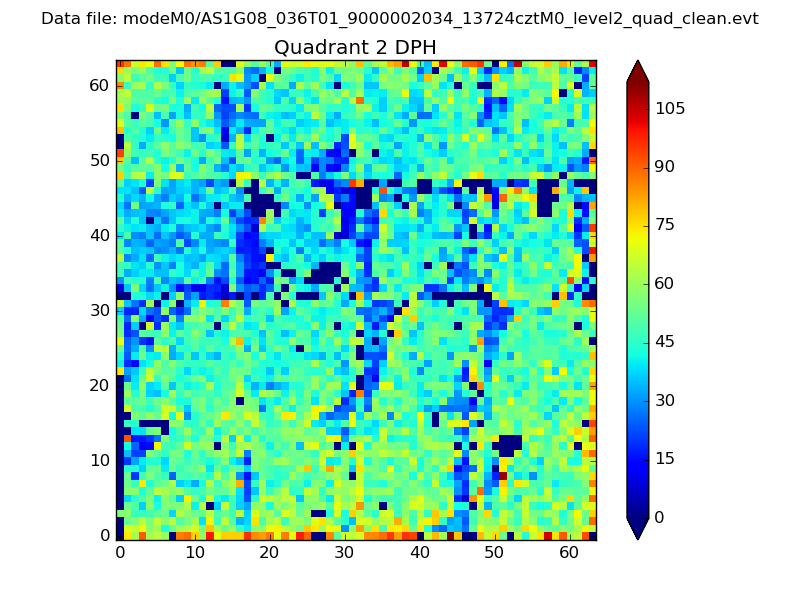
Histogram calculated using DETX and DETY for each event in the final _common_clean file
| Quadrant A | 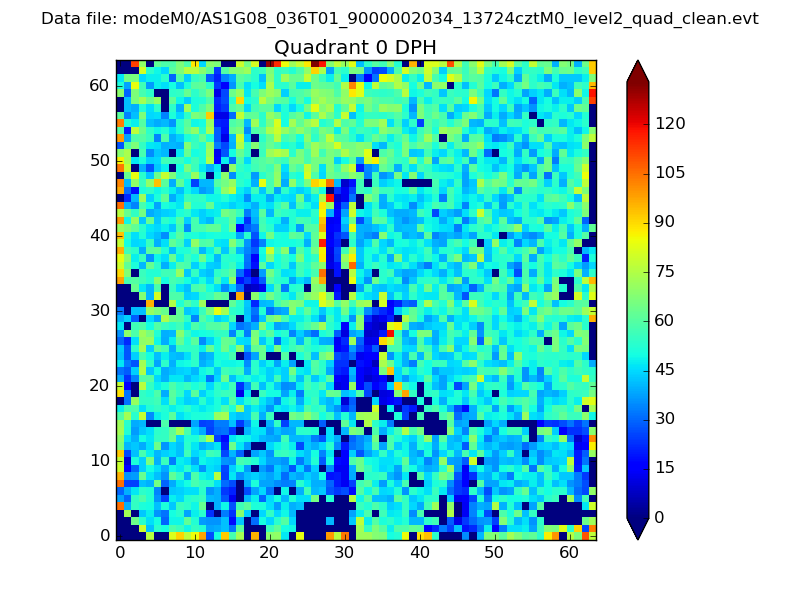 |
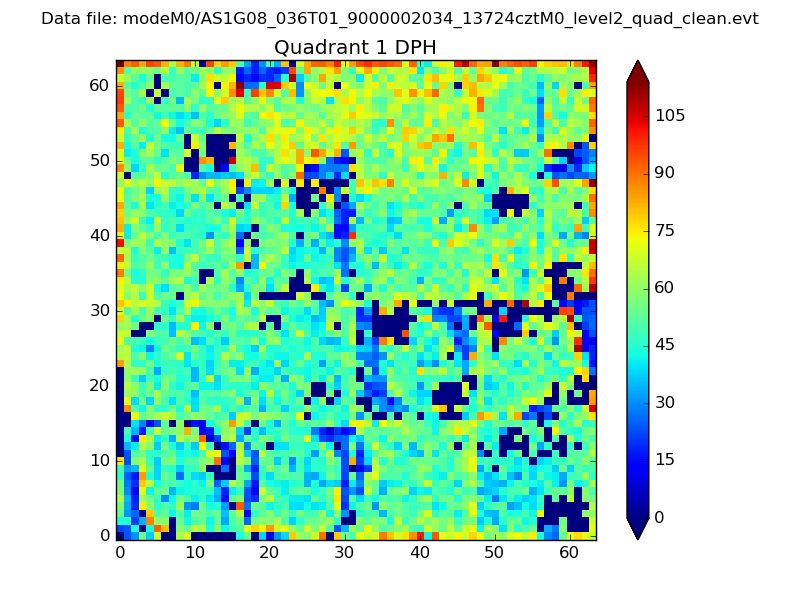 |
Quadrant B |
|---|---|---|---|
| Quadrant D | 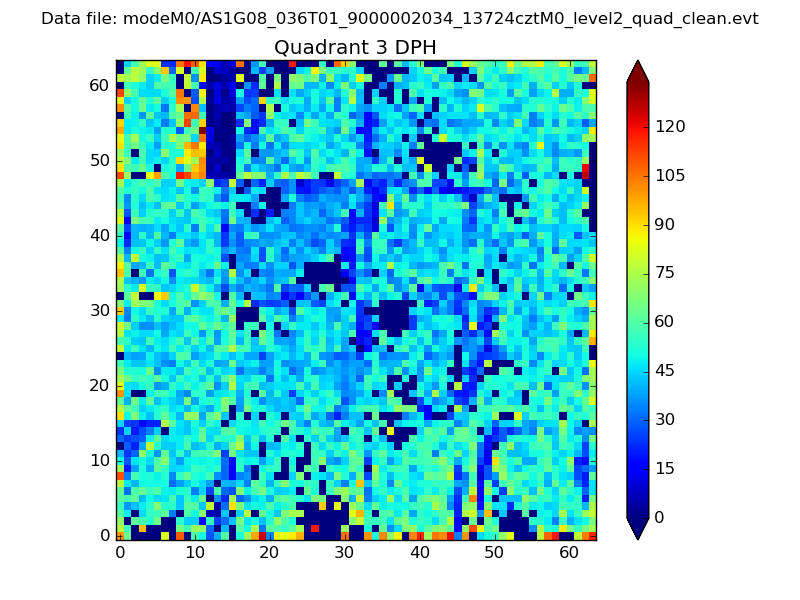 |
 |
Quadrant C |
| Plot type | Count rate plots | Images |
|---|---|---|
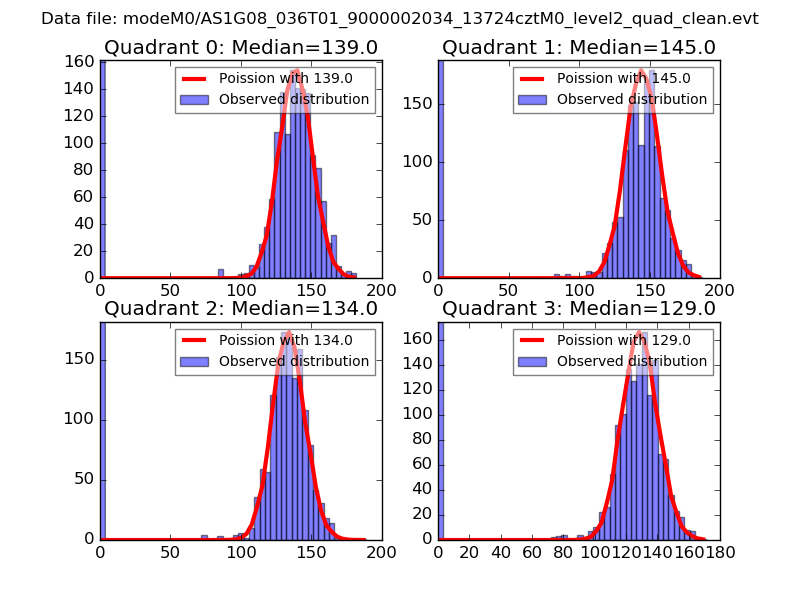
| Comparison with Poisson distribution Blue bars denote a histogram of data divided into 1 sec bins. Red curve is a Poisson curve with rate = median count rate of data. |
 |
 |
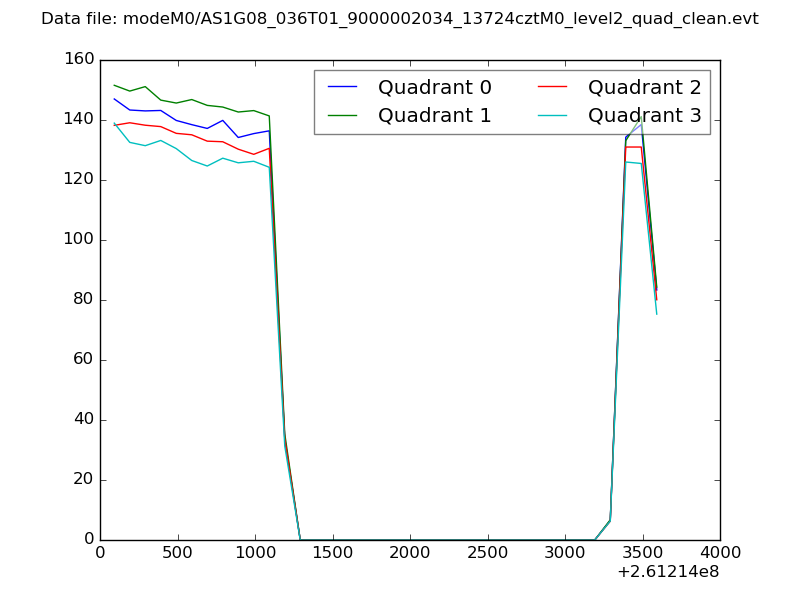
| Quadrant-wise count rates Data is divided into 100 sec bins |
 |
|
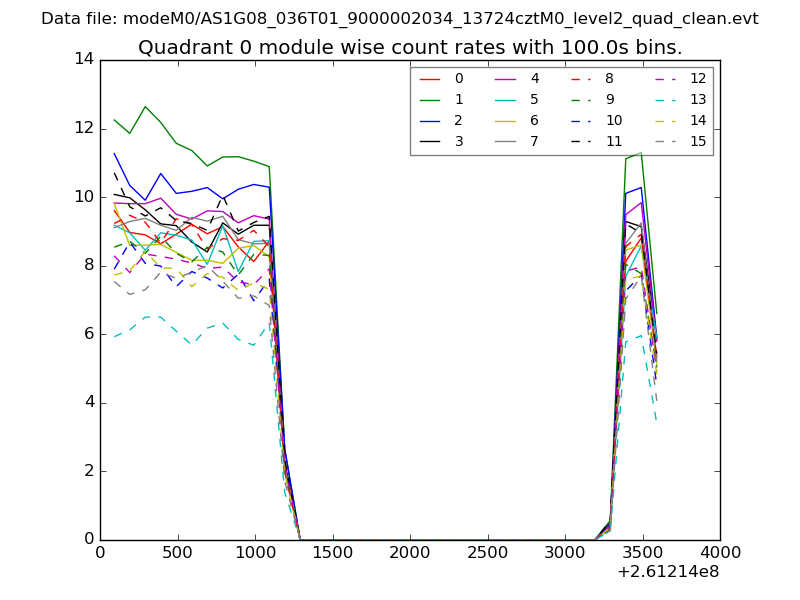
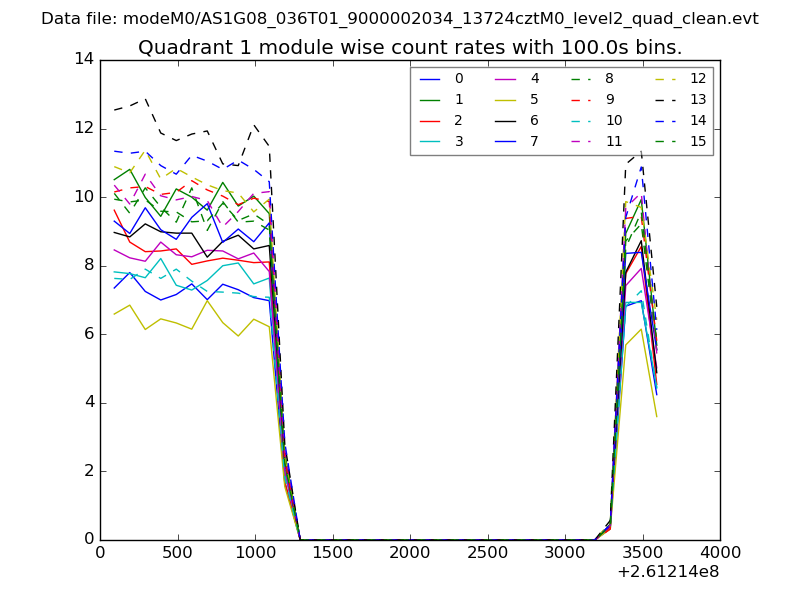
| Module-wise count rates for Quadrant A Data is divided into 100 sec bins |
 |
 |
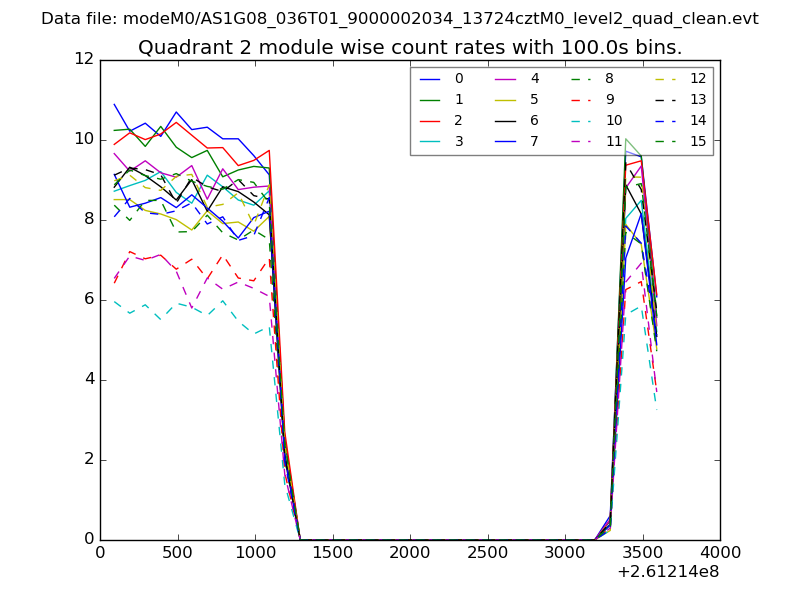
| Module-wise count rates for Quadrant B Data is divided into 100 sec bins |
 |
 |
| Module-wise count rates for Quadrant C Data is divided into 100 sec bins |
 |
 |
| Module-wise count rates for Quadrant D Data is divided into 100 sec bins |
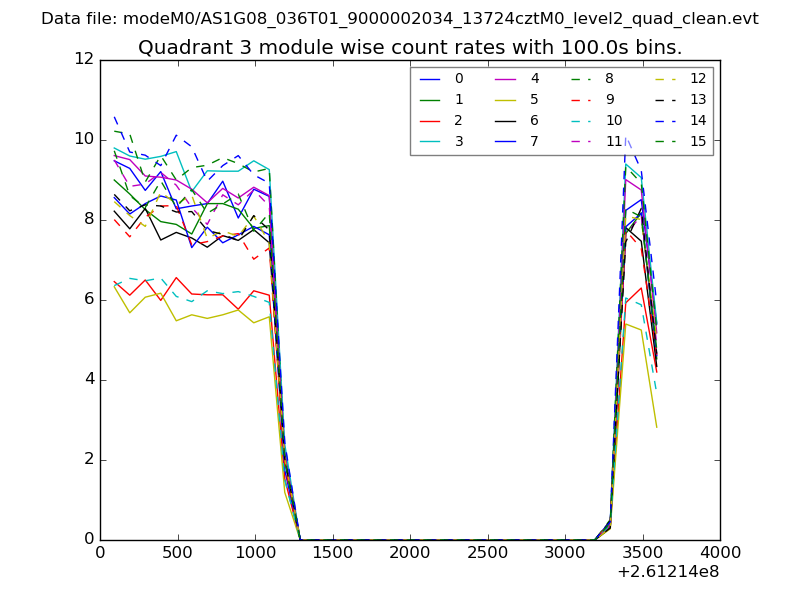 |
 |
| Parameter | Plot |
|---|---|
| CZT HV Monitor | 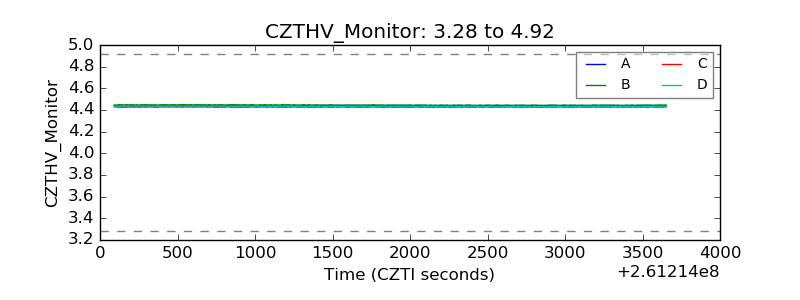 |
| D_VDD | 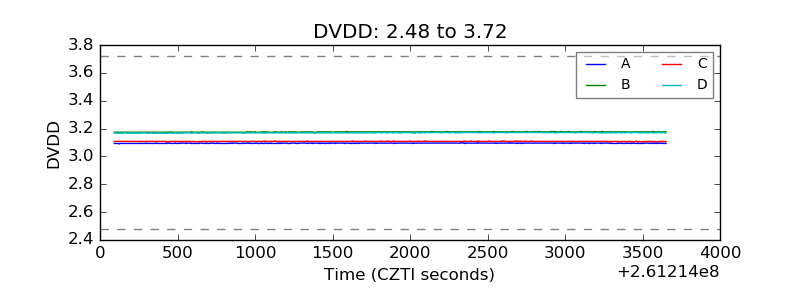 |
| Temperature 1 | 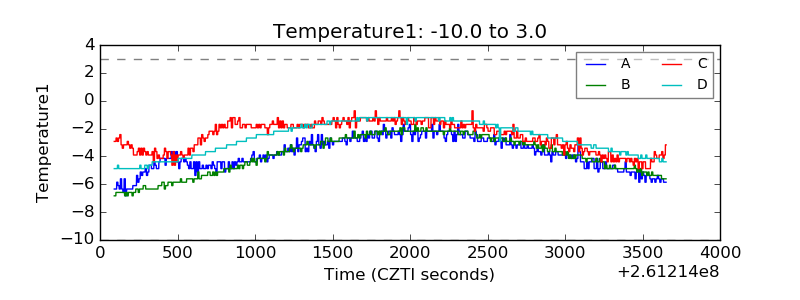 |
| Veto HV Monitor | 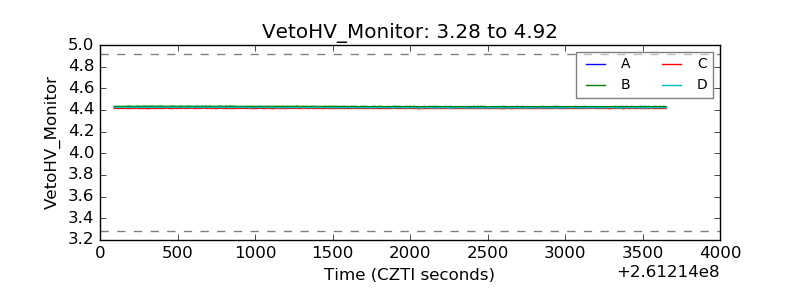 |
| Veto LLD | 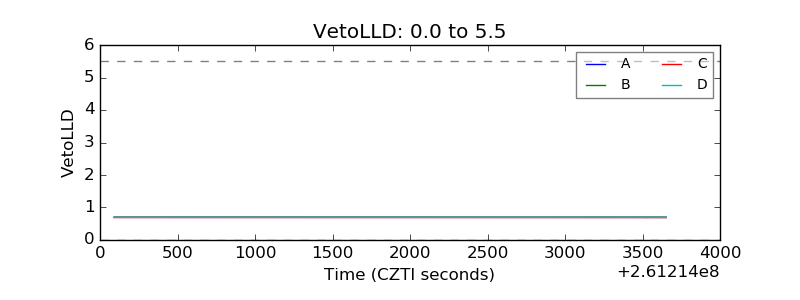 |
| Alpha Counter | 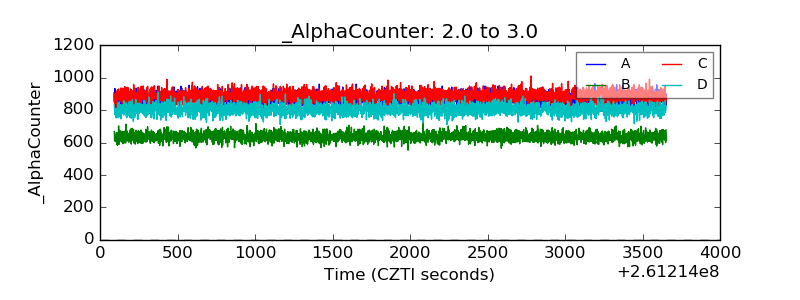 |
| _CPM_Rate | 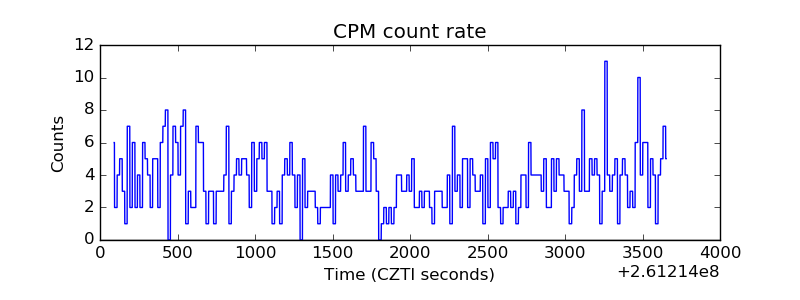 |
| CZT Counter | 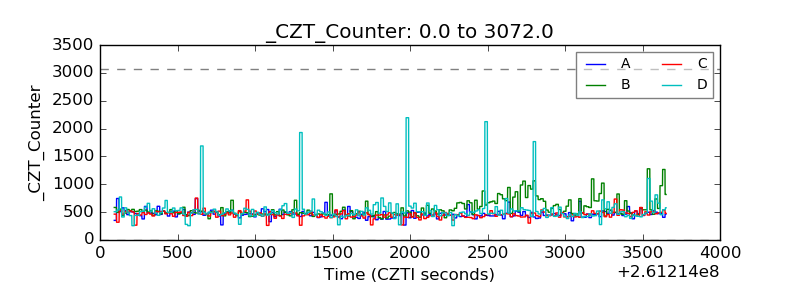 |
| +2.5 Volts monitor |  |
| +5 Volts monitor |  |
| _ROLL_ROT | 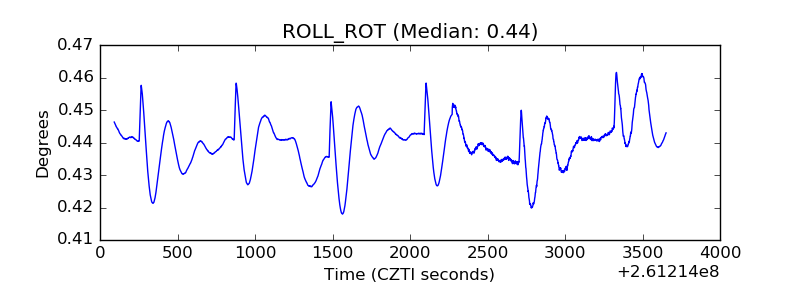 |
| _Roll_DEC | 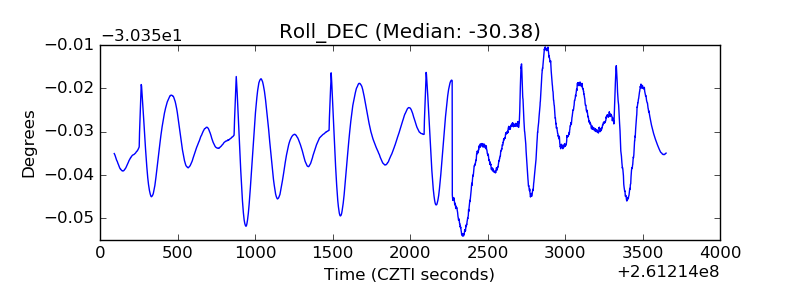 |
| _Roll_RA | 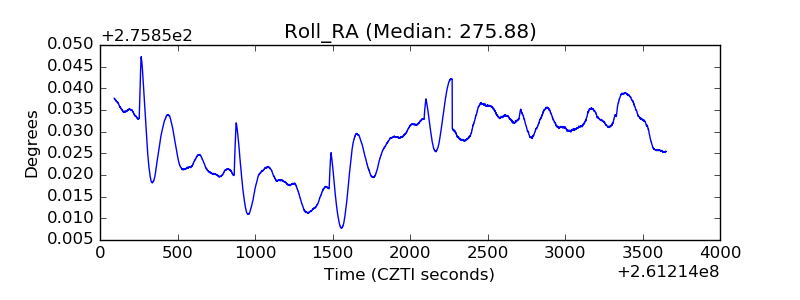 |
| Veto Counter | 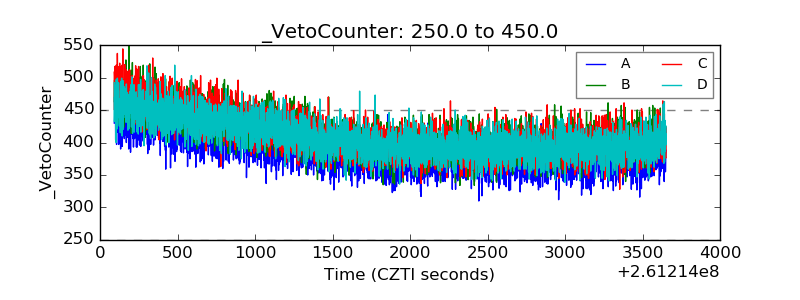 |