| Param | Original file | Final file |
|---|---|---|
| Filename | modeM0/AS1T02_041T01_9000002032cztM0_level2.fits | modeM0/AS1T02_041T01_9000002032cztM0_level2_quad_clean.evt |
| Size (bytes) | 664,067,520 | 896,204,160 |
| Size | 633.3 MB | 854.7 MB |
| Events in quadrant A | 4,028,224 | 5,707,824 |
| Events in quadrant B | 3,880,324 | 5,806,817 |
| Events in quadrant C | 3,952,724 | 5,627,697 |
| Events in quadrant D | 3,439,442 | 5,192,677 |
| Mode M0 | |||
|---|---|---|---|
| Quadrant | BADHDUFLAG | Total packets | Discarded packets |
| A | 0 | 143521 | 0 |
| B | 0 | 149975 | 0 |
| C | 0 | 149808 | 0 |
| D | 0 | 155493 | 0 |
| Mode SS | |||
|---|---|---|---|
| Quadrant | BADHDUFLAG | Total packets | Discarded packets |
| A | 0 | 1428 | 0 |
| B | 0 | 1428 | 0 |
| C | 0 | 1428 | 0 |
| D | 0 | 1428 | 0 |
| Mode M9 | |||
|---|---|---|---|
| Quadrant | BADHDUFLAG | Total packets | Discarded packets |
| A | 0 | 109 | 0 |
| B | 0 | 109 | 0 |
| C | 0 | 109 | 0 |
| D | 0 | 109 | 0 |
| Quadrant | Total seconds | Saturated seconds | Saturation percentage |
|---|---|---|---|
| A | 70163 | 623 | 0.887932% |
| B | 70163 | 924 | 1.316933% |
| C | 70163 | 959 | 1.366817% |
| D | 70163 | 932 | 1.328335% |
Noise dominated data is calculated using 1-second bins in cleaned event files. If a bin has >2000 counts, and if more than 50% of those come from <1% of pixels, then it is considered to be noise-dominated and hence unusable.
| Quadrant | # 1 sec bins | Bins with >0 counts | Bins with >2000 counts | High rate bins dominated by noise | Noise dominated (total time) | Noise dominated (detector-on time) | Marked lightcurve |
|---|---|---|---|---|---|---|---|
| A | 80893 | 70164 | 0 | 0 | 0.00% | 0.00% |  |
| B | 80893 | 70163 | 0 | 0 | 0.00% | 0.00% |  |
| C | 80893 | 70159 | 0 | 0 | 0.00% | 0.00% |  |
| D | 80893 | 70160 | 0 | 0 | 0.00% | 0.00% |  |
Top three noisy pixels from each quadrant. If the there are fewer than three noisy pixels in the level2.evt file, extra rows are filled as -1
| Pixel properties | Quadrant properties | ||||||
|---|---|---|---|---|---|---|---|
| Quadrant | DetID | PixID | Counts | Sigma | Mean | Median | Sigma |
| A | 0 | 29 | 3859 | 10.81 | 1047 | 980 | 266.3 |
| A | 7 | 110 | 3141 | 8.12 | 1047 | 980 | 266.3 |
| A | 0 | 30 | 2928 | 7.32 | 1047 | 980 | 266.3 |
| B | 2 | 9 | 3555 | 12.82 | 1024 | 978 | 201.0 |
| B | 14 | 254 | 2645 | 8.29 | 1024 | 978 | 201.0 |
| B | 2 | 8 | 2621 | 8.17 | 1024 | 978 | 201.0 |
| C | 1 | 81 | 3012 | 7.55 | 1043 | 975 | 269.8 |
| C | 1 | 80 | 2930 | 7.24 | 1043 | 975 | 269.8 |
| C | 9 | 233 | 2709 | 6.42 | 1043 | 975 | 269.8 |
| D | 6 | 231 | 2579 | 6.39 | 980 | 890 | 264.1 |
| D | 6 | 67 | 2526 | 6.19 | 980 | 890 | 264.1 |
| D | 3 | 14 | 2495 | 6.08 | 980 | 890 | 264.1 |
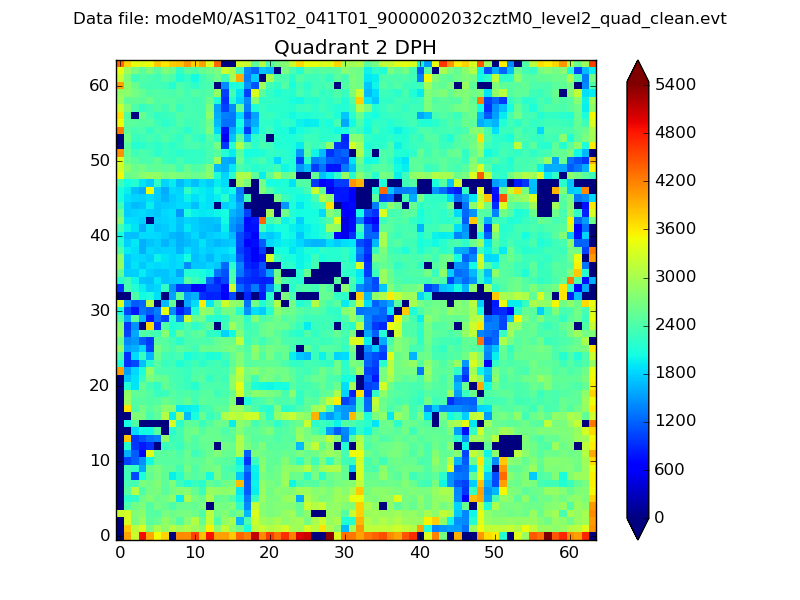
Histogram calculated using DETX and DETY for each event in the final _common_clean file
| Quadrant A |  |
 |
Quadrant B |
|---|---|---|---|
| Quadrant D |  |
 |
Quadrant C |
| Plot type | Count rate plots | Images |
|---|---|---|
| Comparison with Poisson distribution Blue bars denote a histogram of data divided into 1 sec bins. Red curve is a Poisson curve with rate = median count rate of data. |
 |
 |
| Quadrant-wise count rates Data is divided into 100 sec bins |
 |
|
| Module-wise count rates for Quadrant A Data is divided into 100 sec bins |
 |
 |
| Module-wise count rates for Quadrant B Data is divided into 100 sec bins |
 |
 |
| Module-wise count rates for Quadrant C Data is divided into 100 sec bins |
 |
 |
| Module-wise count rates for Quadrant D Data is divided into 100 sec bins |
 |
 |
| Parameter | Plot |
|---|---|
| CZT HV Monitor |  |
| D_VDD |  |
| Temperature 1 |  |
| Veto HV Monitor |  |
| Veto LLD |  |
| Alpha Counter |  |
| _CPM_Rate |  |
| CZT Counter |  |
| +2.5 Volts monitor |  |
| +5 Volts monitor |  |
| _ROLL_ROT |  |
| _Roll_DEC |  |
| _Roll_RA |  |
| Veto Counter |  |