| Param | Original file | Final file |
|---|---|---|
| Filename | modeM0/AS1T02_041T01_9000002032_13705cztM0_level2.evt | modeM0/AS1T02_041T01_9000002032_13705cztM0_level2_quad_clean.evt |
| Size (bytes) | 181,189,440 | 53,631,360 |
| Size | 172.8 MB | 51.1 MB |
| Events in quadrant A | 1,229,838 | 358,597 |
| Events in quadrant B | 1,385,011 | 371,970 |
| Events in quadrant C | 1,273,606 | 369,121 |
| Events in quadrant D | 1,429,233 | 347,143 |
| Mode M0 | |||
|---|---|---|---|
| Quadrant | BADHDUFLAG | Total packets | Discarded packets |
| A | 0 | 5170 | 2 |
| B | 0 | 5612 | 1 |
| C | 0 | 5255 | 1 |
| D | 0 | 5878 | 1 |
| Mode SS | |||
|---|---|---|---|
| Quadrant | BADHDUFLAG | Total packets | Discarded packets |
| A | 0 | 50 | 0 |
| B | 0 | 50 | 0 |
| C | 0 | 50 | 0 |
| D | 0 | 50 | 0 |
| Mode M9 | |||
|---|---|---|---|
| Quadrant | BADHDUFLAG | Total packets | Discarded packets |
| A | 0 | 13 | 0 |
| B | 0 | 13 | 0 |
| C | 0 | 13 | 0 |
| D | 0 | 13 | 0 |
| Quadrant | Total seconds | Saturated seconds | Saturation percentage |
|---|---|---|---|
| A | 2470 | 3 | 0.121457% |
| B | 2470 | 25 | 1.012146% |
| C | 2470 | 11 | 0.445344% |
| D | 2470 | 40 | 1.619433% |
Noise dominated data is calculated using 1-second bins in cleaned event files. If a bin has >2000 counts, and if more than 50% of those come from <1% of pixels, then it is considered to be noise-dominated and hence unusable.
| Quadrant | # 1 sec bins | Bins with >0 counts | Bins with >2000 counts | High rate bins dominated by noise | Noise dominated (total time) | Noise dominated (detector-on time) | Marked lightcurve |
|---|---|---|---|---|---|---|---|
| A | 3726 | 2472 | 0 | 0 | 0.00% | 0.00% | 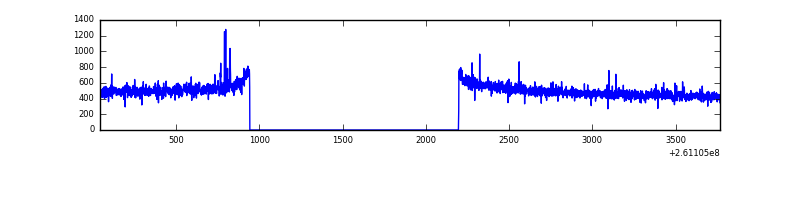 |
| B | 3726 | 2472 | 5 | 5 | 0.13% | 0.20% | 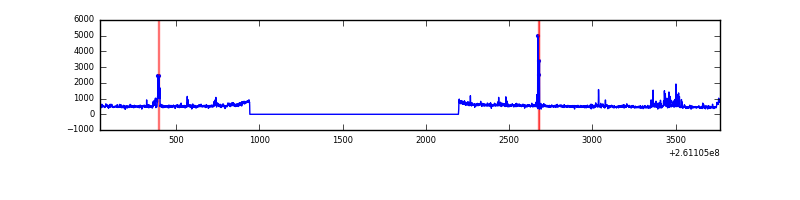 |
| C | 3726 | 2472 | 1 | 1 | 0.03% | 0.04% | 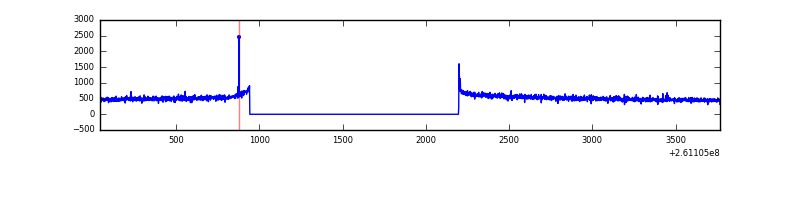 |
| D | 3726 | 2472 | 18 | 18 | 0.48% | 0.73% | 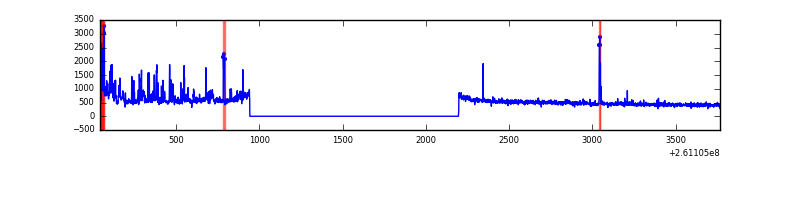 |
Top three noisy pixels from each quadrant. If the there are fewer than three noisy pixels in the level2.evt file, extra rows are filled as -1
| Pixel properties | Quadrant properties | ||||||
|---|---|---|---|---|---|---|---|
| Quadrant | DetID | PixID | Counts | Sigma | Mean | Median | Sigma |
| A | 15 | 157 | 9016 | 135.23 | 316 | 309 | 64.4 |
| A | 1 | 162 | 4658 | 67.54 | 316 | 309 | 64.4 |
| A | 0 | 226 | 2866 | 39.71 | 316 | 309 | 64.4 |
| B | 8 | 250 | 55483 | 904.2 | 320 | 312 | 61.0 |
| B | 0 | 219 | 26792 | 433.98 | 320 | 312 | 61.0 |
| B | 3 | 64 | 23805 | 385.03 | 320 | 312 | 61.0 |
| C | 3 | 233 | 44887 | 616.43 | 314 | 316 | 72.3 |
| C | 14 | 234 | 2866 | 35.27 | 314 | 316 | 72.3 |
| C | 13 | 61 | 2323 | 27.76 | 314 | 316 | 72.3 |
| D | 13 | 122 | 158996 | 2137.55 | 307 | 298 | 74.2 |
| D | 1 | 52 | 59070 | 791.62 | 307 | 298 | 74.2 |
| D | 8 | 195 | 20555 | 272.85 | 307 | 298 | 74.2 |
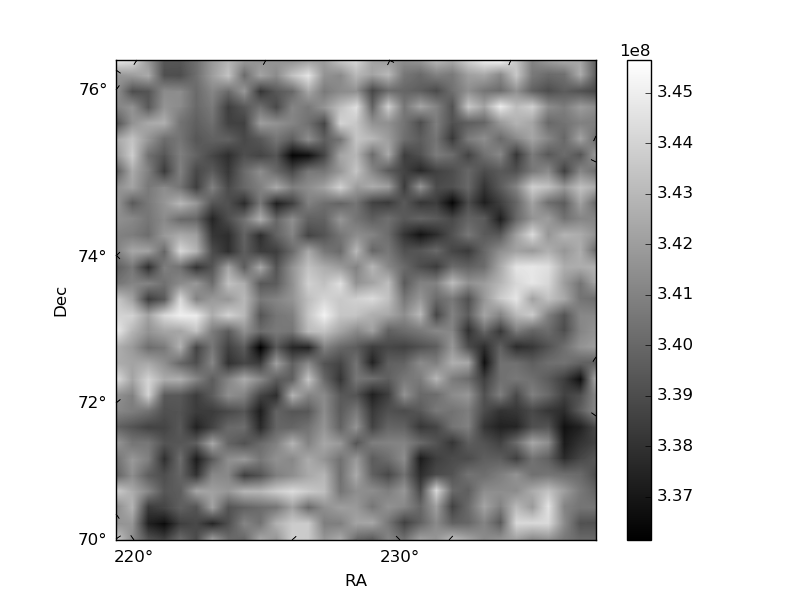
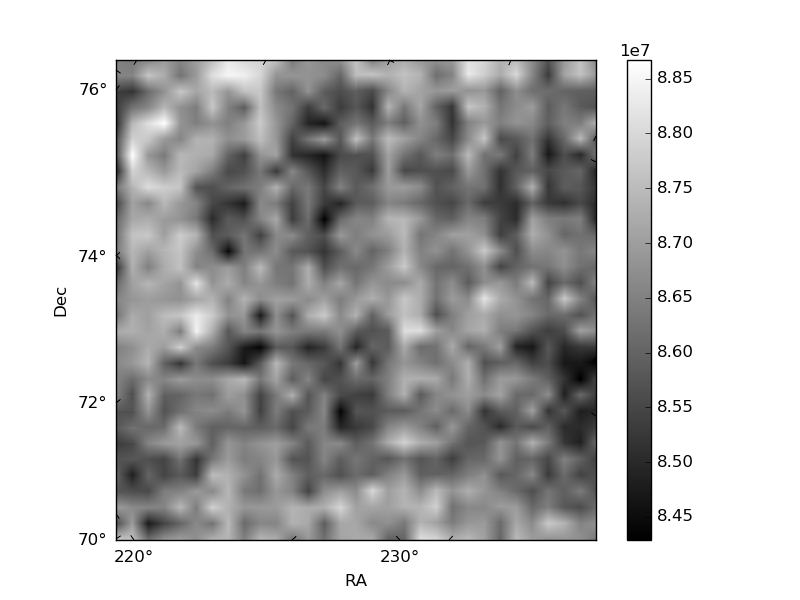
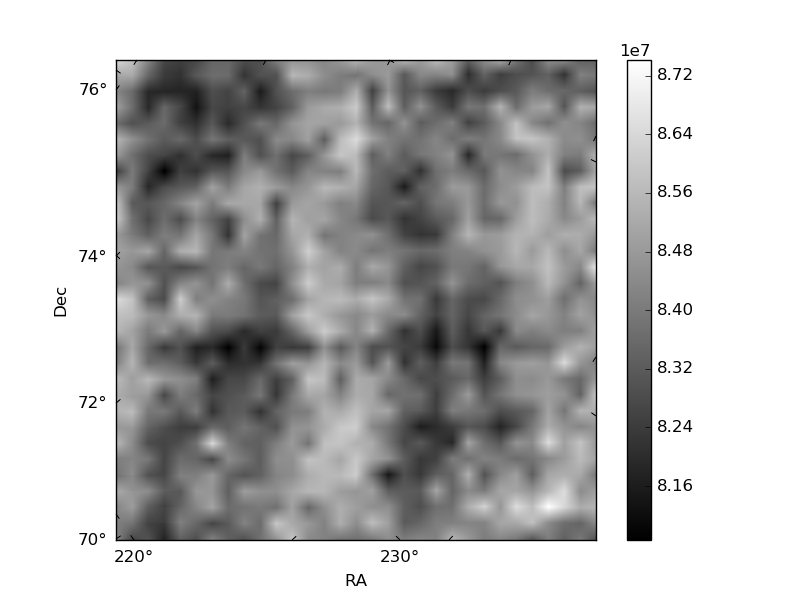
Histogram calculated using DETX and DETY for each event in the final _common_clean file
| Quadrant A | 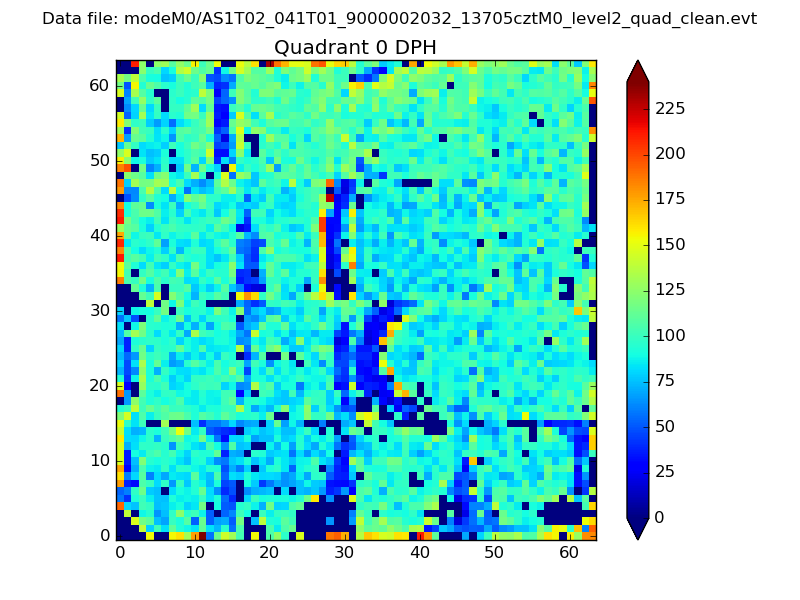 |
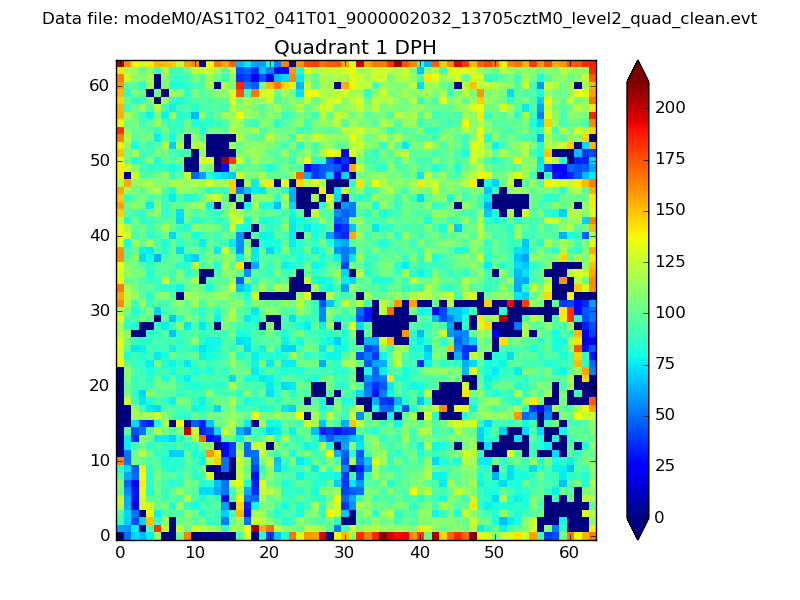 |
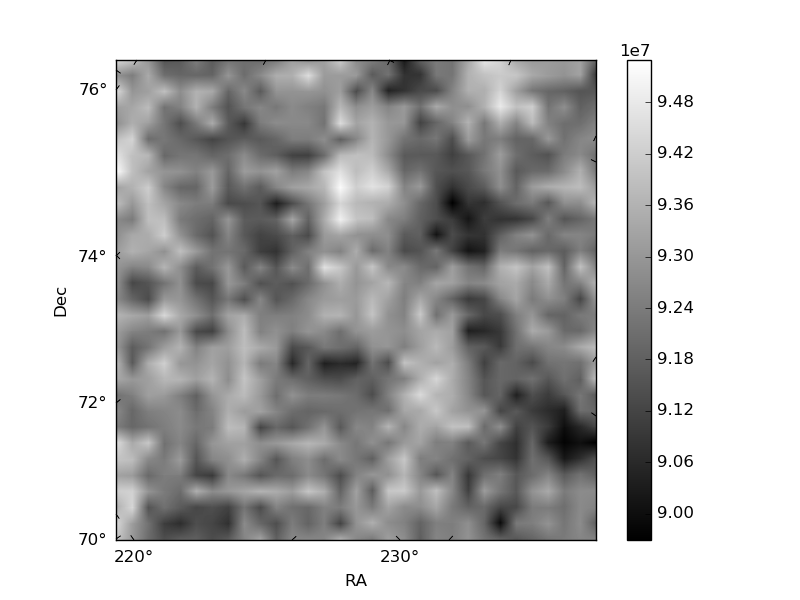
Quadrant B |
|---|---|---|---|
| Quadrant D | 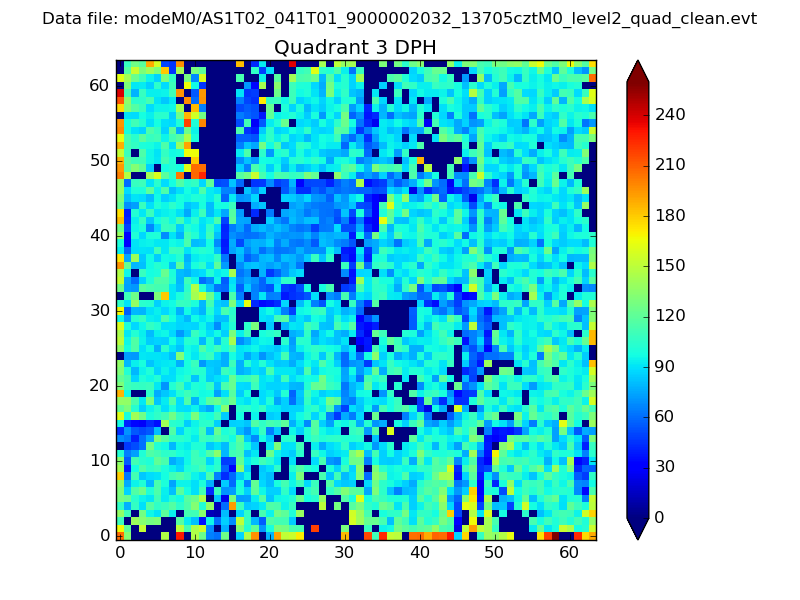 |
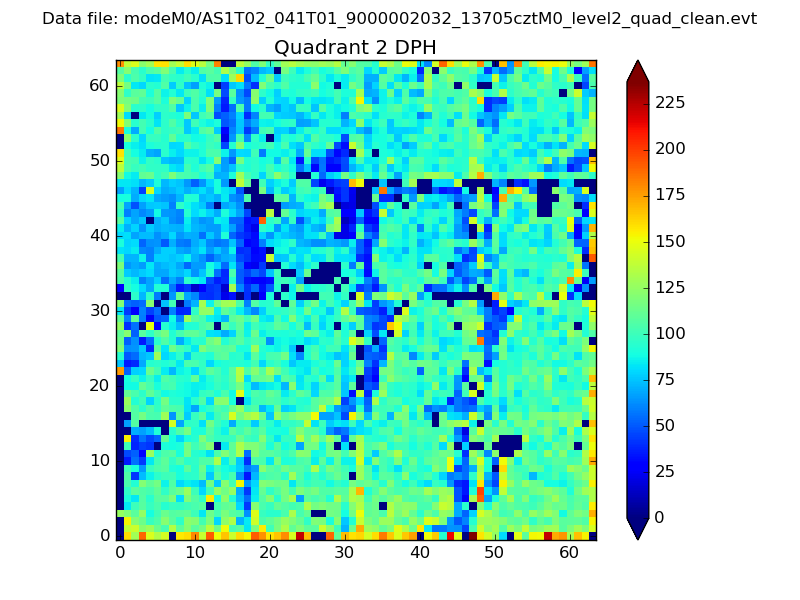 |
Quadrant C |
| Plot type | Count rate plots | Images |
|---|---|---|
| Comparison with Poisson distribution Blue bars denote a histogram of data divided into 1 sec bins. Red curve is a Poisson curve with rate = median count rate of data. |
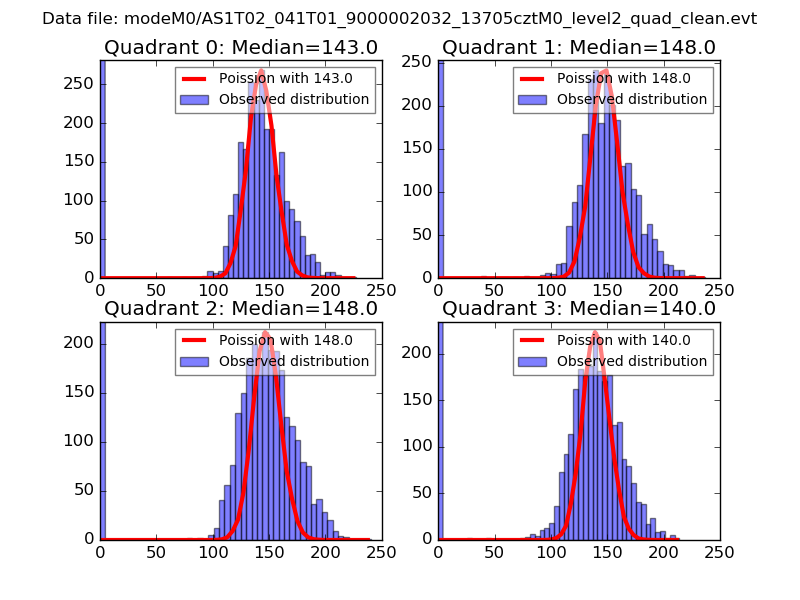 |
 |
| Quadrant-wise count rates Data is divided into 100 sec bins |
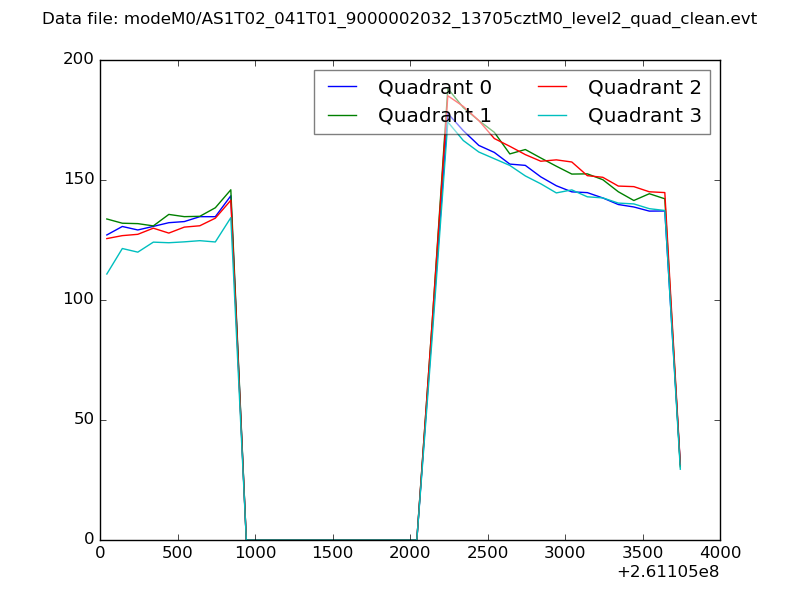 |
|
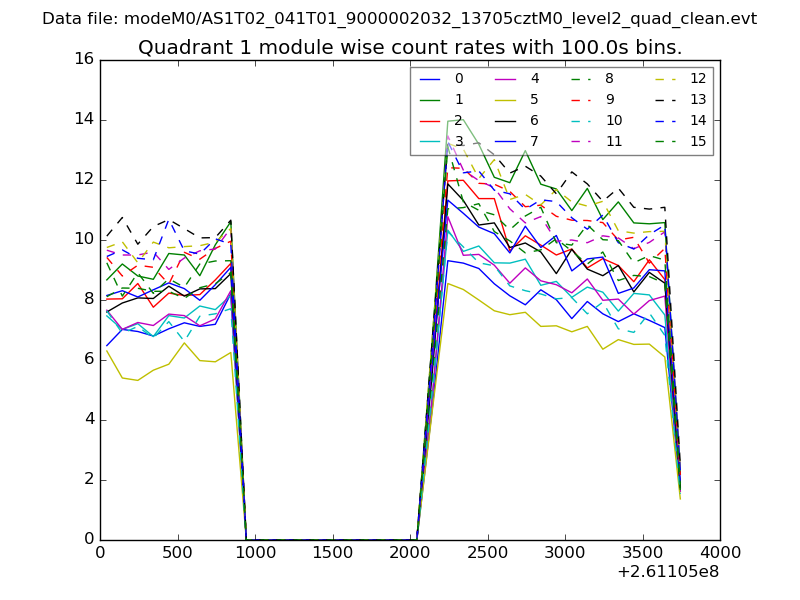
| Module-wise count rates for Quadrant A Data is divided into 100 sec bins |
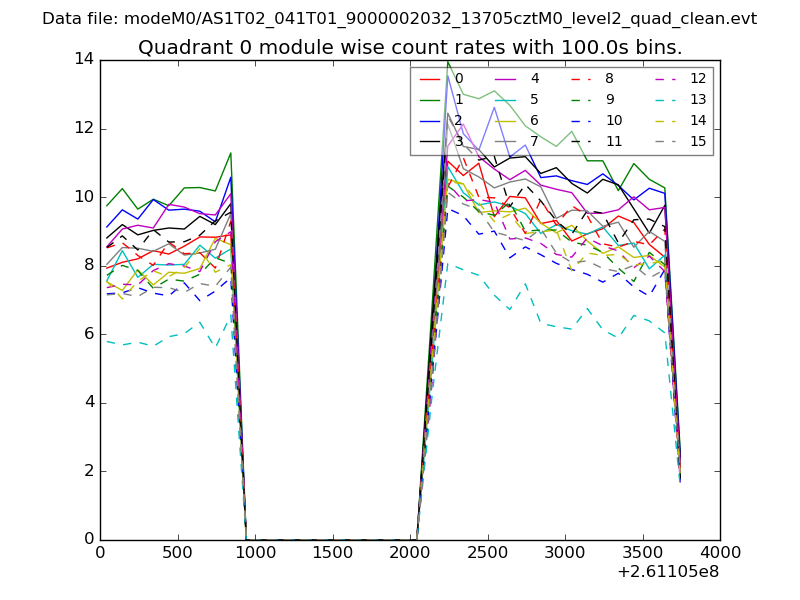 |
 |
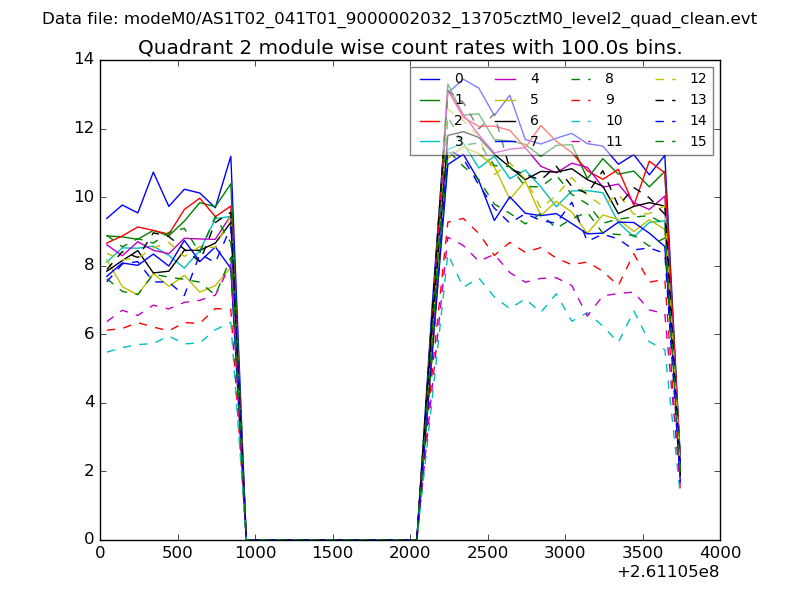
| Module-wise count rates for Quadrant B Data is divided into 100 sec bins |
 |
 |
| Module-wise count rates for Quadrant C Data is divided into 100 sec bins |
 |
 |
| Module-wise count rates for Quadrant D Data is divided into 100 sec bins |
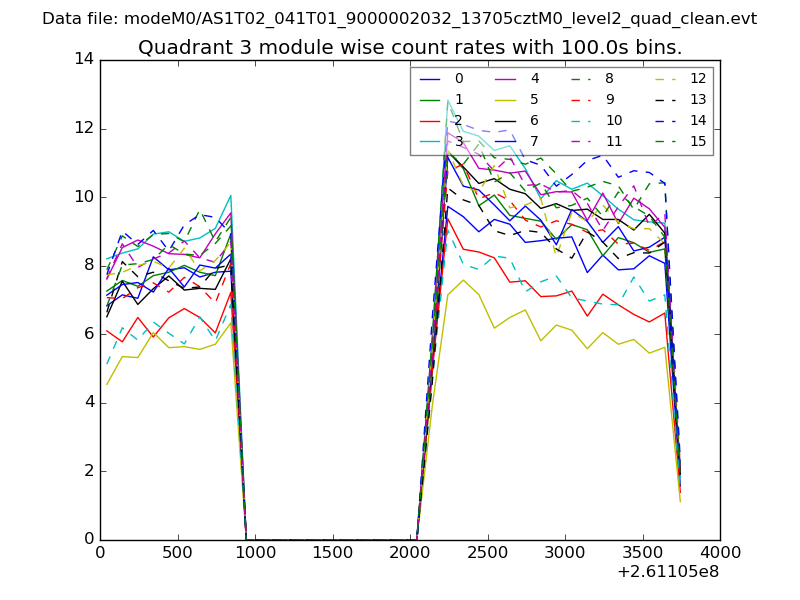 |
 |
| Parameter | Plot |
|---|---|
| CZT HV Monitor | 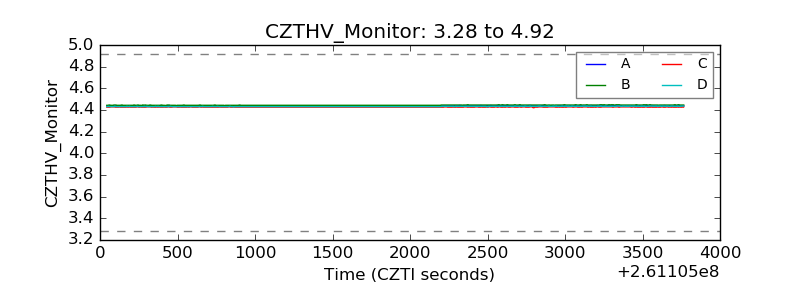 |
| D_VDD |  |
| Temperature 1 | 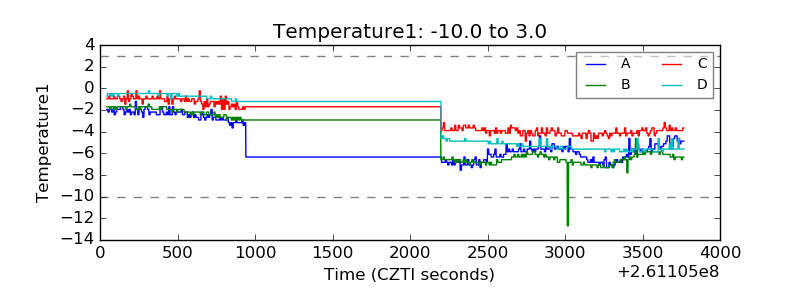 |
| Veto HV Monitor | 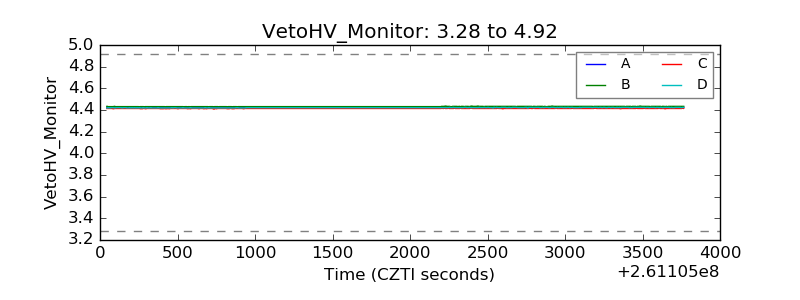 |
| Veto LLD |  |
| Alpha Counter | 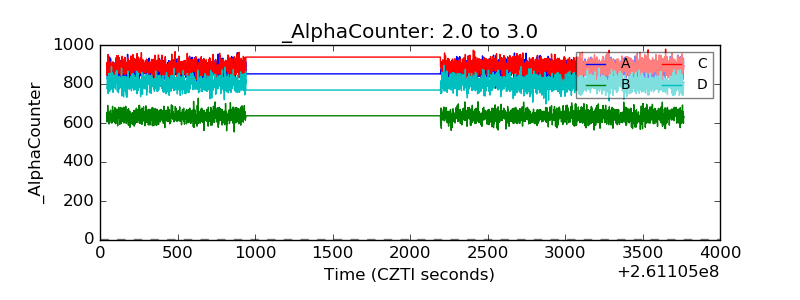 |
| _CPM_Rate | 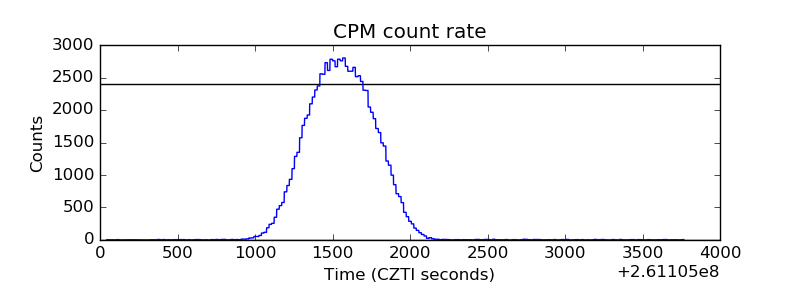 |
| CZT Counter | 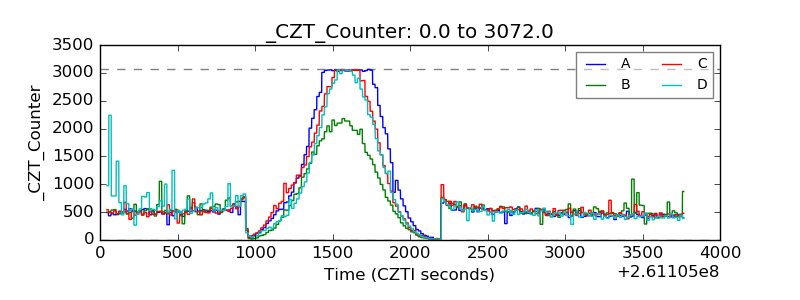 |
| +2.5 Volts monitor |  |
| +5 Volts monitor |  |
| _ROLL_ROT |  |
| _Roll_DEC | 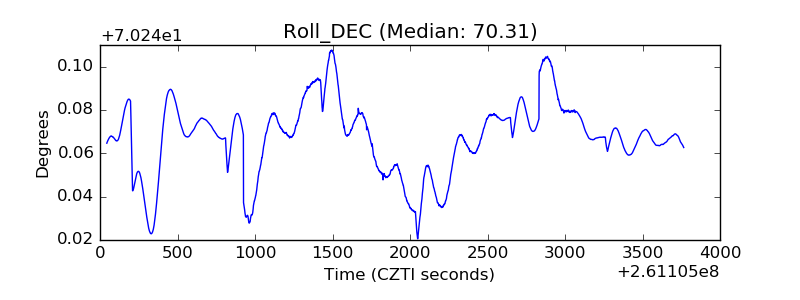 |
| _Roll_RA | 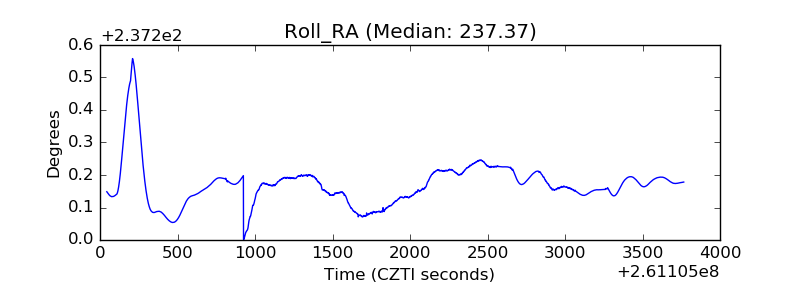 |
| Veto Counter | 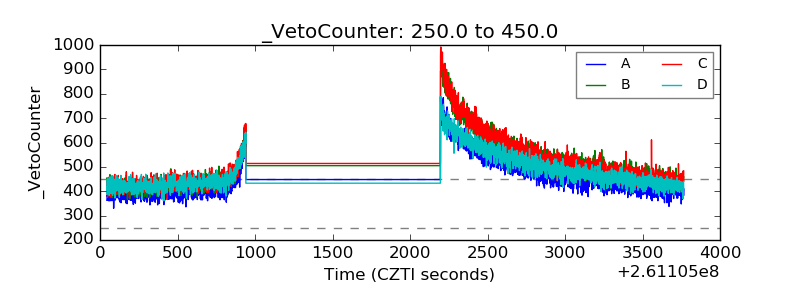 |