| Param | Original file | Final file |
|---|---|---|
| Filename | modeM0/AS1T02_041T01_9000002032_13707cztM0_level2.evt | modeM0/AS1T02_041T01_9000002032_13707cztM0_level2_quad_clean.evt |
| Size (bytes) | 379,592,640 | 120,006,720 |
| Size | 362.0 MB | 114.4 MB |
| Events in quadrant A | 2,693,002 | 802,207 |
| Events in quadrant B | 2,876,284 | 832,572 |
| Events in quadrant C | 2,822,749 | 816,359 |
| Events in quadrant D | 2,714,019 | 783,277 |
| Mode M0 | |||
|---|---|---|---|
| Quadrant | BADHDUFLAG | Total packets | Discarded packets |
| A | 0 | 11640 | 2 |
| B | 0 | 12073 | 1 |
| C | 0 | 11844 | 1 |
| D | 0 | 11976 | 1 |
| Mode SS | |||
|---|---|---|---|
| Quadrant | BADHDUFLAG | Total packets | Discarded packets |
| A | 0 | 118 | 0 |
| B | 0 | 118 | 0 |
| C | 0 | 118 | 0 |
| D | 0 | 118 | 0 |
| Mode M9 | |||
|---|---|---|---|
| Quadrant | BADHDUFLAG | Total packets | Discarded packets |
| A | 0 | 13 | 0 |
| B | 0 | 13 | 0 |
| C | 0 | 13 | 0 |
| D | 0 | 13 | 0 |
| Quadrant | Total seconds | Saturated seconds | Saturation percentage |
|---|---|---|---|
| A | 5723 | 12 | 0.209680% |
| B | 5723 | 32 | 0.559147% |
| C | 5723 | 8 | 0.139787% |
| D | 5723 | 19 | 0.331994% |
Noise dominated data is calculated using 1-second bins in cleaned event files. If a bin has >2000 counts, and if more than 50% of those come from <1% of pixels, then it is considered to be noise-dominated and hence unusable.
| Quadrant | # 1 sec bins | Bins with >0 counts | Bins with >2000 counts | High rate bins dominated by noise | Noise dominated (total time) | Noise dominated (detector-on time) | Marked lightcurve |
|---|---|---|---|---|---|---|---|
| A | 7094 | 5725 | 0 | 0 | 0.00% | 0.00% | 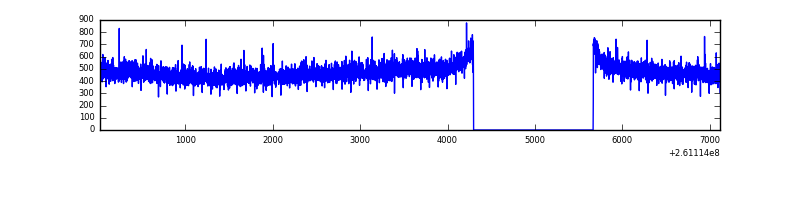 |
| B | 7094 | 5725 | 9 | 9 | 0.13% | 0.16% | 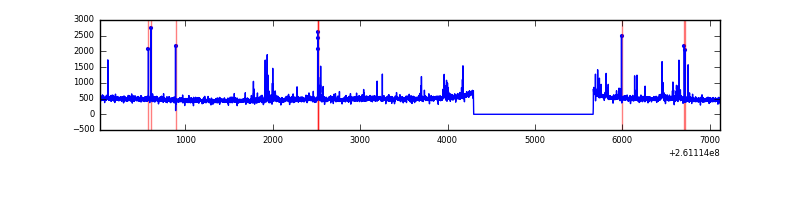 |
| C | 7094 | 5725 | 0 | 0 | 0.00% | 0.00% | 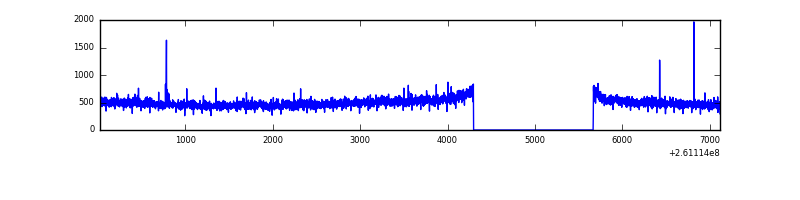 |
| D | 7094 | 5725 | 11 | 11 | 0.16% | 0.19% | 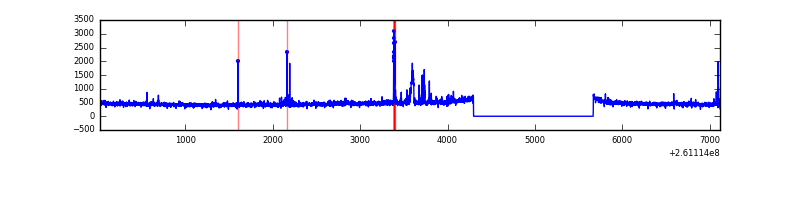 |
Top three noisy pixels from each quadrant. If the there are fewer than three noisy pixels in the level2.evt file, extra rows are filled as -1
| Pixel properties | Quadrant properties | ||||||
|---|---|---|---|---|---|---|---|
| Quadrant | DetID | PixID | Counts | Sigma | Mean | Median | Sigma |
| A | 1 | 162 | 7665 | 50.05 | 697 | 683 | 139.5 |
| A | 0 | 226 | 6292 | 40.21 | 697 | 683 | 139.5 |
| A | 12 | 194 | 5124 | 31.83 | 697 | 683 | 139.5 |
| B | 8 | 250 | 47519 | 362.78 | 701 | 686 | 129.1 |
| B | 4 | 80 | 28969 | 219.09 | 701 | 686 | 129.1 |
| B | 10 | 252 | 21821 | 163.72 | 701 | 686 | 129.1 |
| C | 3 | 233 | 187689 | 1223.48 | 674 | 678 | 152.9 |
| C | 13 | 61 | 5004 | 28.3 | 674 | 678 | 152.9 |
| C | 14 | 234 | 4620 | 25.79 | 674 | 678 | 152.9 |
| D | 9 | 85 | 62950 | 361.56 | 665 | 652 | 172.3 |
| D | 8 | 195 | 44973 | 257.23 | 665 | 652 | 172.3 |
| D | 13 | 249 | 37355 | 213.02 | 665 | 652 | 172.3 |
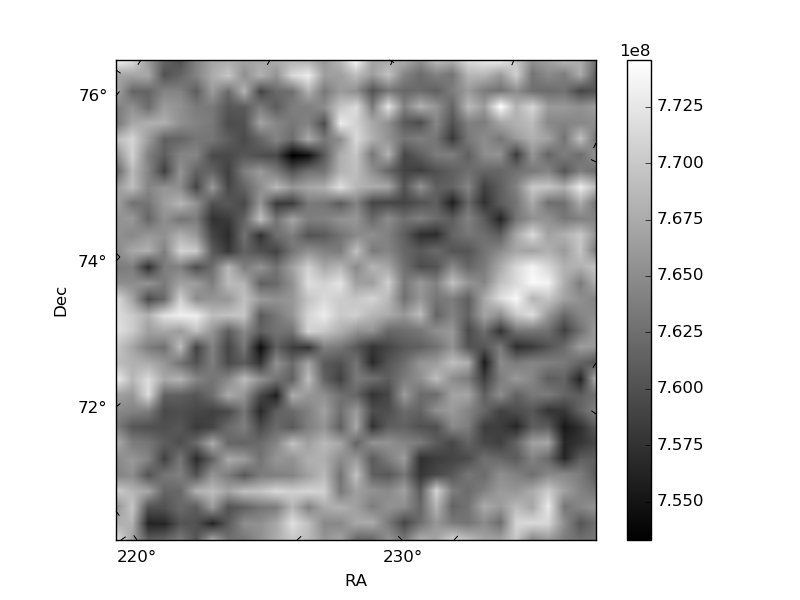
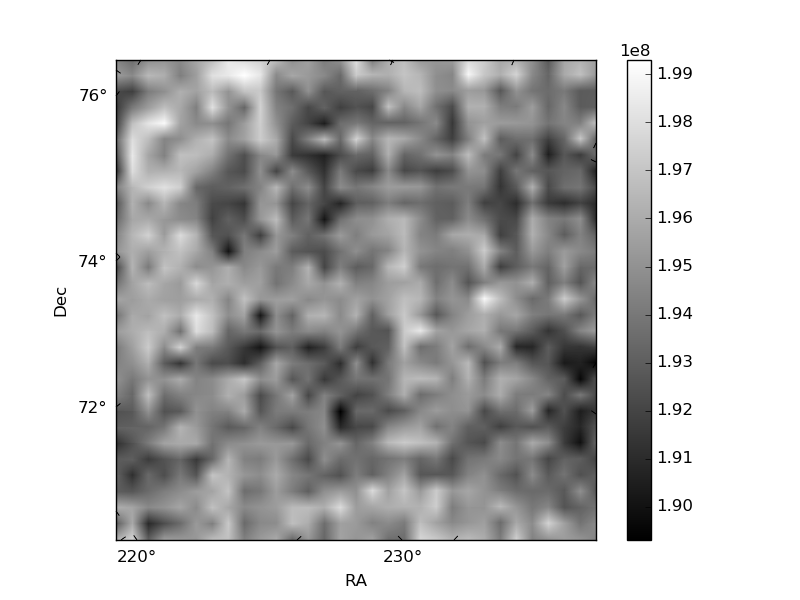
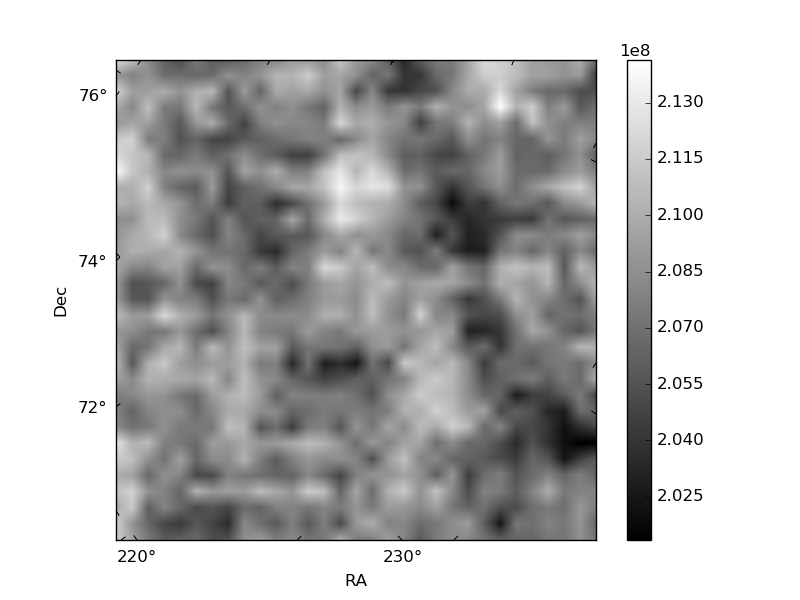
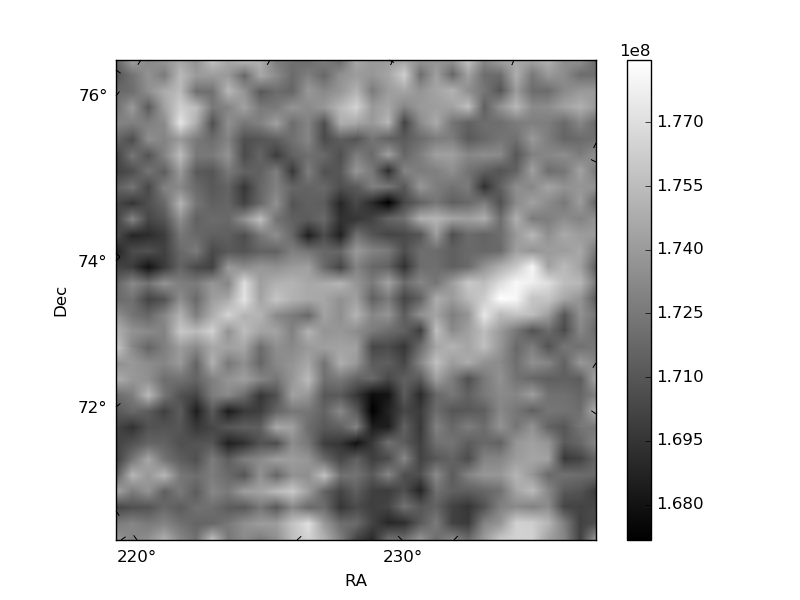
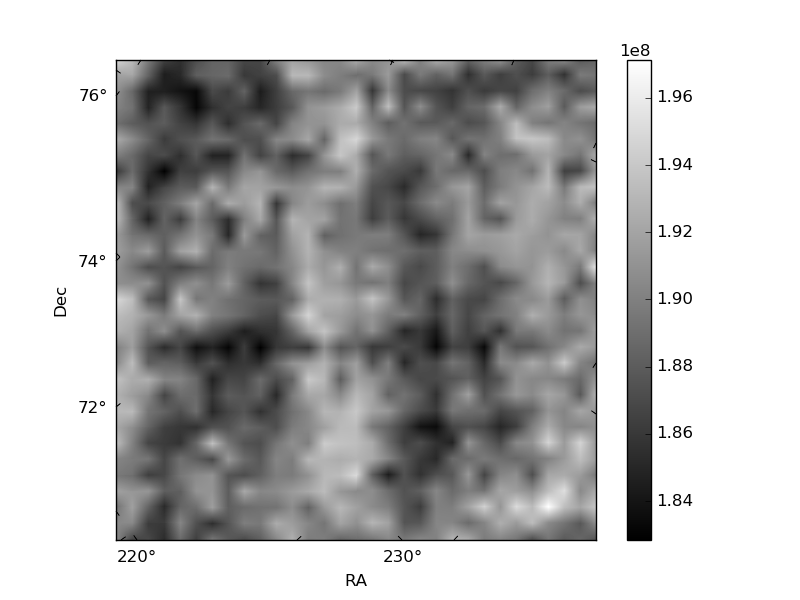
Histogram calculated using DETX and DETY for each event in the final _common_clean file
| Quadrant A | 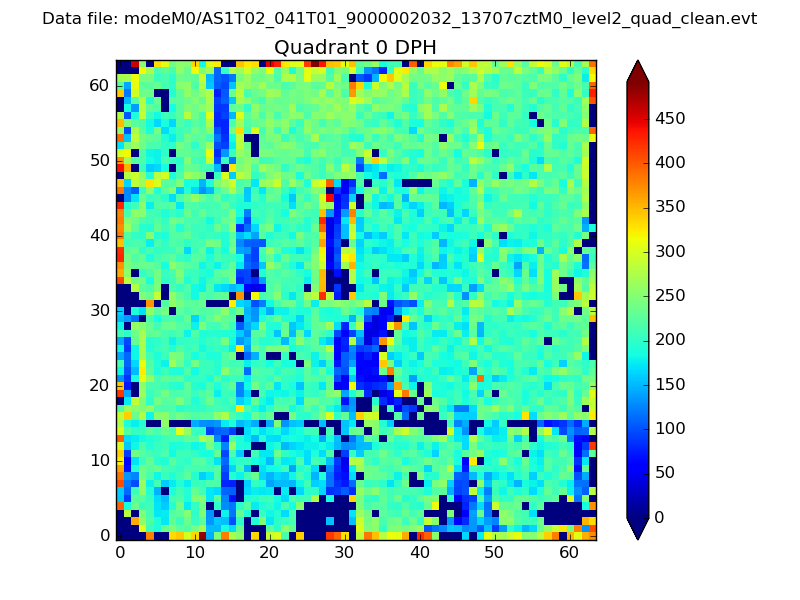 |
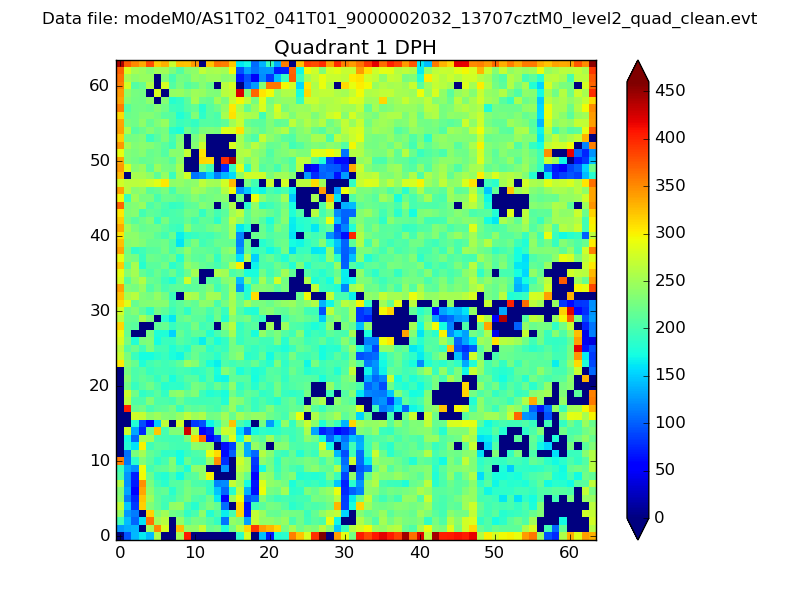 |
Quadrant B |
|---|---|---|---|
| Quadrant D |  |
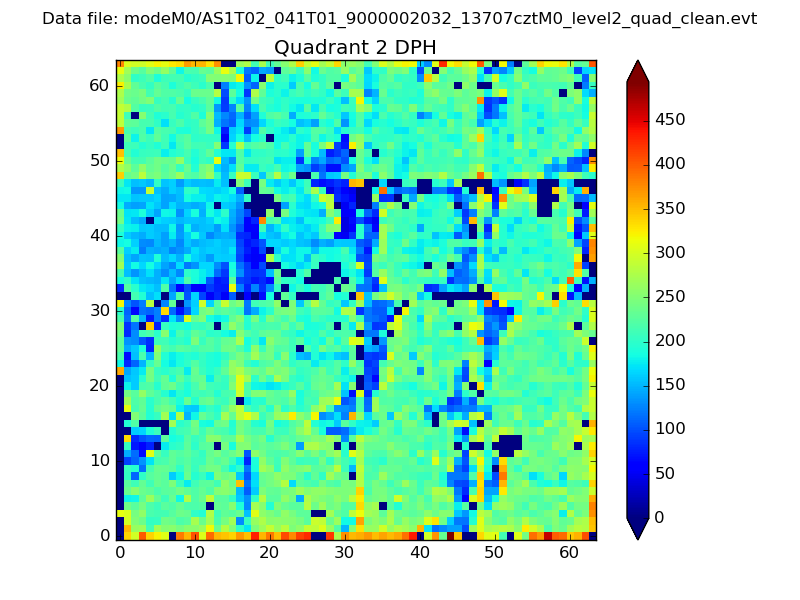 |
Quadrant C |
| Plot type | Count rate plots | Images |
|---|---|---|
| Comparison with Poisson distribution Blue bars denote a histogram of data divided into 1 sec bins. Red curve is a Poisson curve with rate = median count rate of data. |
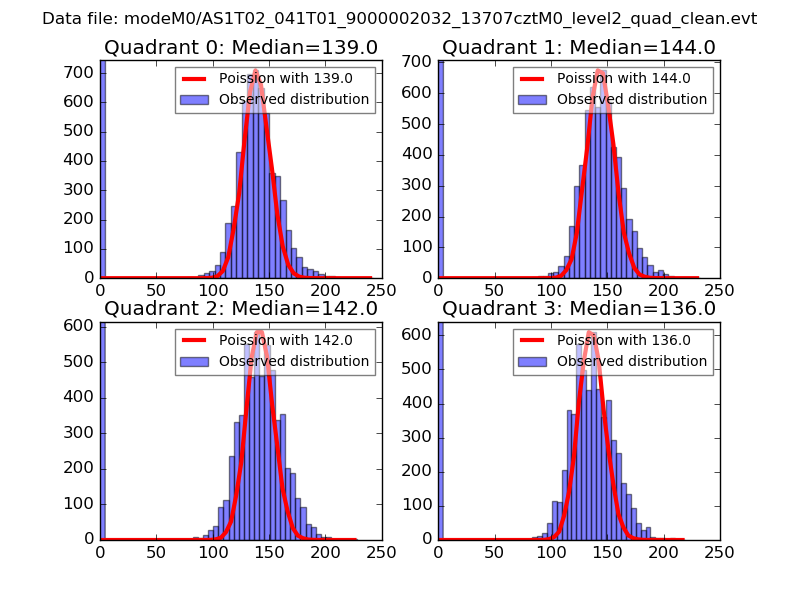 |
 |
| Quadrant-wise count rates Data is divided into 100 sec bins |
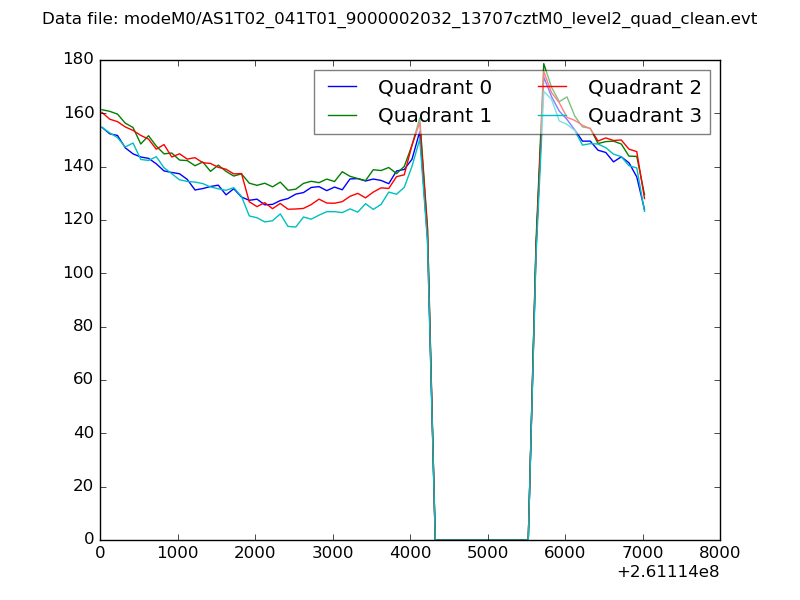 |
|
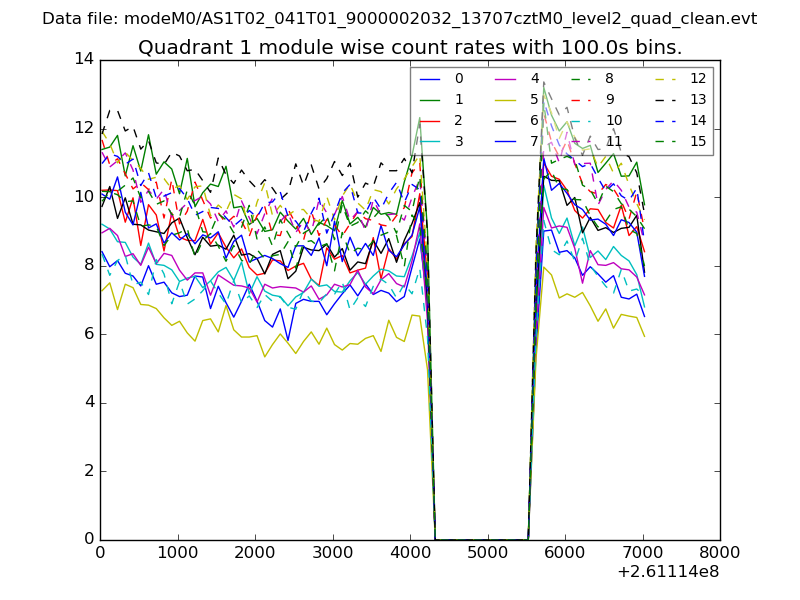
| Module-wise count rates for Quadrant A Data is divided into 100 sec bins |
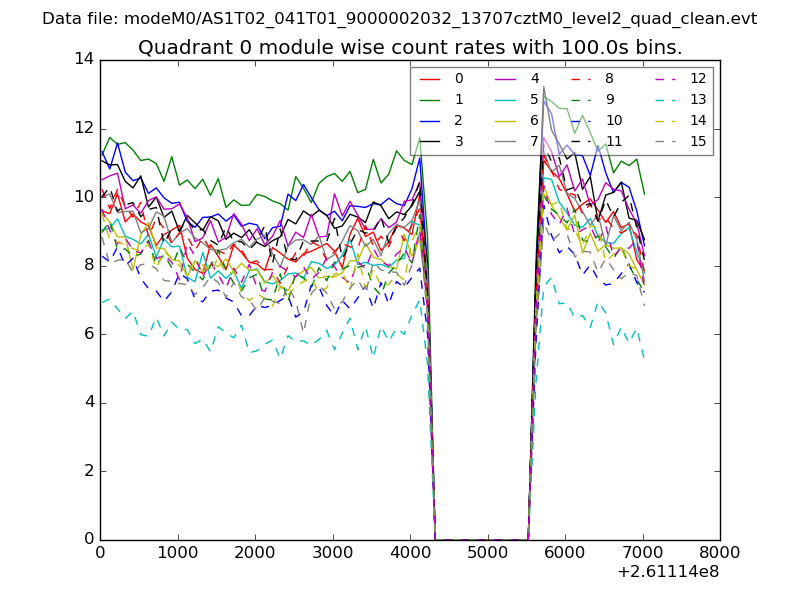 |
 |
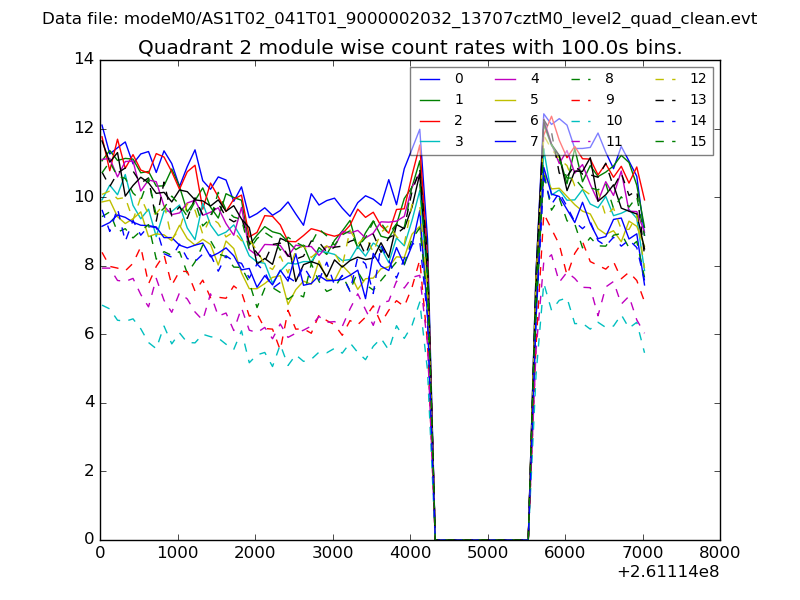
| Module-wise count rates for Quadrant B Data is divided into 100 sec bins |
 |
 |
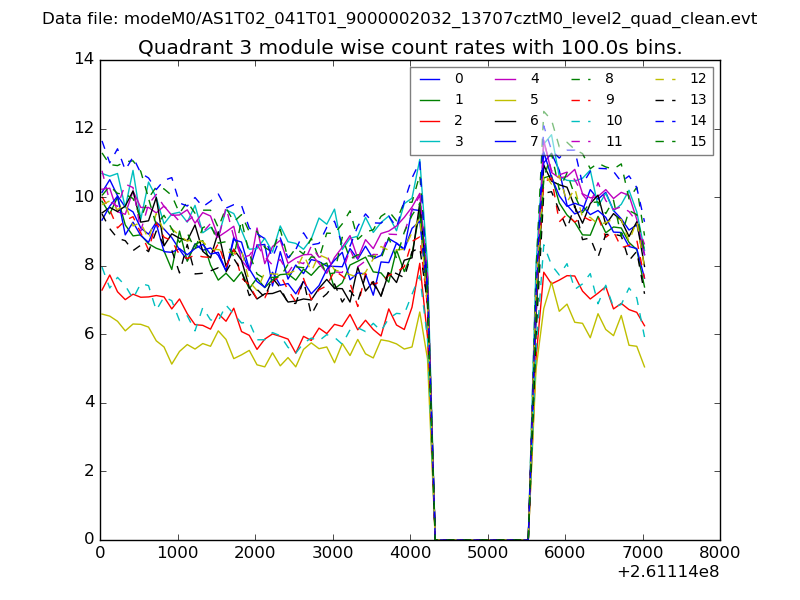
| Module-wise count rates for Quadrant C Data is divided into 100 sec bins |
 |
 |
| Module-wise count rates for Quadrant D Data is divided into 100 sec bins |
 |
 |
| Parameter | Plot |
|---|---|
| CZT HV Monitor | 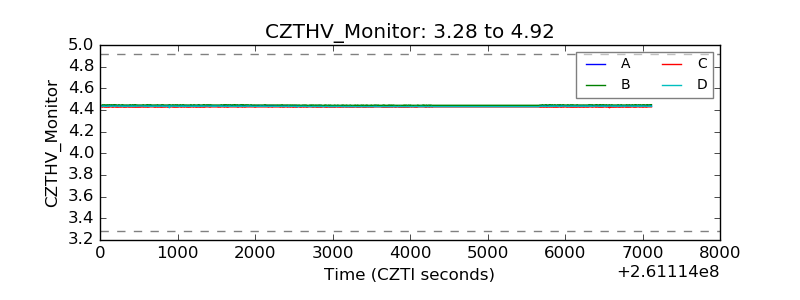 |
| D_VDD | 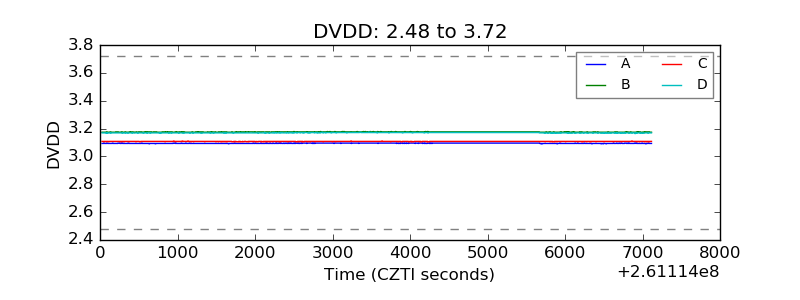 |
| Temperature 1 | 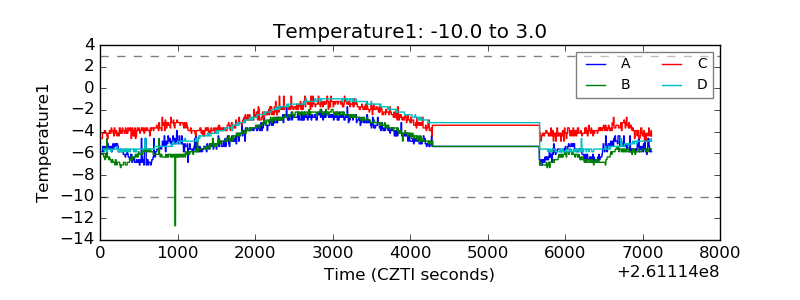 |
| Veto HV Monitor | 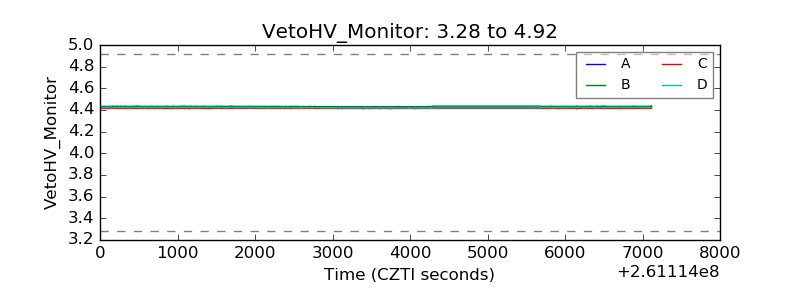 |
| Veto LLD | 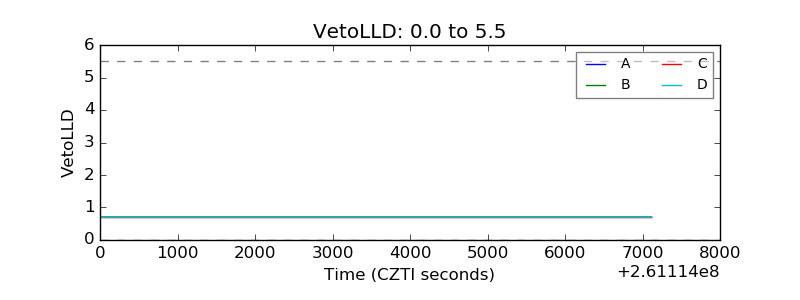 |
| Alpha Counter | 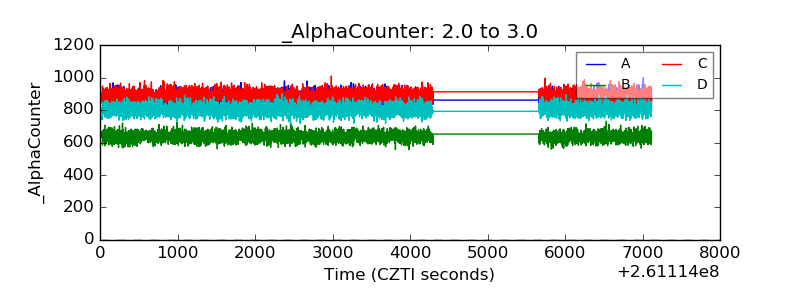 |
| _CPM_Rate | 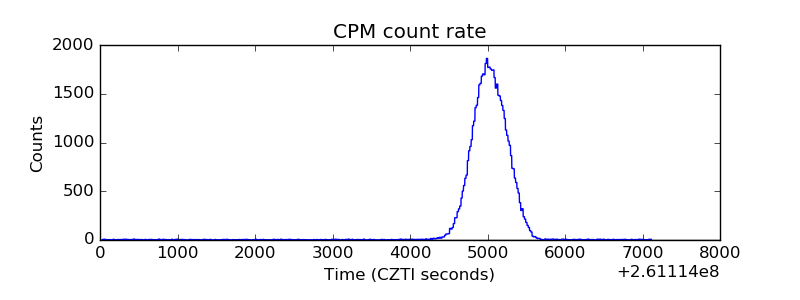 |
| CZT Counter | 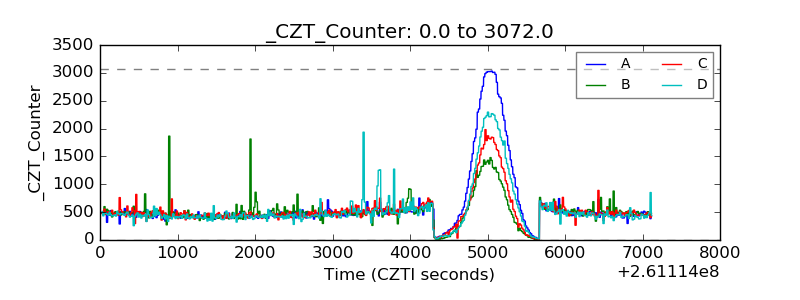 |
| +2.5 Volts monitor |  |
| +5 Volts monitor |  |
| _ROLL_ROT | 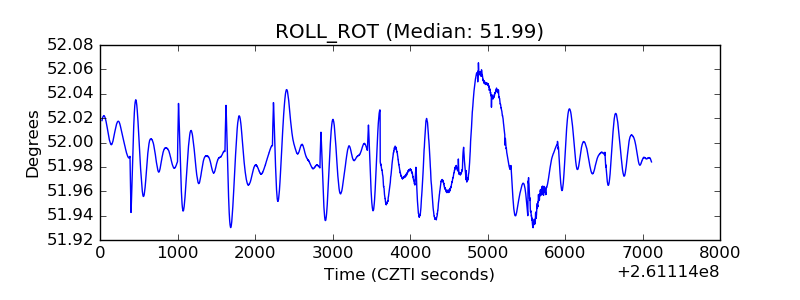 |
| _Roll_DEC | 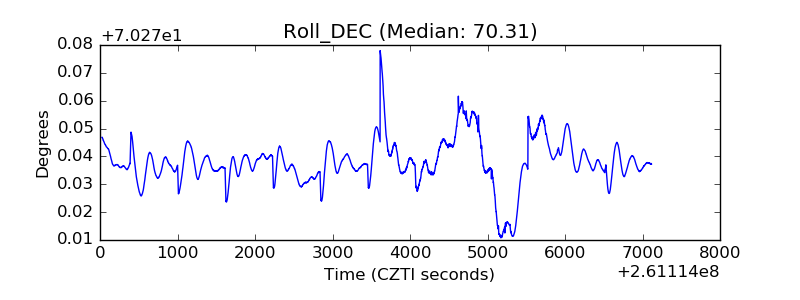 |
| _Roll_RA | 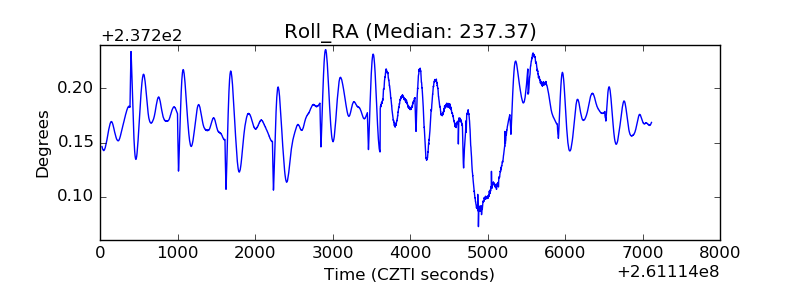 |
| Veto Counter | 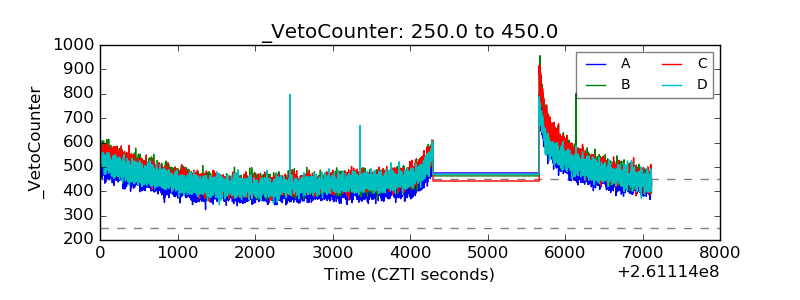 |