| Param | Original file | Final file |
|---|---|---|
| Filename | modeM0/AS1T02_041T01_9000002032_13708cztM0_level2.evt | modeM0/AS1T02_041T01_9000002032_13708cztM0_level2_quad_clean.evt |
| Size (bytes) | 78,546,240 | 22,233,600 |
| Size | 74.9 MB | 21.2 MB |
| Events in quadrant A | 496,019 | 145,667 |
| Events in quadrant B | 514,868 | 148,640 |
| Events in quadrant C | 498,681 | 153,840 |
| Events in quadrant D | 794,829 | 144,416 |
| Mode M0 | |||
|---|---|---|---|
| Quadrant | BADHDUFLAG | Total packets | Discarded packets |
| A | 0 | 2828 | 685 |
| B | 0 | 3000 | 823 |
| C | 0 | 2818 | 670 |
| D | 0 | 3814 | 736 |
| Mode SS | |||
|---|---|---|---|
| Quadrant | BADHDUFLAG | Total packets | Discarded packets |
| A | 0 | 26 | 8 |
| B | 0 | 26 | 6 |
| C | 0 | 26 | 6 |
| D | 0 | 26 | 6 |
| Mode M9 | |||
|---|---|---|---|
| Quadrant | BADHDUFLAG | Total packets | Discarded packets |
| A | 0 | 1 | 0 |
| B | 0 | 1 | 0 |
| C | 0 | 1 | 0 |
| D | 0 | 2 | 1 |
| Quadrant | Total seconds | Saturated seconds | Saturation percentage |
|---|---|---|---|
| A | 1055 | 5 | 0.473934% |
| B | 1040 | 10 | 0.961538% |
| C | 1058 | 2 | 0.189036% |
| D | 1058 | 25 | 2.362949% |
Noise dominated data is calculated using 1-second bins in cleaned event files. If a bin has >2000 counts, and if more than 50% of those come from <1% of pixels, then it is considered to be noise-dominated and hence unusable.
| Quadrant | # 1 sec bins | Bins with >0 counts | Bins with >2000 counts | High rate bins dominated by noise | Noise dominated (total time) | Noise dominated (detector-on time) | Marked lightcurve |
|---|---|---|---|---|---|---|---|
| A | 1375 | 1135 | 0 | 0 | 0.00% | 0.00% | 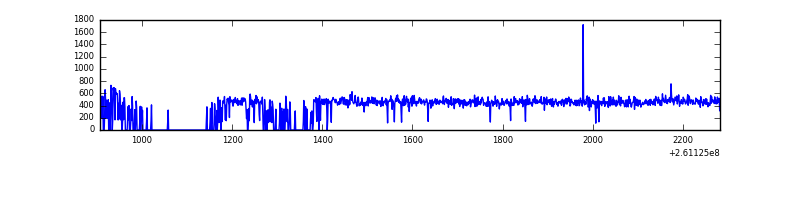 |
| B | 1376 | 1114 | 1 | 1 | 0.07% | 0.09% | 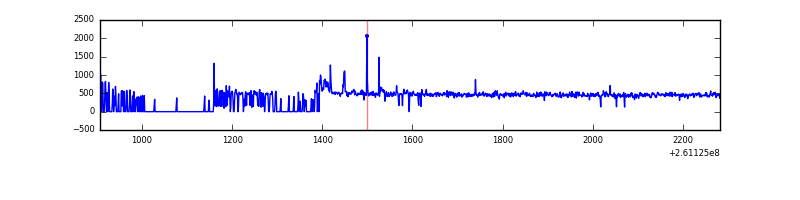 |
| C | 1375 | 1152 | 0 | 0 | 0.00% | 0.00% | 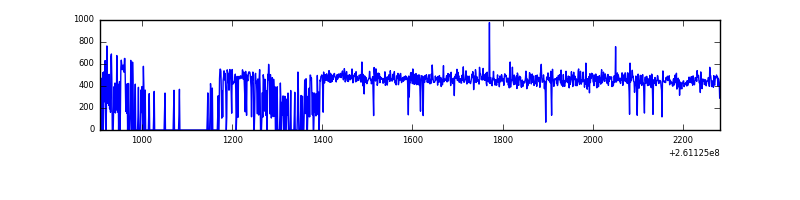 |
| D | 1377 | 1139 | 27 | 27 | 1.96% | 2.37% | 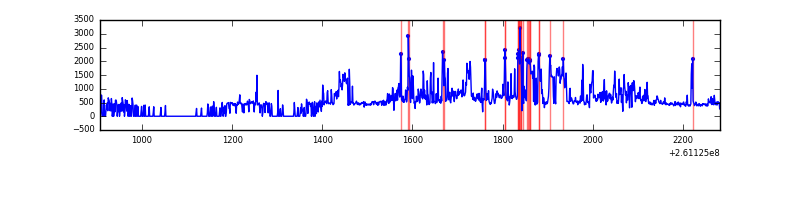 |
Top three noisy pixels from each quadrant. If the there are fewer than three noisy pixels in the level2.evt file, extra rows are filled as -1
| Pixel properties | Quadrant properties | ||||||
|---|---|---|---|---|---|---|---|
| Quadrant | DetID | PixID | Counts | Sigma | Mean | Median | Sigma |
| A | 15 | 222 | 3439 | 121.59 | 127 | 124 | 27.3 |
| A | 1 | 162 | 2711 | 94.89 | 127 | 124 | 27.3 |
| A | 0 | 226 | 1113 | 36.27 | 127 | 124 | 27.3 |
| B | 3 | 64 | 12157 | 465.16 | 125 | 122 | 25.9 |
| B | 8 | 250 | 9238 | 352.34 | 125 | 122 | 25.9 |
| B | 15 | 185 | 5191 | 195.92 | 125 | 122 | 25.9 |
| C | 3 | 233 | 14949 | 494.02 | 122 | 123 | 30.0 |
| C | 8 | 128 | 3614 | 116.32 | 122 | 123 | 30.0 |
| C | 8 | 112 | 1544 | 47.35 | 122 | 123 | 30.0 |
| D | 2 | 136 | 334957 | 11090.14 | 120 | 116 | 30.2 |
| D | 2 | 234 | 3164 | 100.95 | 120 | 116 | 30.2 |
| D | 13 | 122 | 2615 | 82.77 | 120 | 116 | 30.2 |
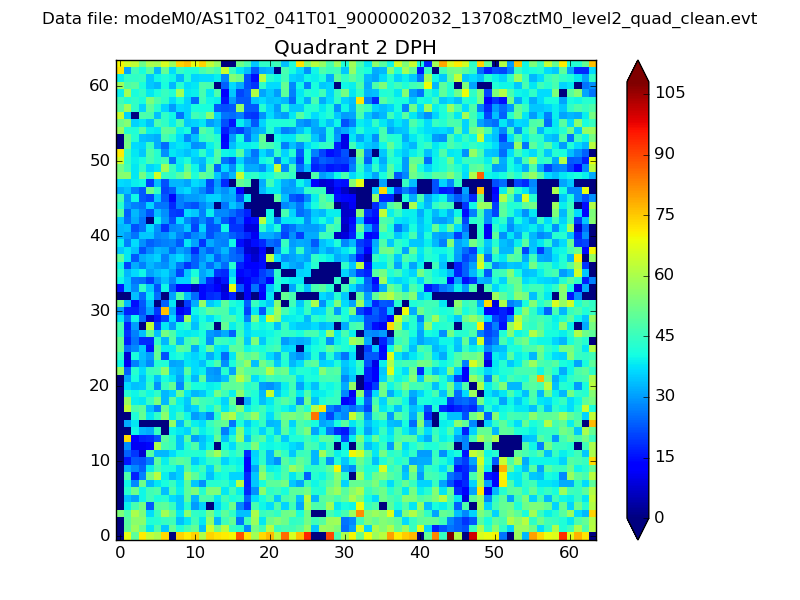
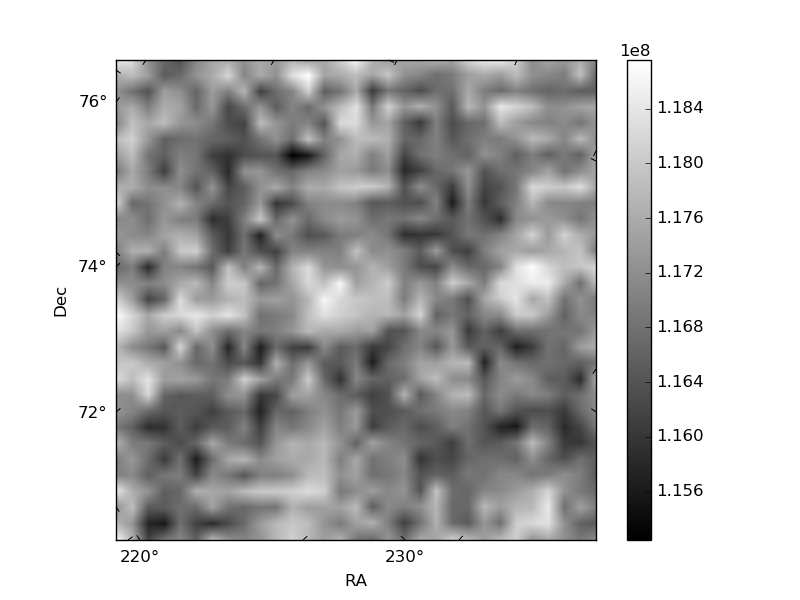
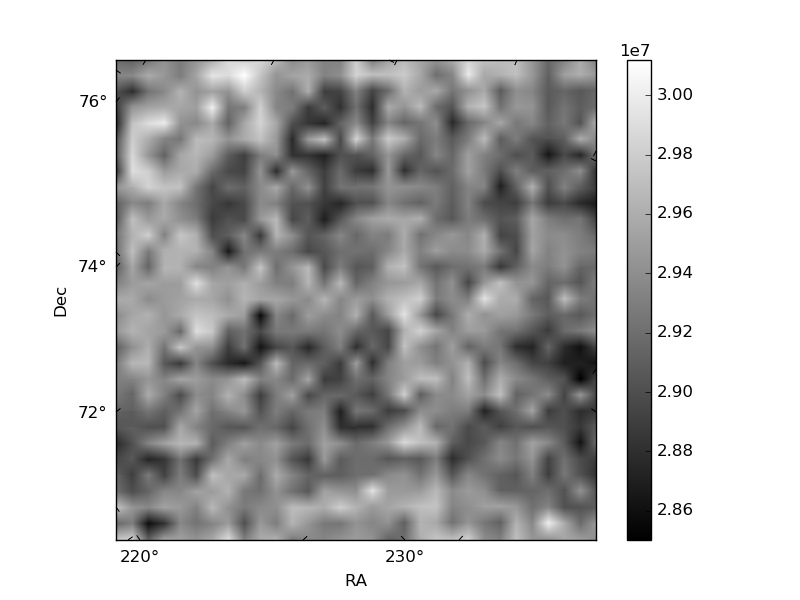
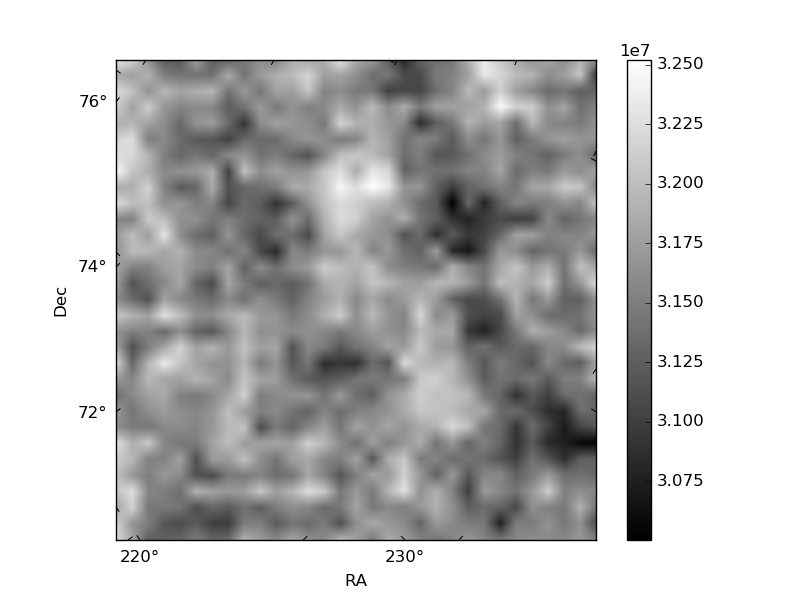
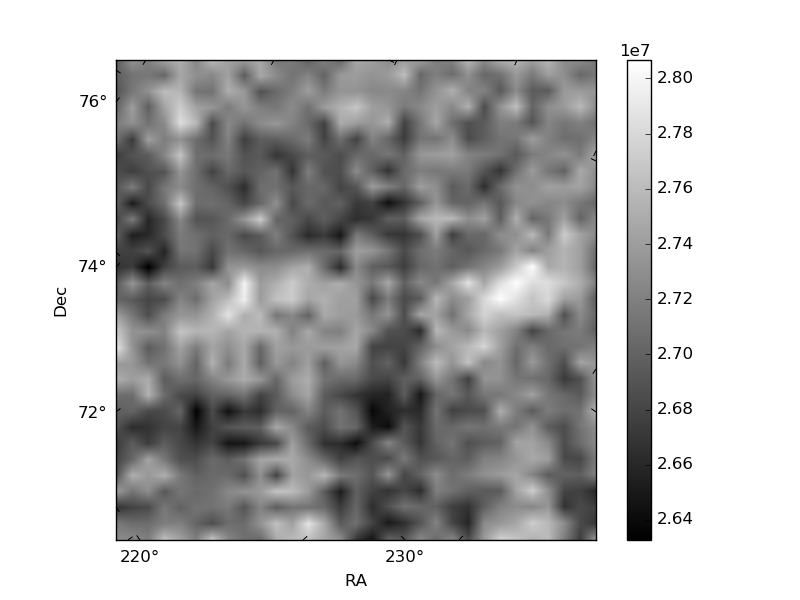
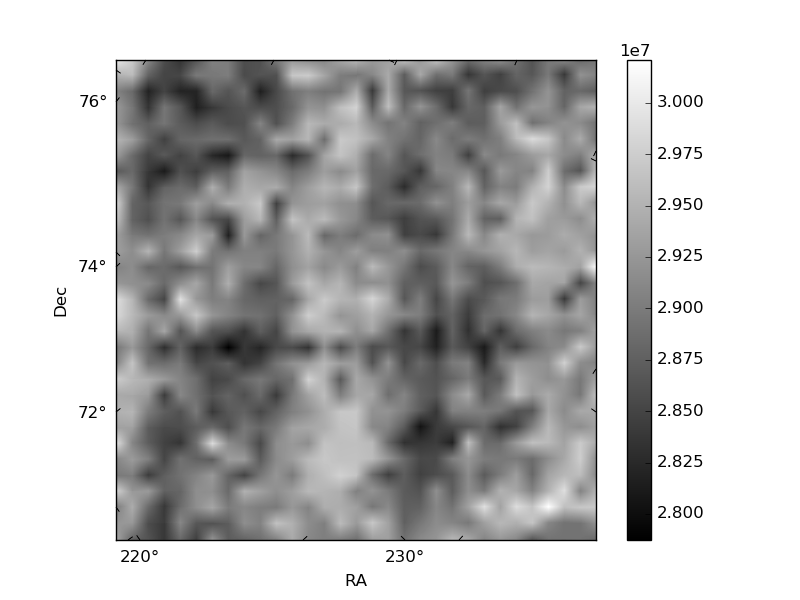
Histogram calculated using DETX and DETY for each event in the final _common_clean file
| Quadrant A | 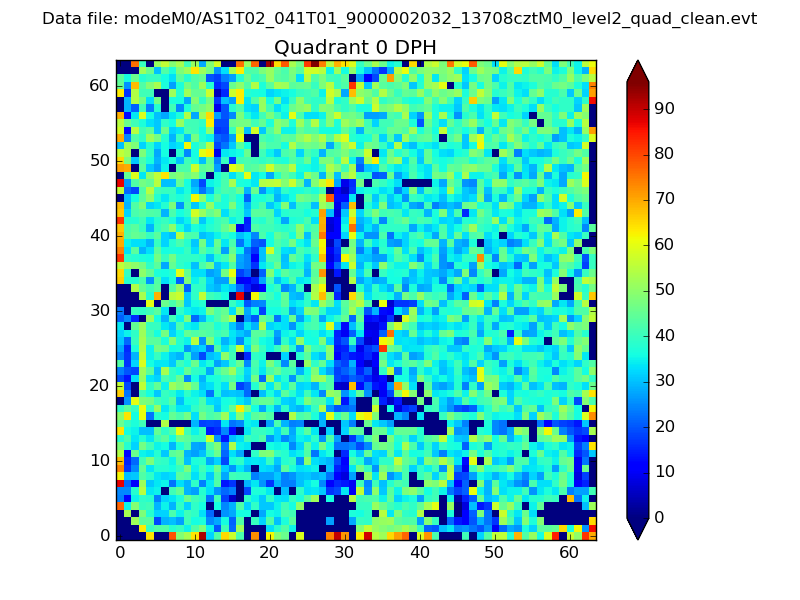 |
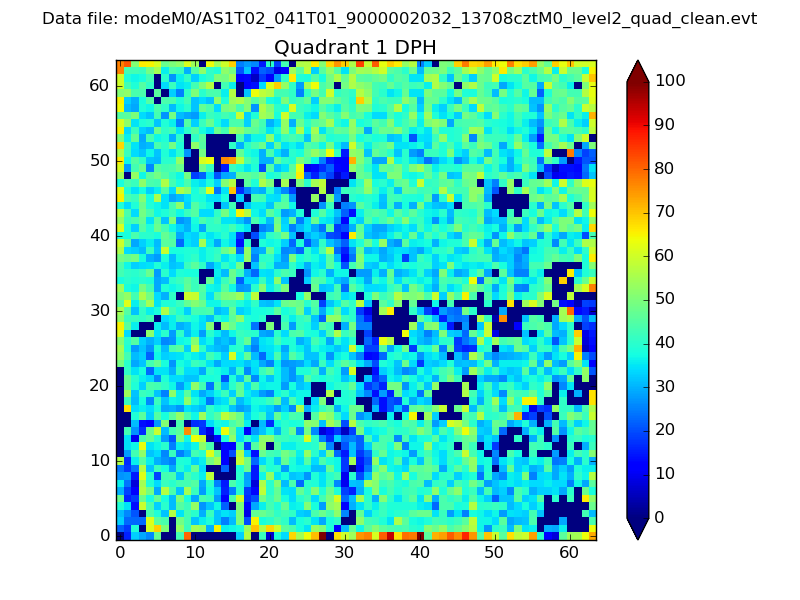 |
Quadrant B |
|---|---|---|---|
| Quadrant D | 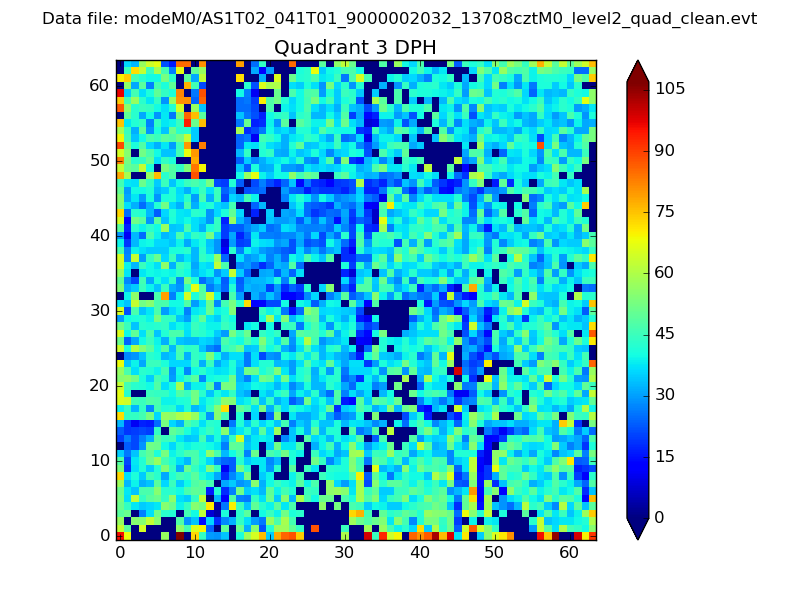 |
 |
Quadrant C |
| Plot type | Count rate plots | Images |
|---|---|---|
| Comparison with Poisson distribution Blue bars denote a histogram of data divided into 1 sec bins. Red curve is a Poisson curve with rate = median count rate of data. |
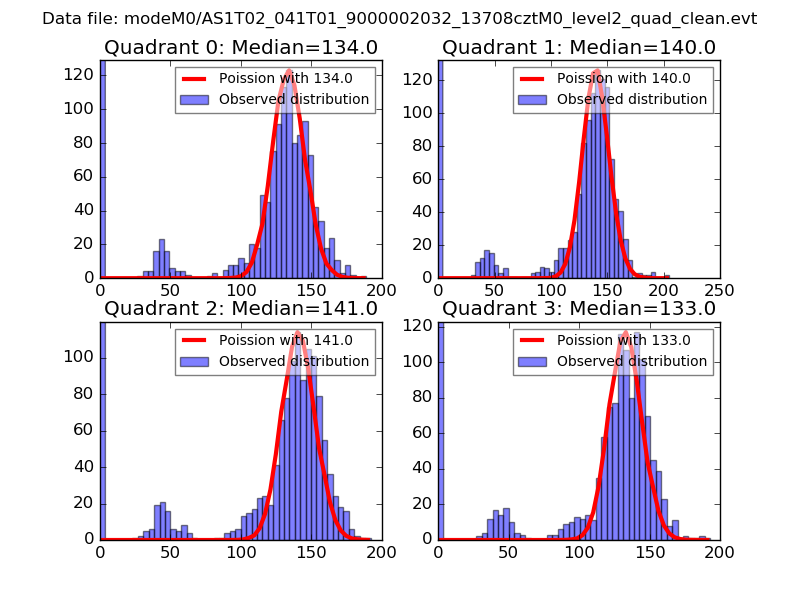 |
 |
| Quadrant-wise count rates Data is divided into 100 sec bins |
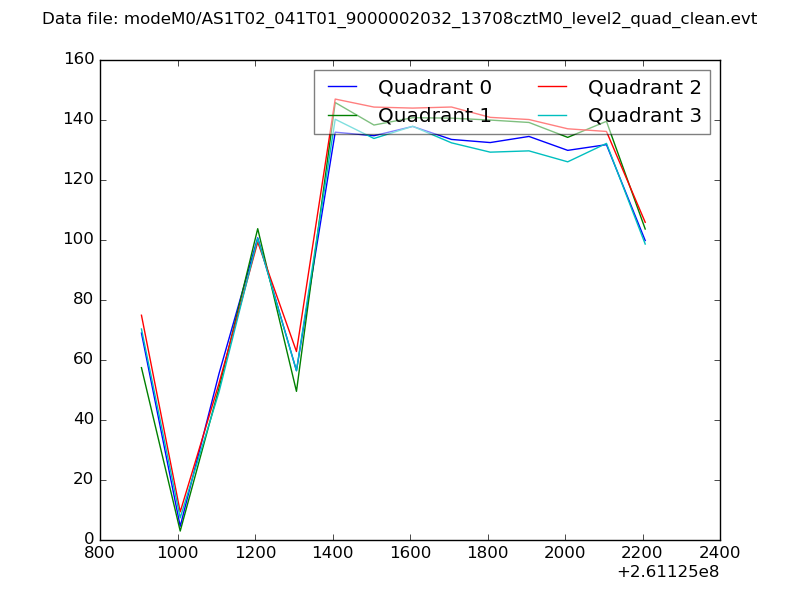 |
|
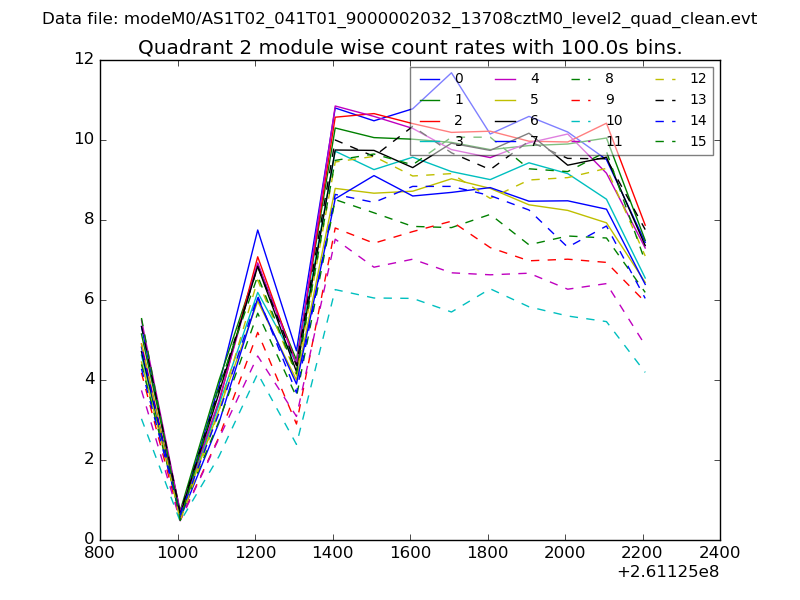
| Module-wise count rates for Quadrant A Data is divided into 100 sec bins |
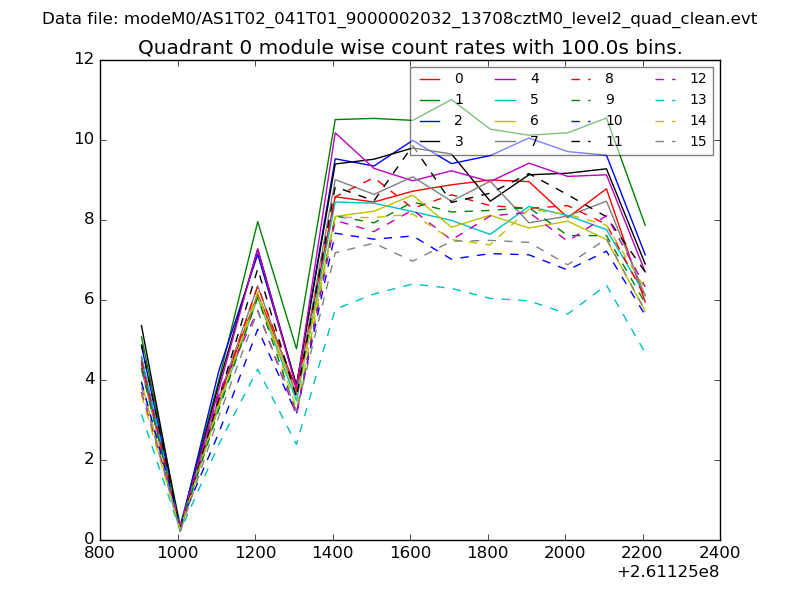 |
 |
| Module-wise count rates for Quadrant B Data is divided into 100 sec bins |
 |
 |
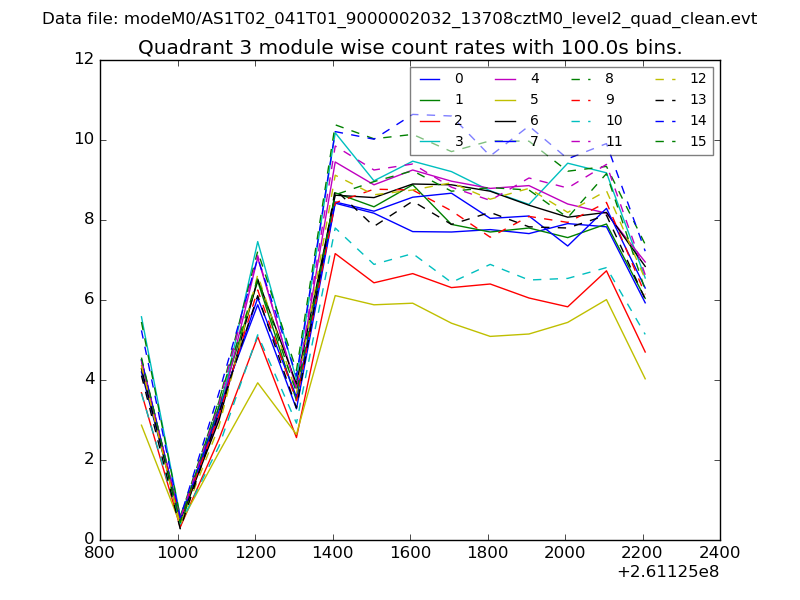
| Module-wise count rates for Quadrant C Data is divided into 100 sec bins |
 |
 |
| Module-wise count rates for Quadrant D Data is divided into 100 sec bins |
 |
 |
| Parameter | Plot |
|---|---|
| CZT HV Monitor | 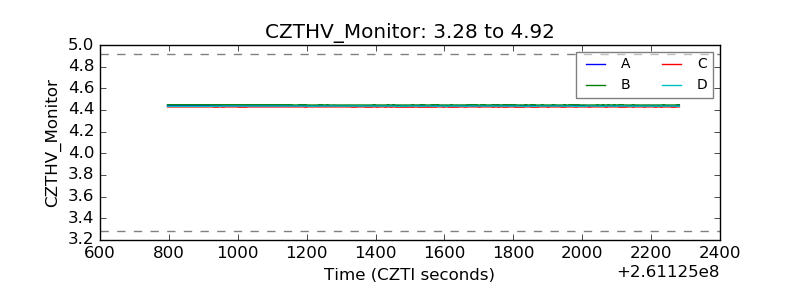 |
| D_VDD | 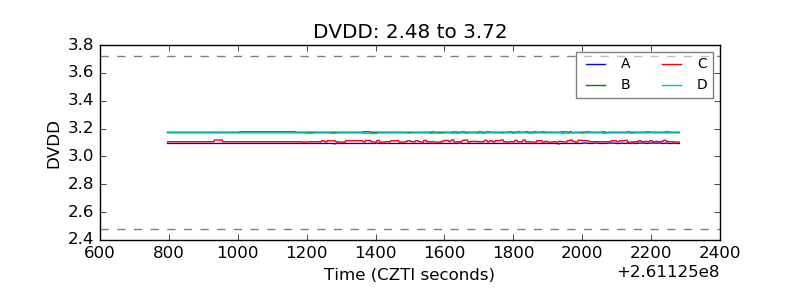 |
| Temperature 1 |  |
| Veto HV Monitor |  |
| Veto LLD | 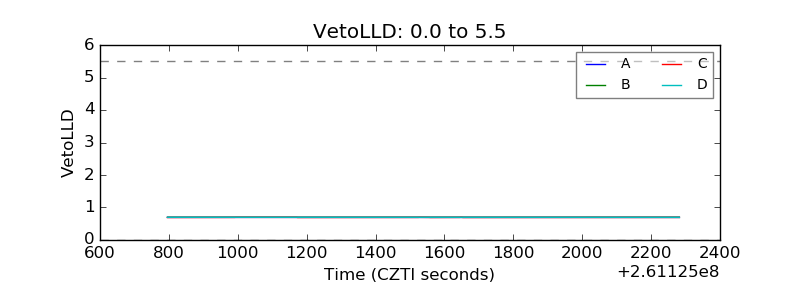 |
| Alpha Counter | 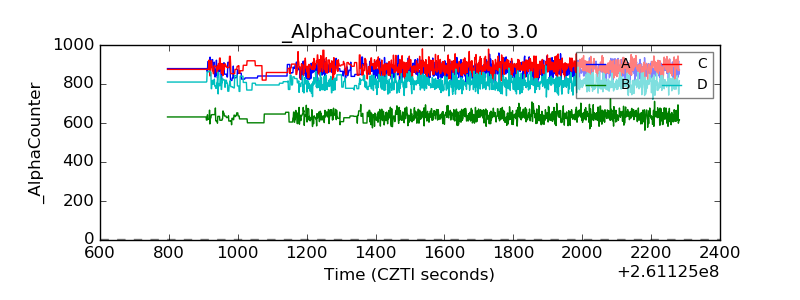 |
| _CPM_Rate | 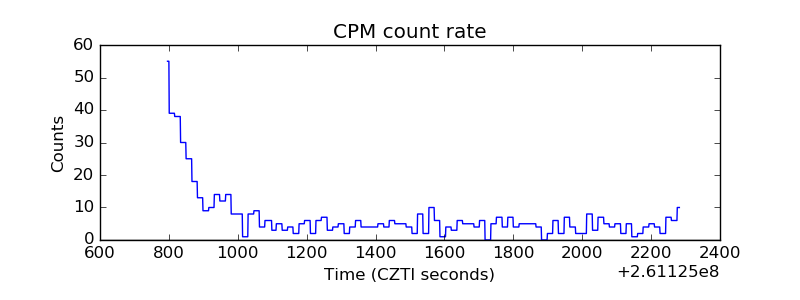 |
| CZT Counter | 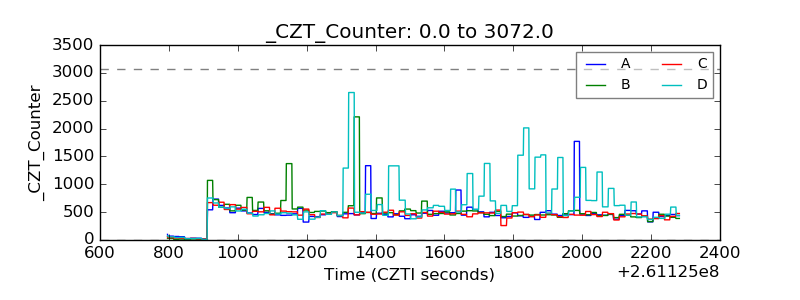 |
| +2.5 Volts monitor |  |
| +5 Volts monitor |  |
| _ROLL_ROT | 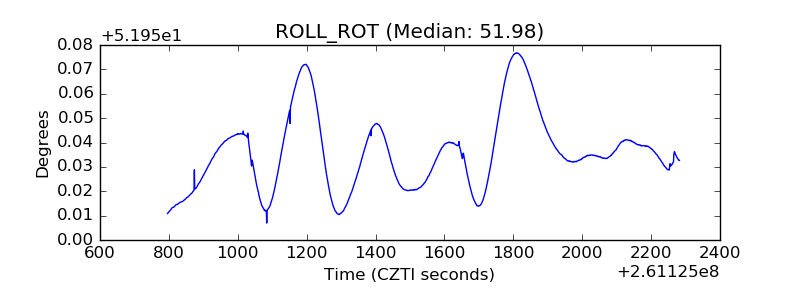 |
| _Roll_DEC |  |
| _Roll_RA | 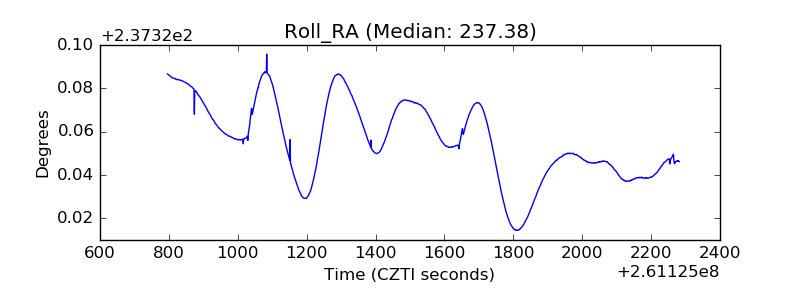 |
| Veto Counter | 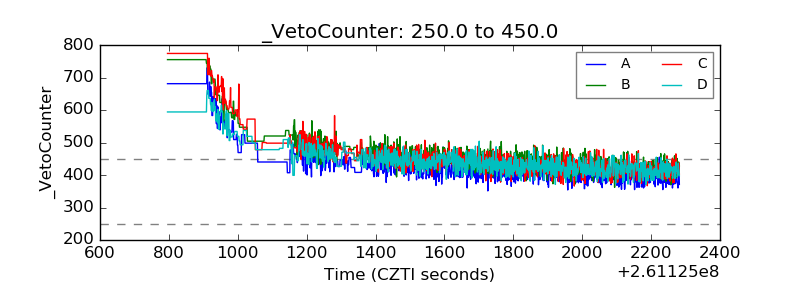 |