| Param | Original file | Final file |
|---|---|---|
| Filename | modeM0/AS1T02_041T01_9000002032_13710cztM0_level2.evt | modeM0/AS1T02_041T01_9000002032_13710cztM0_level2_quad_clean.evt |
| Size (bytes) | 453,078,720 | 131,169,600 |
| Size | 432.1 MB | 125.1 MB |
| Events in quadrant A | 3,248,564 | 863,937 |
| Events in quadrant B | 3,415,110 | 886,295 |
| Events in quadrant C | 3,183,454 | 890,773 |
| Events in quadrant D | 3,406,487 | 852,506 |
| Mode M0 | |||
|---|---|---|---|
| Quadrant | BADHDUFLAG | Total packets | Discarded packets |
| A | 0 | 14064 | 2 |
| B | 0 | 14639 | 1 |
| C | 0 | 14045 | 1 |
| D | 0 | 14885 | 1 |
| Mode SS | |||
|---|---|---|---|
| Quadrant | BADHDUFLAG | Total packets | Discarded packets |
| A | 0 | 140 | 0 |
| B | 0 | 140 | 0 |
| C | 0 | 140 | 0 |
| D | 0 | 140 | 0 |
| Mode M9 | |||
|---|---|---|---|
| Quadrant | BADHDUFLAG | Total packets | Discarded packets |
| A | 0 | 6 | 0 |
| B | 0 | 6 | 0 |
| C | 0 | 6 | 0 |
| D | 0 | 6 | 0 |
| Quadrant | Total seconds | Saturated seconds | Saturation percentage |
|---|---|---|---|
| A | 6878 | 135 | 1.962780% |
| B | 6878 | 158 | 2.297179% |
| C | 6878 | 69 | 1.003199% |
| D | 6878 | 105 | 1.526607% |
Noise dominated data is calculated using 1-second bins in cleaned event files. If a bin has >2000 counts, and if more than 50% of those come from <1% of pixels, then it is considered to be noise-dominated and hence unusable.
| Quadrant | # 1 sec bins | Bins with >0 counts | Bins with >2000 counts | High rate bins dominated by noise | Noise dominated (total time) | Noise dominated (detector-on time) | Marked lightcurve |
|---|---|---|---|---|---|---|---|
| A | 7439 | 6880 | 0 | 0 | 0.00% | 0.00% | 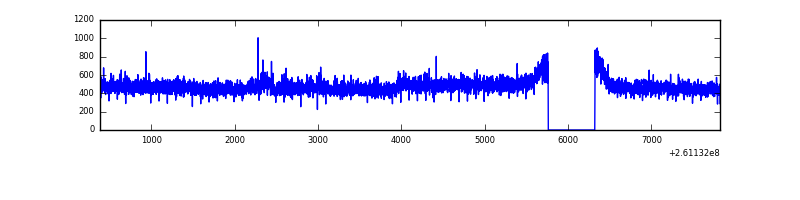 |
| B | 7439 | 6880 | 24 | 24 | 0.32% | 0.35% | 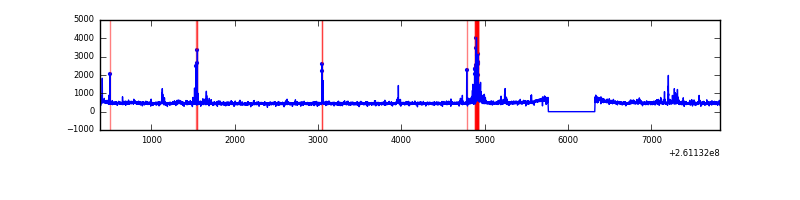 |
| C | 7439 | 6880 | 0 | 0 | 0.00% | 0.00% | 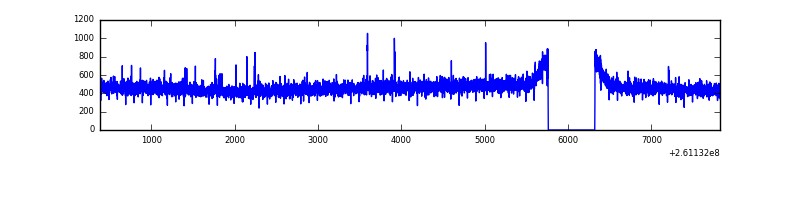 |
| D | 7439 | 6880 | 22 | 22 | 0.30% | 0.32% |  |
Top three noisy pixels from each quadrant. If the there are fewer than three noisy pixels in the level2.evt file, extra rows are filled as -1
| Pixel properties | Quadrant properties | ||||||
|---|---|---|---|---|---|---|---|
| Quadrant | DetID | PixID | Counts | Sigma | Mean | Median | Sigma |
| A | 15 | 222 | 129799 | 801.55 | 802 | 785 | 161.0 |
| A | 1 | 162 | 22279 | 133.54 | 802 | 785 | 161.0 |
| A | 1 | 178 | 7191 | 39.8 | 802 | 785 | 161.0 |
| B | 8 | 250 | 129342 | 848.28 | 802 | 782 | 151.6 |
| B | 0 | 214 | 55469 | 360.84 | 802 | 782 | 151.6 |
| B | 0 | 219 | 33750 | 217.53 | 802 | 782 | 151.6 |
| C | 3 | 233 | 107326 | 601.16 | 783 | 786 | 177.2 |
| C | 14 | 220 | 16872 | 90.77 | 783 | 786 | 177.2 |
| C | 13 | 61 | 5793 | 28.25 | 783 | 786 | 177.2 |
| D | 2 | 136 | 171495 | 840.14 | 775 | 760 | 203.2 |
| D | 5 | 222 | 115400 | 564.11 | 775 | 760 | 203.2 |
| D | 13 | 122 | 79472 | 387.32 | 775 | 760 | 203.2 |
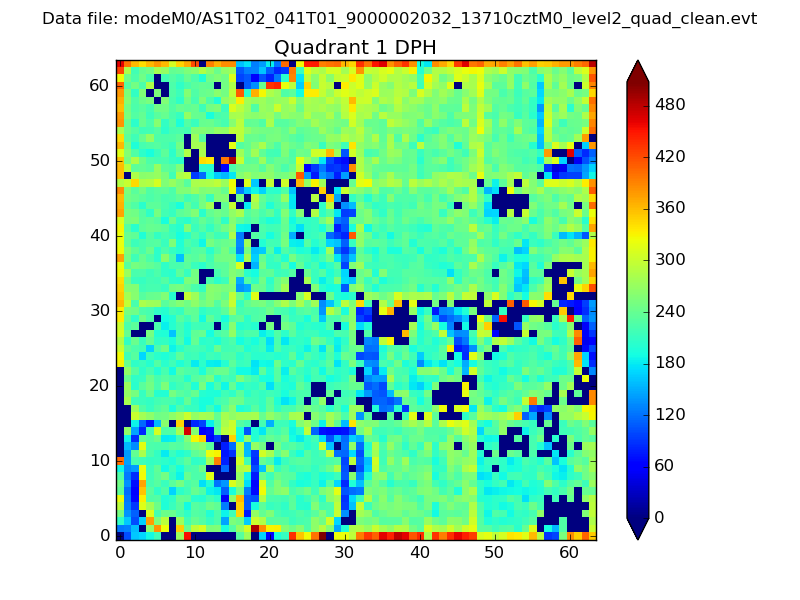
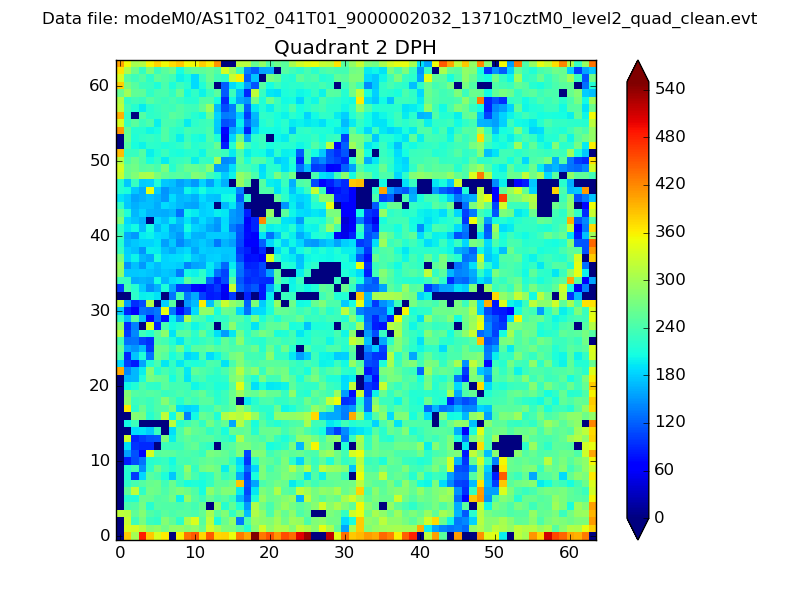
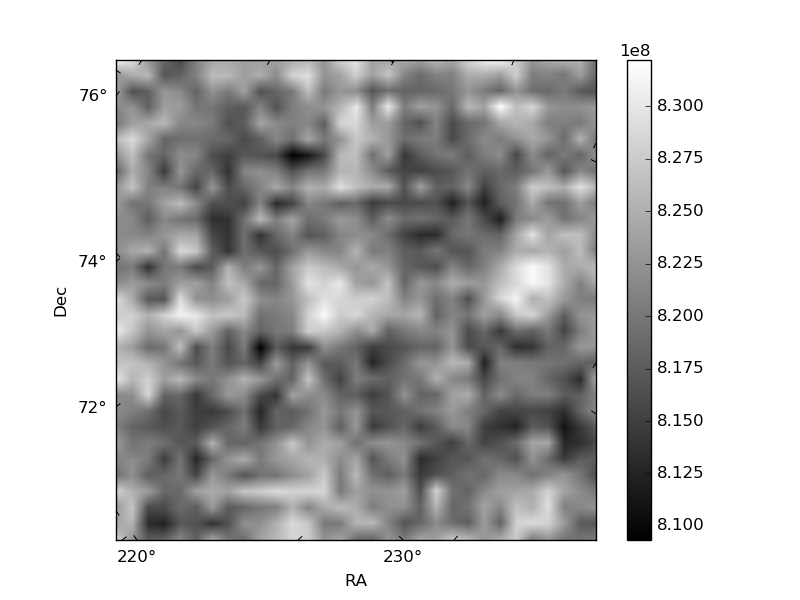
Histogram calculated using DETX and DETY for each event in the final _common_clean file
| Quadrant A | 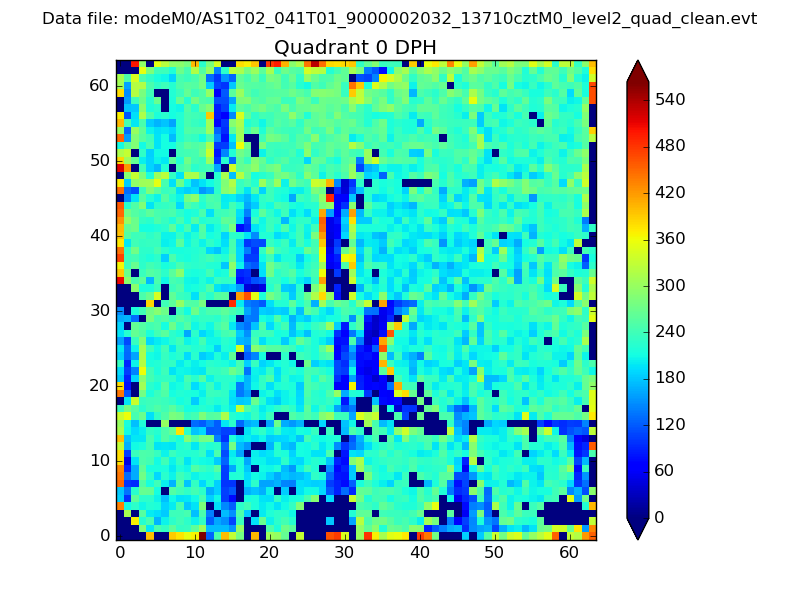 |
 |
Quadrant B |
|---|---|---|---|
| Quadrant D | 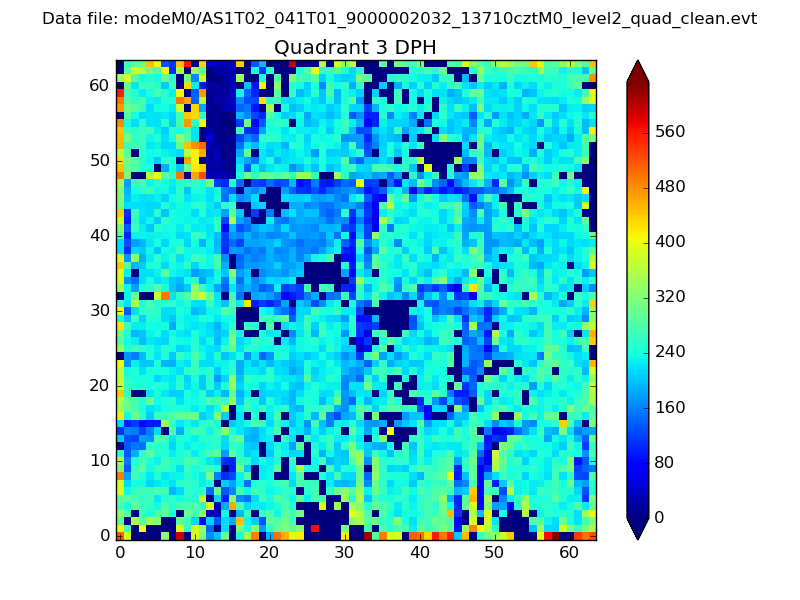 |
 |
Quadrant C |
| Plot type | Count rate plots | Images |
|---|---|---|
| Comparison with Poisson distribution Blue bars denote a histogram of data divided into 1 sec bins. Red curve is a Poisson curve with rate = median count rate of data. |
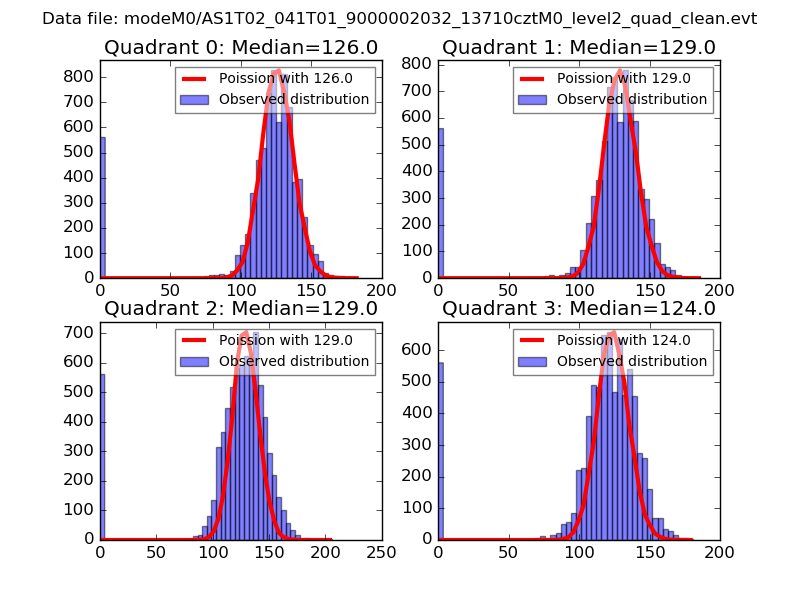 |
 |
| Quadrant-wise count rates Data is divided into 100 sec bins |
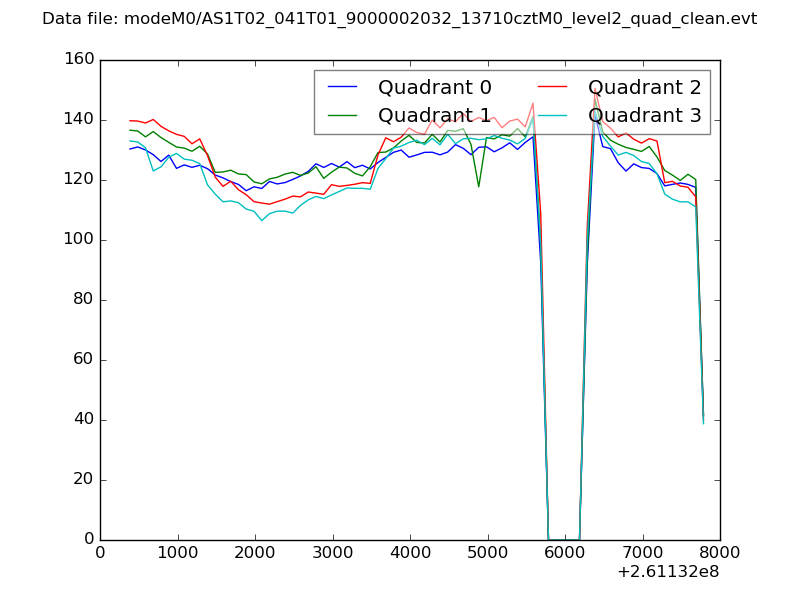 |
|
| Module-wise count rates for Quadrant A Data is divided into 100 sec bins |
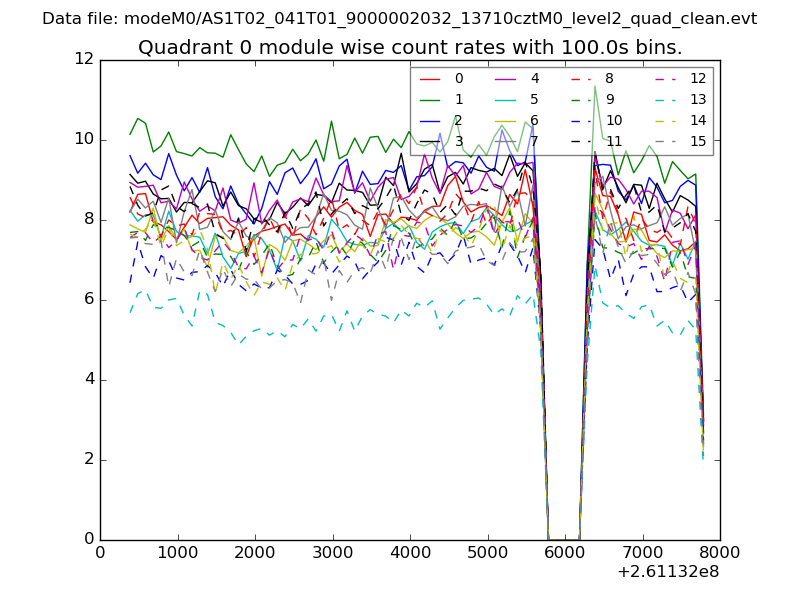 |
 |
| Module-wise count rates for Quadrant B Data is divided into 100 sec bins |
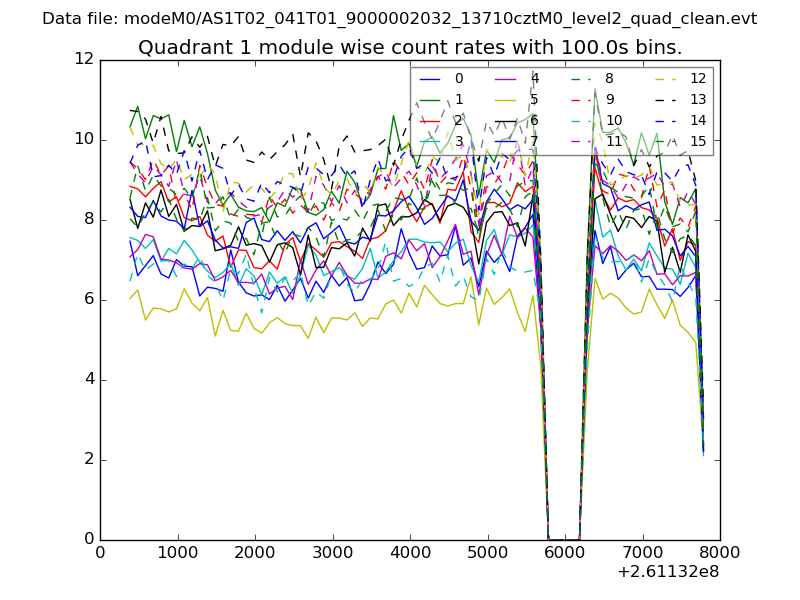 |
 |
| Module-wise count rates for Quadrant C Data is divided into 100 sec bins |
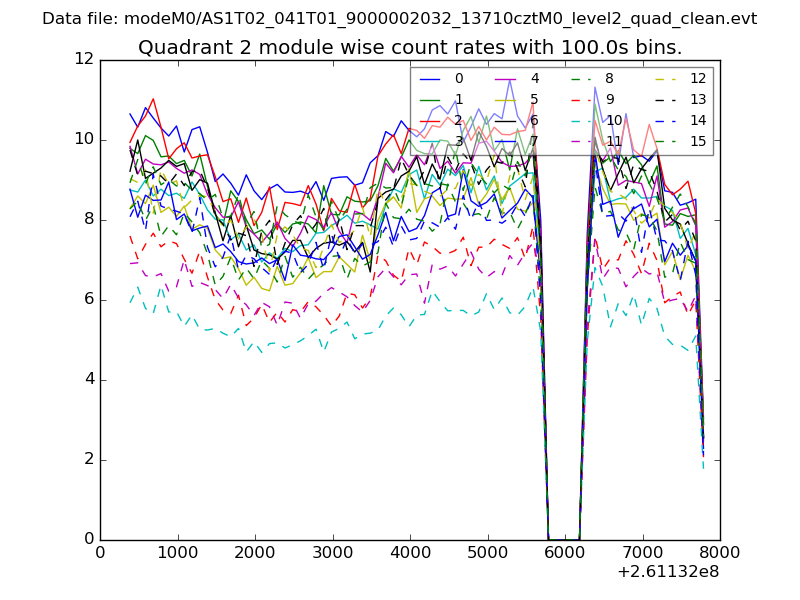 |
 |
| Module-wise count rates for Quadrant D Data is divided into 100 sec bins |
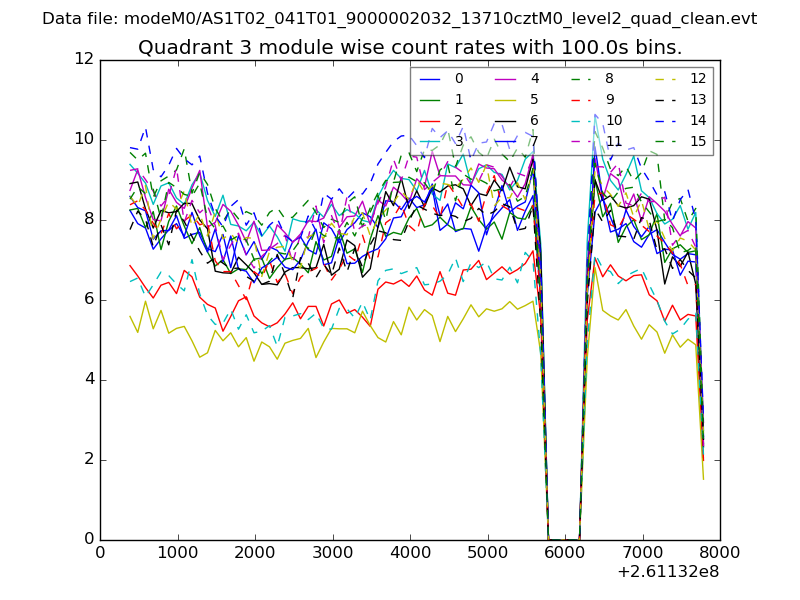 |
 |
| Parameter | Plot |
|---|---|
| CZT HV Monitor | 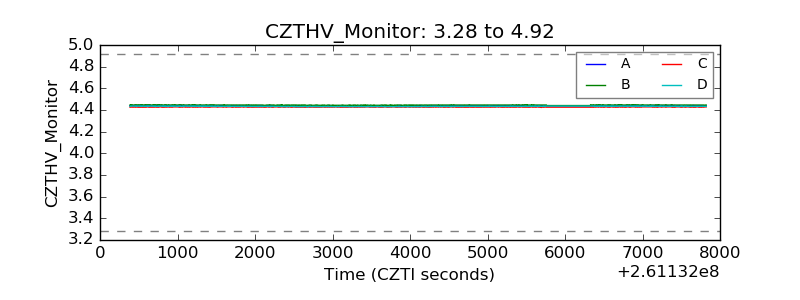 |
| D_VDD | 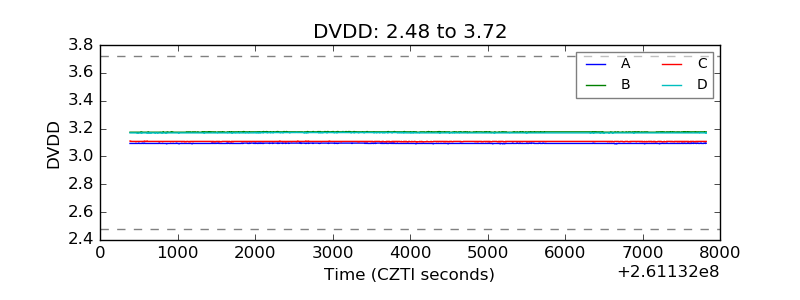 |
| Temperature 1 | 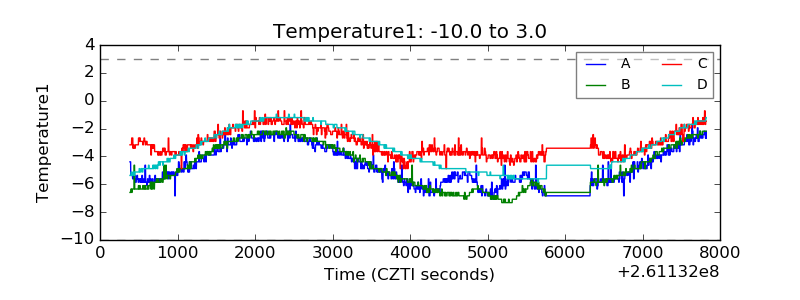 |
| Veto HV Monitor | 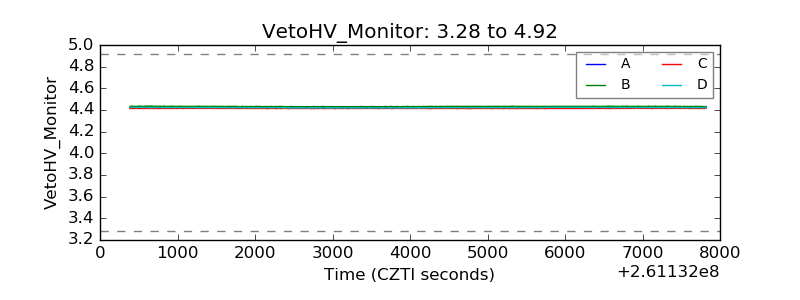 |
| Veto LLD | 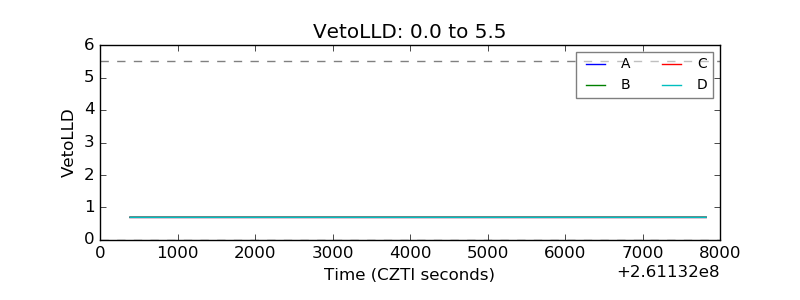 |
| Alpha Counter | 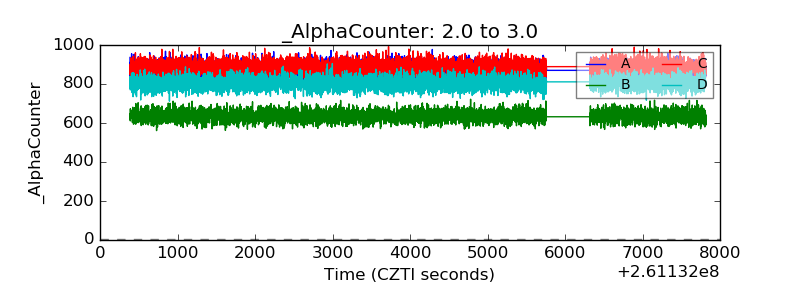 |
| _CPM_Rate | 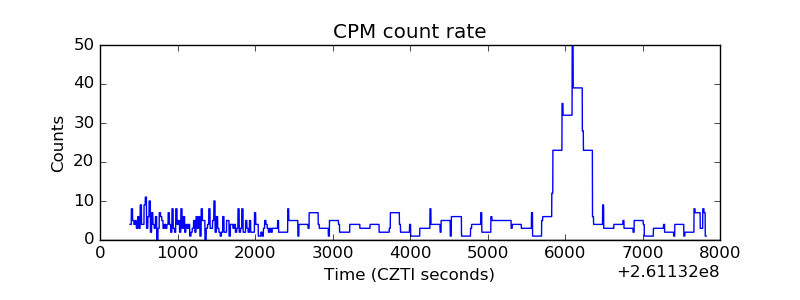 |
| CZT Counter | 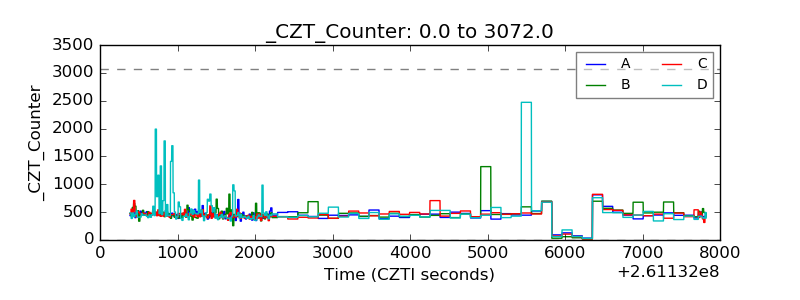 |
| +2.5 Volts monitor |  |
| +5 Volts monitor | 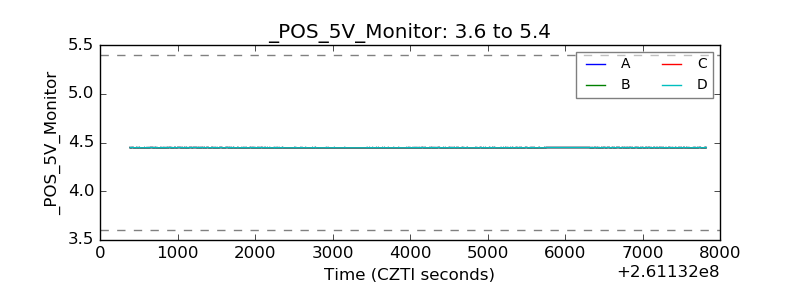 |
| _ROLL_ROT | 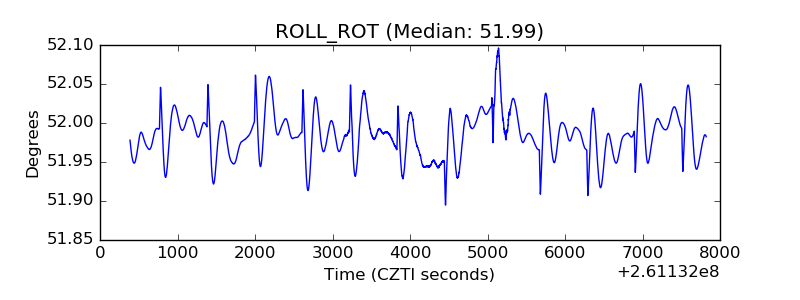 |
| _Roll_DEC | 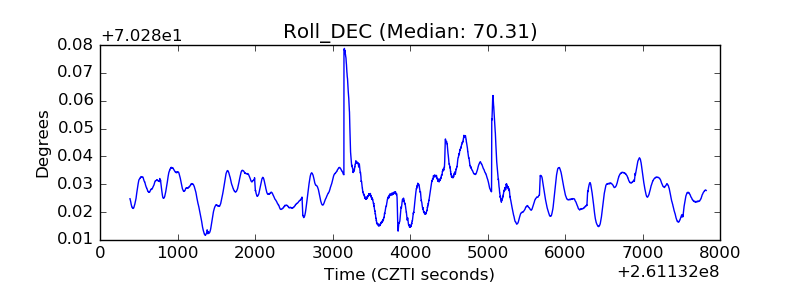 |
| _Roll_RA | 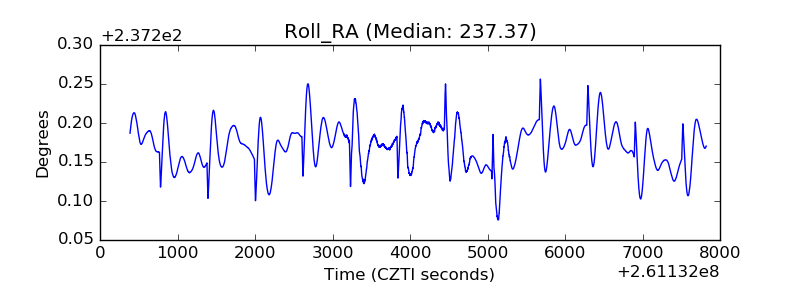 |
| Veto Counter | 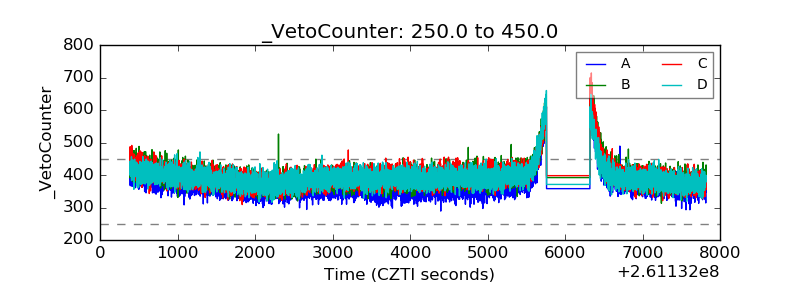 |