| Param | Original file | Final file |
|---|---|---|
| Filename | modeM0/AS1T02_041T01_9000002032_13711cztM0_level2.evt | modeM0/AS1T02_041T01_9000002032_13711cztM0_level2_quad_clean.evt |
| Size (bytes) | 495,806,400 | 142,007,040 |
| Size | 472.8 MB | 135.4 MB |
| Events in quadrant A | 3,425,462 | 938,330 |
| Events in quadrant B | 3,680,593 | 961,135 |
| Events in quadrant C | 3,619,503 | 954,819 |
| Events in quadrant D | 3,776,478 | 921,395 |
| Mode M0 | |||
|---|---|---|---|
| Quadrant | BADHDUFLAG | Total packets | Discarded packets |
| A | 0 | 15465 | 2 |
| B | 0 | 15910 | 1 |
| C | 0 | 15808 | 1 |
| D | 0 | 16420 | 1 |
| Mode SS | |||
|---|---|---|---|
| Quadrant | BADHDUFLAG | Total packets | Discarded packets |
| A | 0 | 152 | 0 |
| B | 0 | 152 | 0 |
| C | 0 | 152 | 0 |
| D | 0 | 152 | 0 |
| Mode M9 | |||
|---|---|---|---|
| Quadrant | BADHDUFLAG | Total packets | Discarded packets |
| A | 0 | 2 | 0 |
| B | 0 | 2 | 0 |
| C | 0 | 2 | 0 |
| D | 0 | 2 | 0 |
| Quadrant | Total seconds | Saturated seconds | Saturation percentage |
|---|---|---|---|
| A | 7562 | 150 | 1.983602% |
| B | 7562 | 208 | 2.750595% |
| C | 7562 | 168 | 2.221634% |
| D | 7562 | 134 | 1.772018% |
Noise dominated data is calculated using 1-second bins in cleaned event files. If a bin has >2000 counts, and if more than 50% of those come from <1% of pixels, then it is considered to be noise-dominated and hence unusable.
| Quadrant | # 1 sec bins | Bins with >0 counts | Bins with >2000 counts | High rate bins dominated by noise | Noise dominated (total time) | Noise dominated (detector-on time) | Marked lightcurve |
|---|---|---|---|---|---|---|---|
| A | 7638 | 7565 | 0 | 0 | 0.00% | 0.00% | 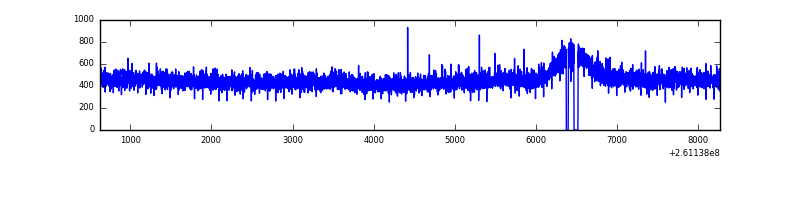 |
| B | 7638 | 7565 | 20 | 20 | 0.26% | 0.26% | 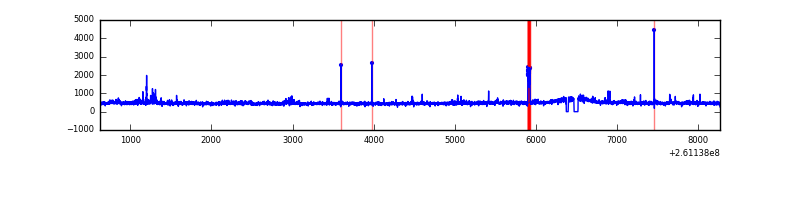 |
| C | 7638 | 7565 | 21 | 21 | 0.27% | 0.28% | 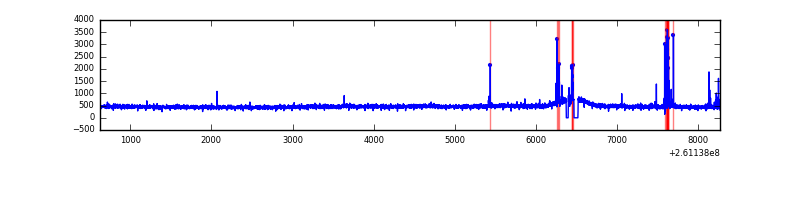 |
| D | 7638 | 7565 | 7 | 7 | 0.09% | 0.09% | 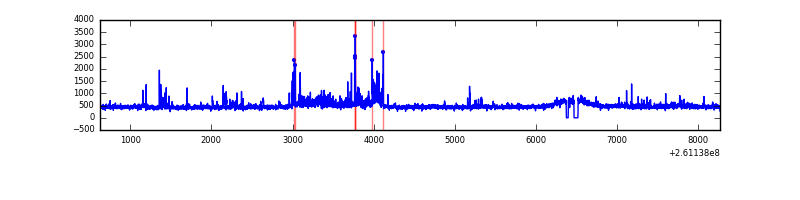 |
Top three noisy pixels from each quadrant. If the there are fewer than three noisy pixels in the level2.evt file, extra rows are filled as -1
| Pixel properties | Quadrant properties | ||||||
|---|---|---|---|---|---|---|---|
| Quadrant | DetID | PixID | Counts | Sigma | Mean | Median | Sigma |
| A | 1 | 162 | 13741 | 71.27 | 886 | 864 | 180.7 |
| A | 0 | 226 | 7816 | 38.48 | 886 | 864 | 180.7 |
| A | 12 | 194 | 6750 | 32.58 | 886 | 864 | 180.7 |
| B | 8 | 250 | 54063 | 318.05 | 887 | 863 | 167.3 |
| B | 3 | 64 | 48531 | 284.97 | 887 | 863 | 167.3 |
| B | 0 | 214 | 44733 | 262.27 | 887 | 863 | 167.3 |
| C | 3 | 233 | 131819 | 665.91 | 860 | 865 | 196.7 |
| C | 4 | 254 | 121490 | 613.39 | 860 | 865 | 196.7 |
| C | 12 | 4 | 6700 | 29.67 | 860 | 865 | 196.7 |
| D | 5 | 222 | 270574 | 1304.26 | 863 | 836 | 206.8 |
| D | 8 | 195 | 112056 | 537.78 | 863 | 836 | 206.8 |
| D | 13 | 249 | 88729 | 424.99 | 863 | 836 | 206.8 |
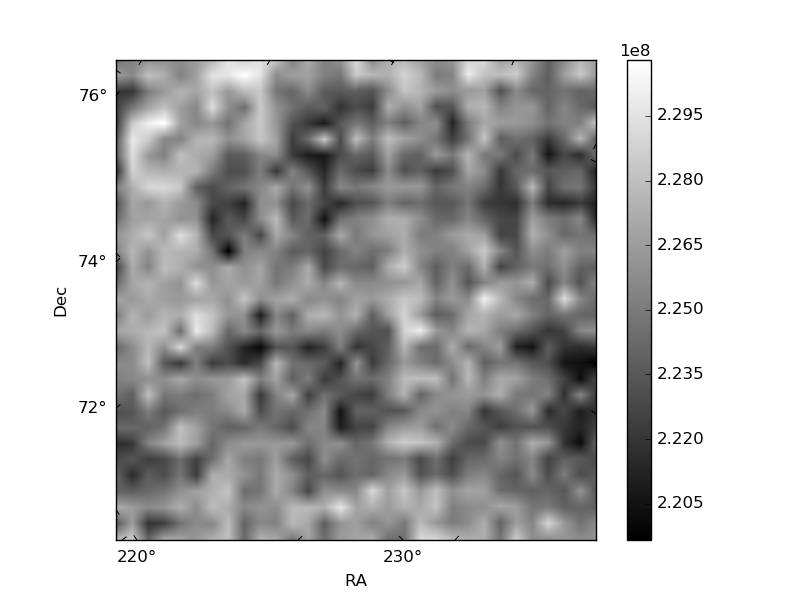
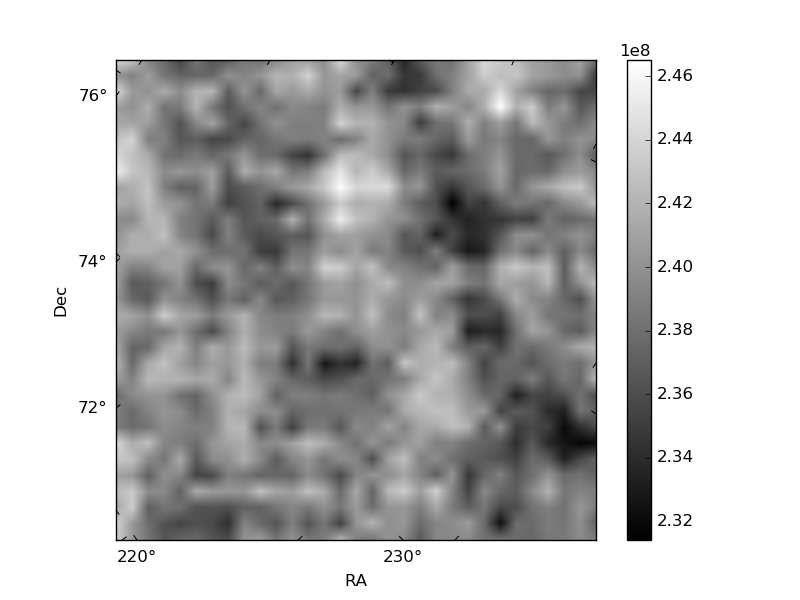
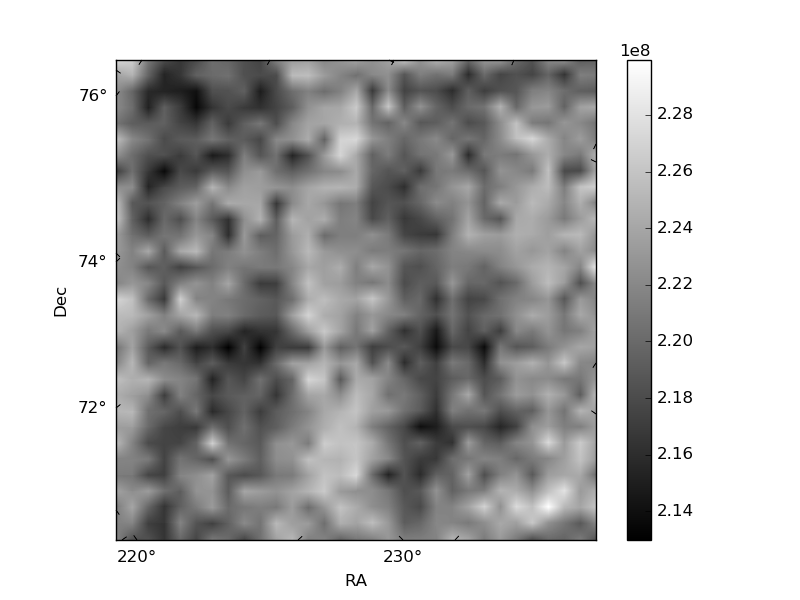
Histogram calculated using DETX and DETY for each event in the final _common_clean file
| Quadrant A | 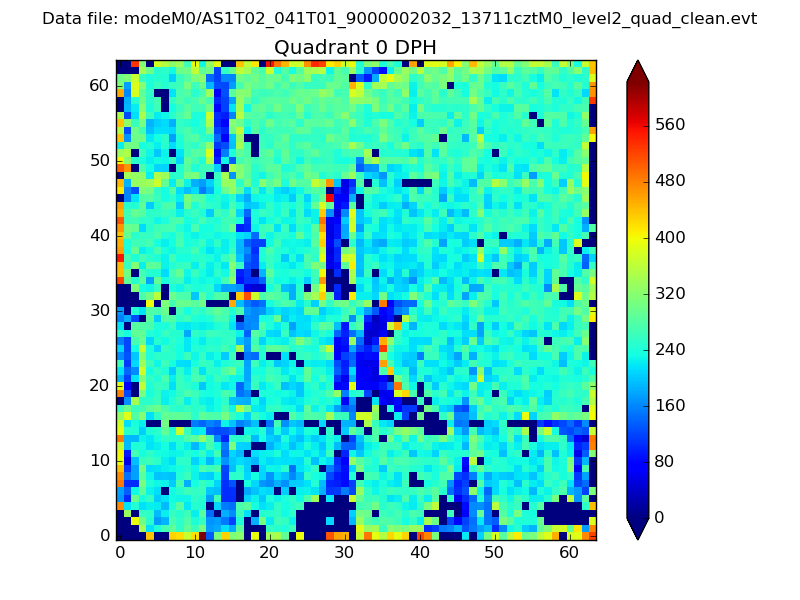 |
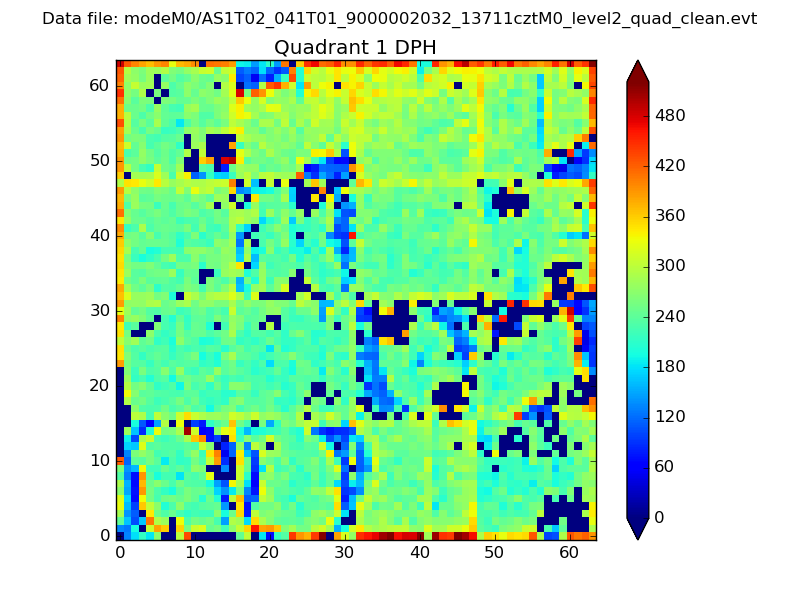 |
Quadrant B |
|---|---|---|---|
| Quadrant D | 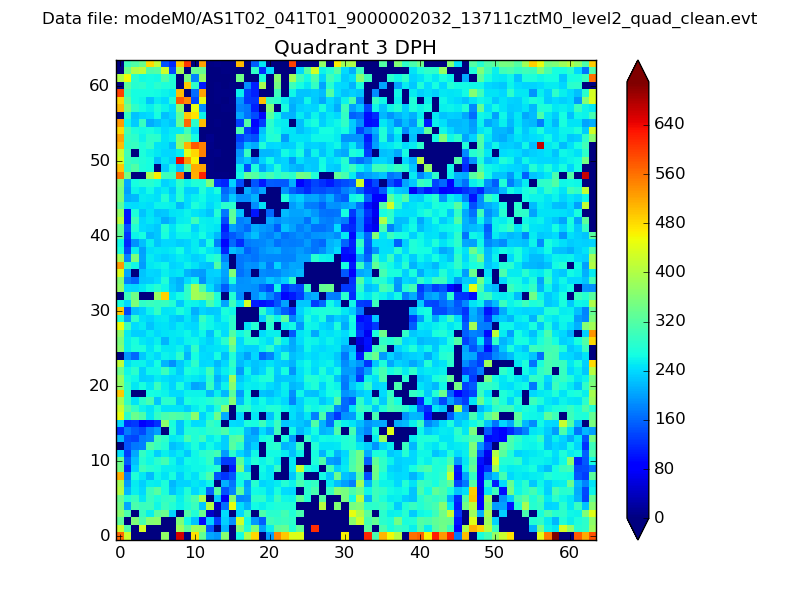 |
 |
Quadrant C |
| Plot type | Count rate plots | Images |
|---|---|---|
| Comparison with Poisson distribution Blue bars denote a histogram of data divided into 1 sec bins. Red curve is a Poisson curve with rate = median count rate of data. |
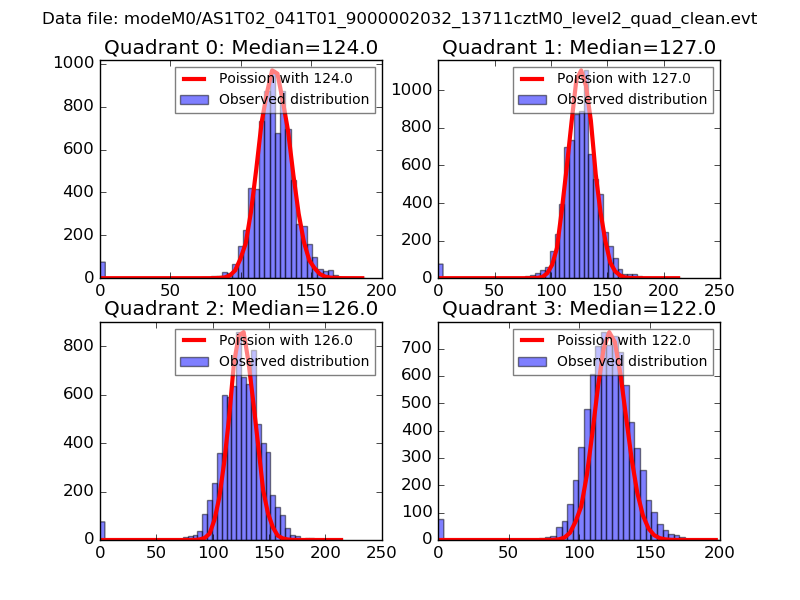 |
 |
| Quadrant-wise count rates Data is divided into 100 sec bins |
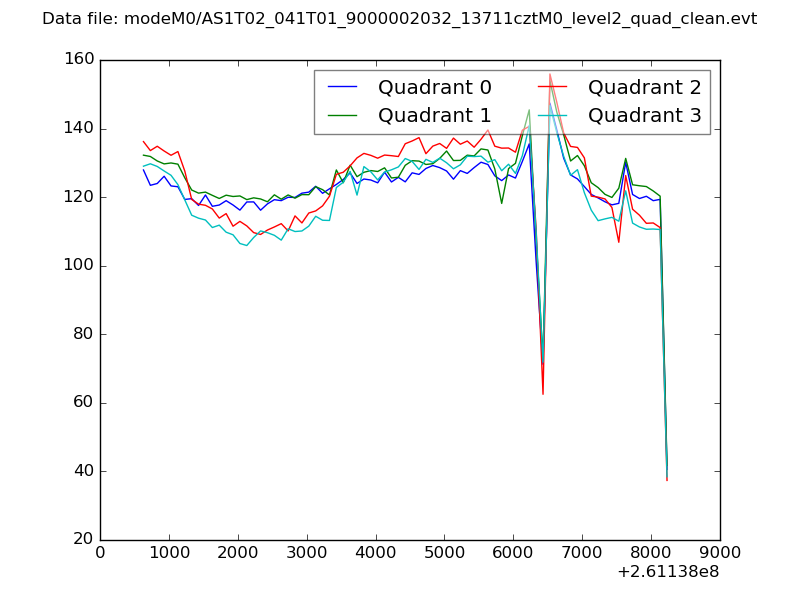 |
|
| Module-wise count rates for Quadrant A Data is divided into 100 sec bins |
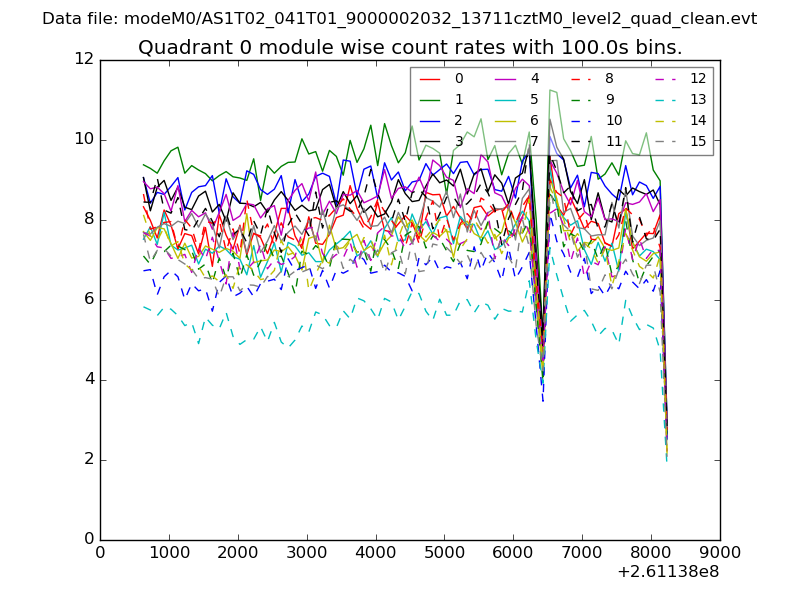 |
 |
| Module-wise count rates for Quadrant B Data is divided into 100 sec bins |
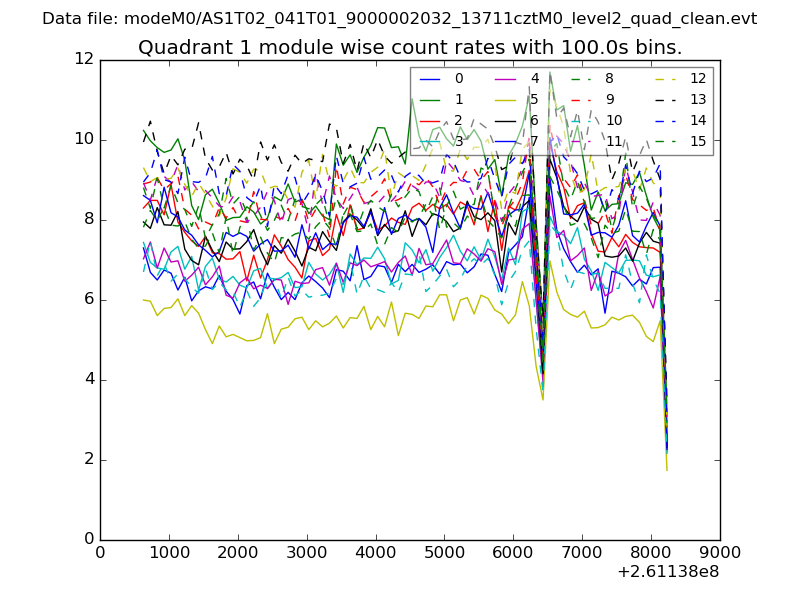 |
 |
| Module-wise count rates for Quadrant C Data is divided into 100 sec bins |
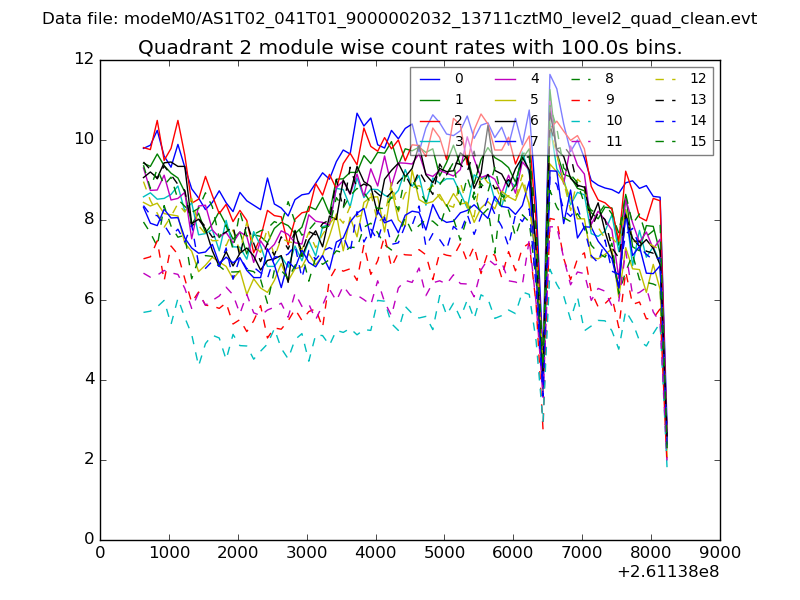 |
 |
| Module-wise count rates for Quadrant D Data is divided into 100 sec bins |
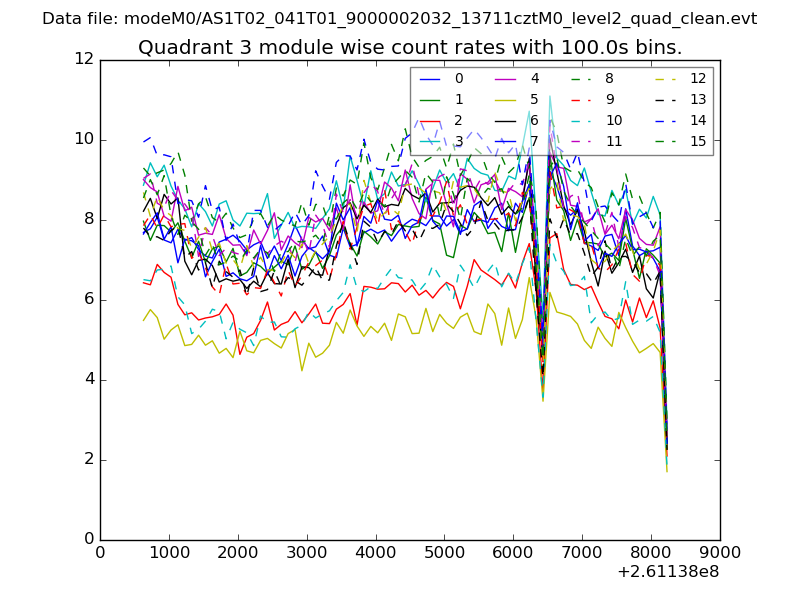 |
 |
| Parameter | Plot |
|---|---|
| CZT HV Monitor | 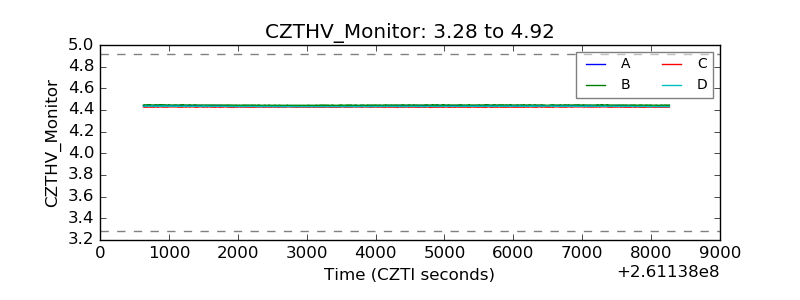 |
| D_VDD | 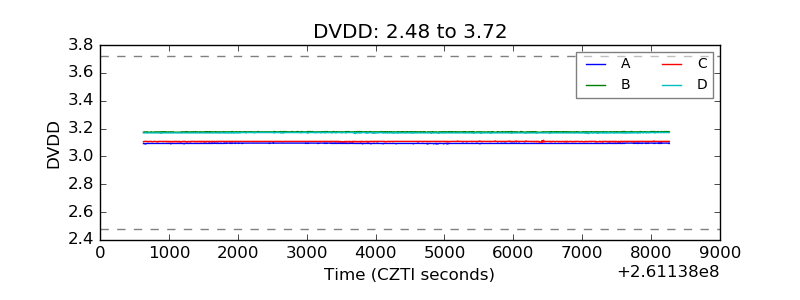 |
| Temperature 1 | 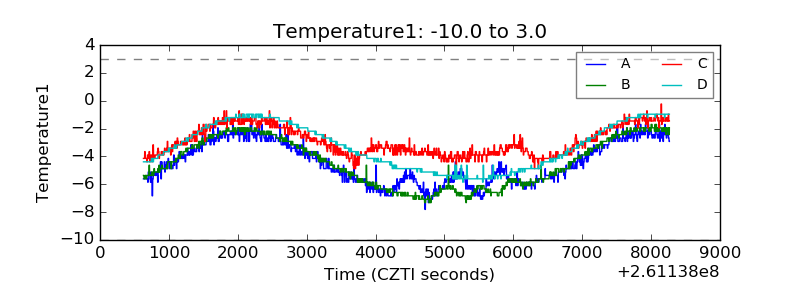 |
| Veto HV Monitor |  |
| Veto LLD | 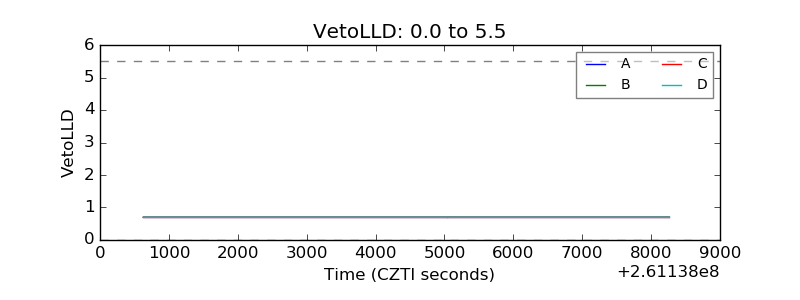 |
| Alpha Counter | 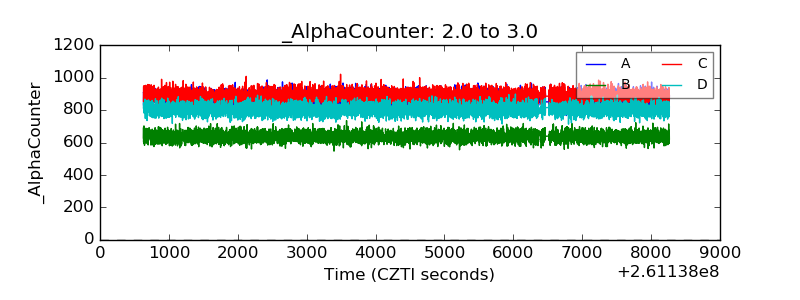 |
| _CPM_Rate | 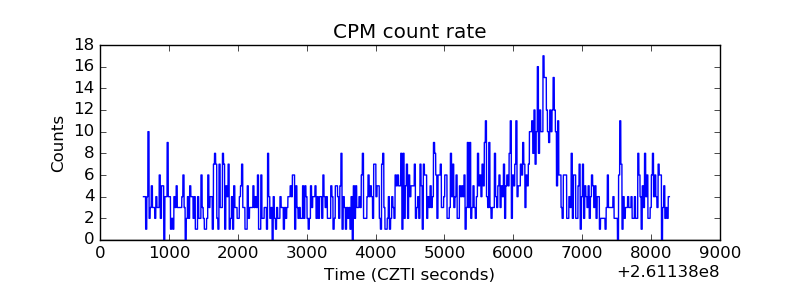 |
| CZT Counter |  |
| +2.5 Volts monitor |  |
| +5 Volts monitor | 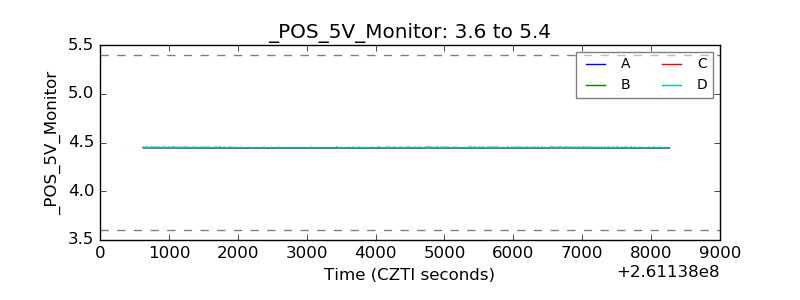 |
| _ROLL_ROT | 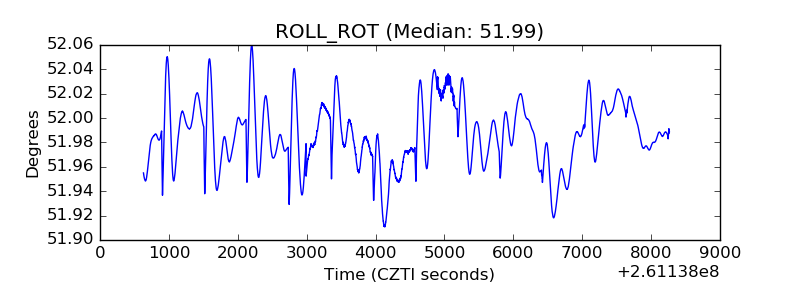 |
| _Roll_DEC | 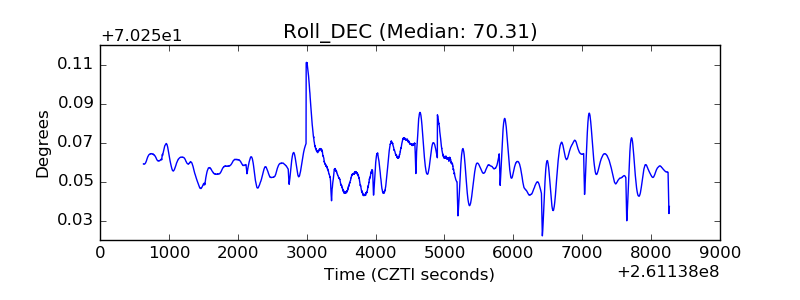 |
| _Roll_RA |  |
| Veto Counter | 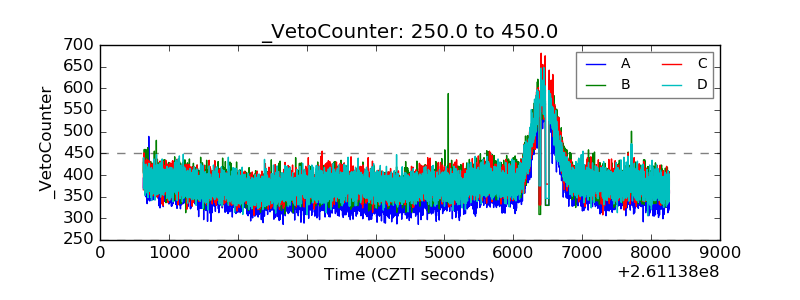 |