| Param | Original file | Final file |
|---|---|---|
| Filename | modeM0/AS1T02_041T01_9000002032_13712cztM0_level2.evt | modeM0/AS1T02_041T01_9000002032_13712cztM0_level2_quad_clean.evt |
| Size (bytes) | 507,562,560 | 141,776,640 |
| Size | 484.0 MB | 135.2 MB |
| Events in quadrant A | 3,474,316 | 935,439 |
| Events in quadrant B | 3,711,506 | 961,060 |
| Events in quadrant C | 3,782,375 | 950,736 |
| Events in quadrant D | 3,885,842 | 916,979 |
| Mode M0 | |||
|---|---|---|---|
| Quadrant | BADHDUFLAG | Total packets | Discarded packets |
| A | 0 | 15505 | 2 |
| B | 0 | 15948 | 1 |
| C | 0 | 16339 | 1 |
| D | 0 | 16592 | 1 |
| Mode SS | |||
|---|---|---|---|
| Quadrant | BADHDUFLAG | Total packets | Discarded packets |
| A | 0 | 156 | 0 |
| B | 0 | 156 | 0 |
| C | 0 | 156 | 0 |
| D | 0 | 156 | 0 |
| Mode M9 | |||
|---|---|---|---|
| Quadrant | BADHDUFLAG | Total packets | Discarded packets |
| A | 0 | 1 | 0 |
| B | 0 | 1 | 0 |
| C | 0 | 1 | 0 |
| D | 0 | 1 | 0 |
| Quadrant | Total seconds | Saturated seconds | Saturation percentage |
|---|---|---|---|
| A | 7615 | 61 | 0.801051% |
| B | 7615 | 96 | 1.260670% |
| C | 7615 | 130 | 1.707157% |
| D | 7615 | 84 | 1.103086% |
Noise dominated data is calculated using 1-second bins in cleaned event files. If a bin has >2000 counts, and if more than 50% of those come from <1% of pixels, then it is considered to be noise-dominated and hence unusable.
| Quadrant | # 1 sec bins | Bins with >0 counts | Bins with >2000 counts | High rate bins dominated by noise | Noise dominated (total time) | Noise dominated (detector-on time) | Marked lightcurve |
|---|---|---|---|---|---|---|---|
| A | 7746 | 7617 | 0 | 0 | 0.00% | 0.00% | 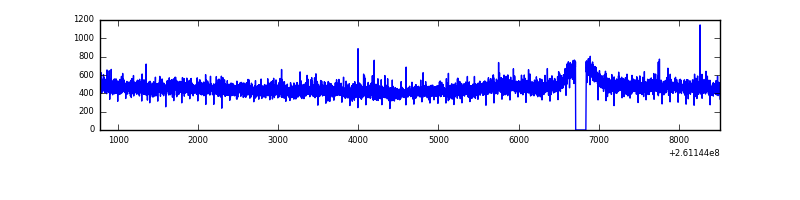 |
| B | 7746 | 7617 | 8 | 8 | 0.10% | 0.11% | 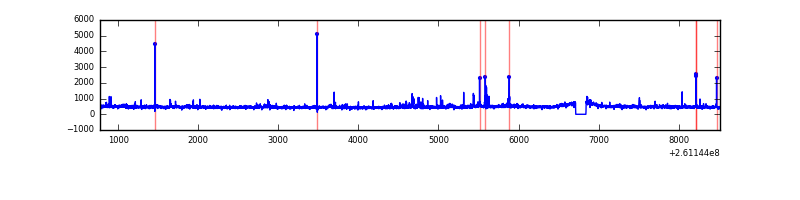 |
| C | 7746 | 7617 | 47 | 47 | 0.61% | 0.62% | 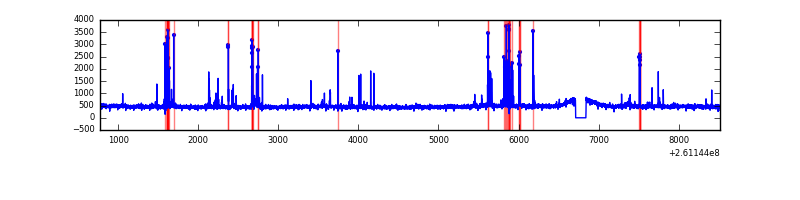 |
| D | 7746 | 7617 | 32 | 32 | 0.41% | 0.42% | 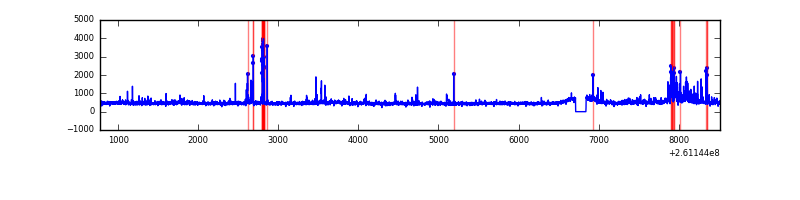 |
Top three noisy pixels from each quadrant. If the there are fewer than three noisy pixels in the level2.evt file, extra rows are filled as -1
| Pixel properties | Quadrant properties | ||||||
|---|---|---|---|---|---|---|---|
| Quadrant | DetID | PixID | Counts | Sigma | Mean | Median | Sigma |
| A | 1 | 162 | 20418 | 107.56 | 893 | 873 | 181.7 |
| A | 15 | 222 | 10117 | 50.87 | 893 | 873 | 181.7 |
| A | 0 | 226 | 7960 | 39.0 | 893 | 873 | 181.7 |
| B | 8 | 250 | 111710 | 657.42 | 894 | 869 | 168.6 |
| B | 4 | 80 | 40661 | 236.01 | 894 | 869 | 168.6 |
| B | 0 | 219 | 24021 | 137.32 | 894 | 869 | 168.6 |
| C | 4 | 254 | 293749 | 1478.71 | 865 | 868 | 198.1 |
| C | 3 | 233 | 104945 | 525.47 | 865 | 868 | 198.1 |
| C | 14 | 234 | 9038 | 41.25 | 865 | 868 | 198.1 |
| D | 1 | 52 | 221257 | 1061.49 | 867 | 840 | 207.6 |
| D | 8 | 195 | 215082 | 1031.75 | 867 | 840 | 207.6 |
| D | 13 | 249 | 66139 | 314.47 | 867 | 840 | 207.6 |
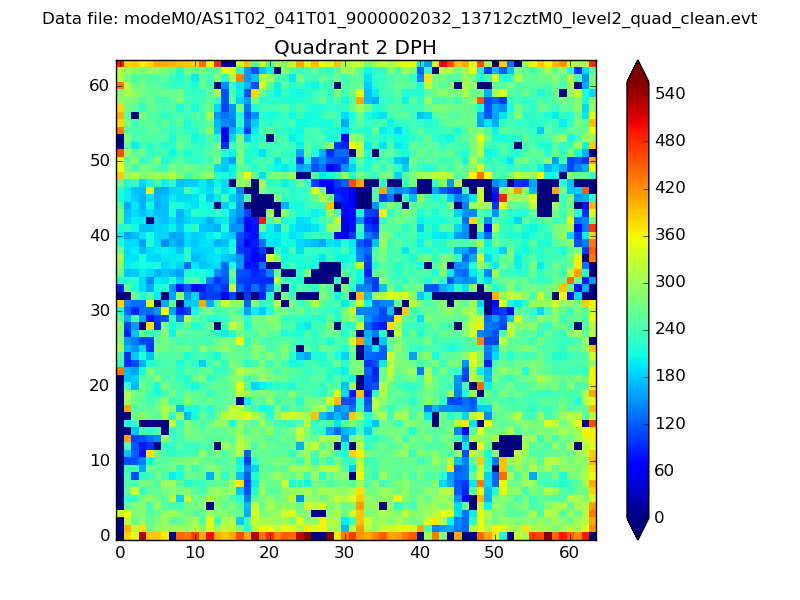
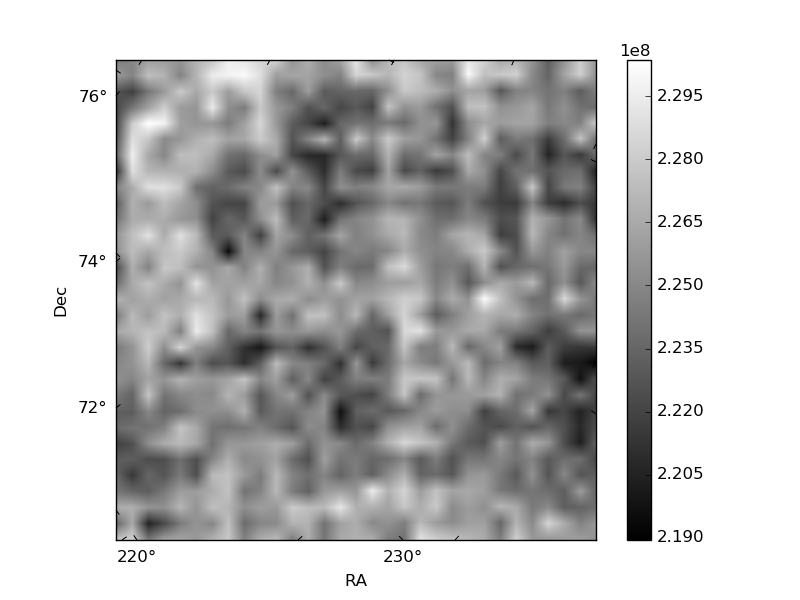
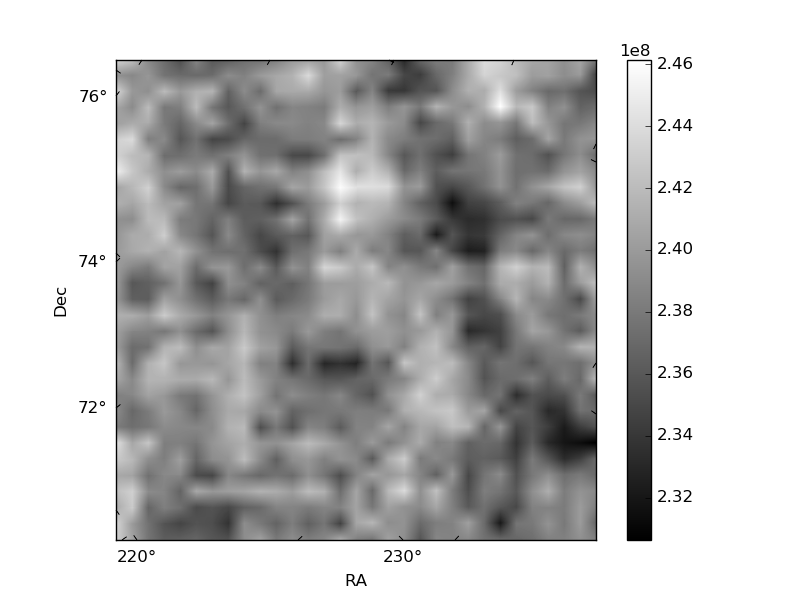
Histogram calculated using DETX and DETY for each event in the final _common_clean file
| Quadrant A | 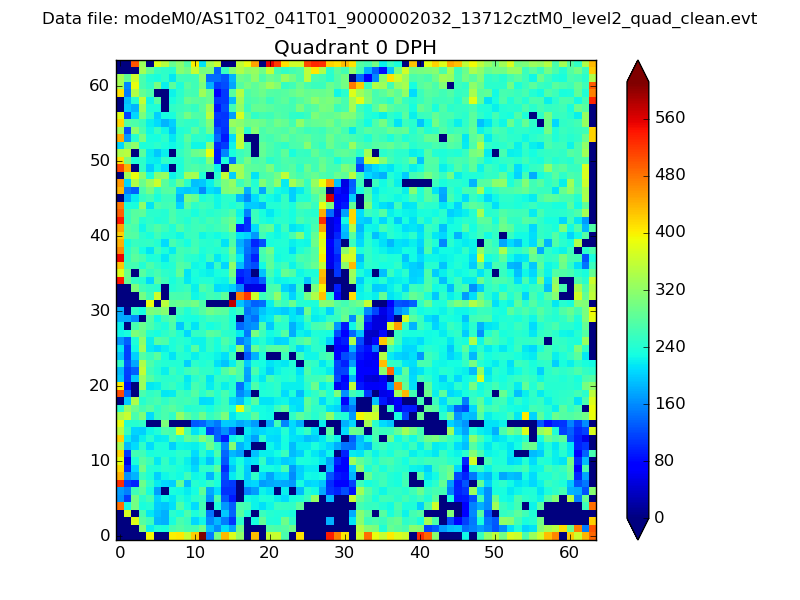 |
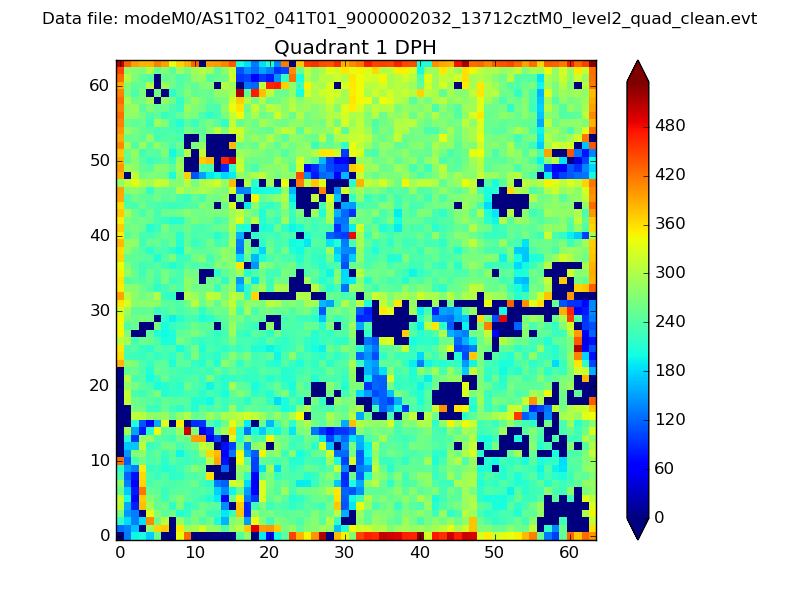 |
Quadrant B |
|---|---|---|---|
| Quadrant D | 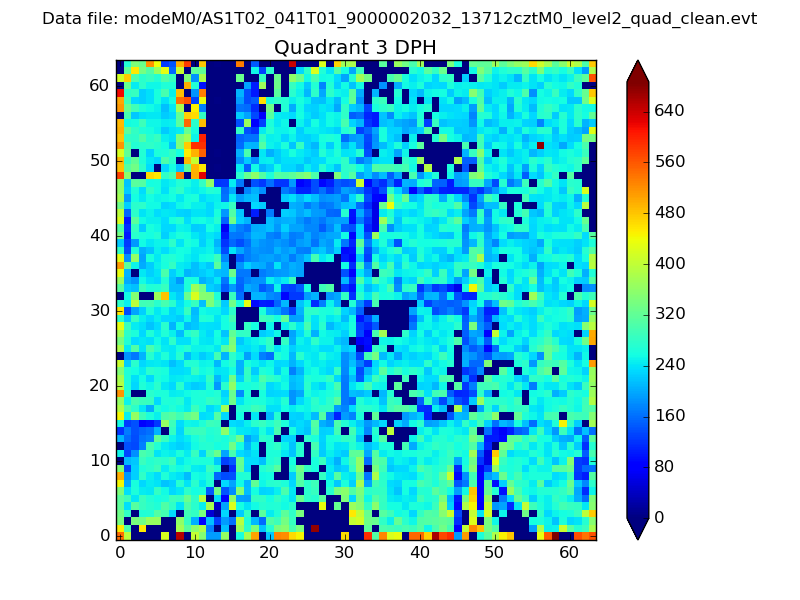 |
 |
Quadrant C |
| Plot type | Count rate plots | Images |
|---|---|---|
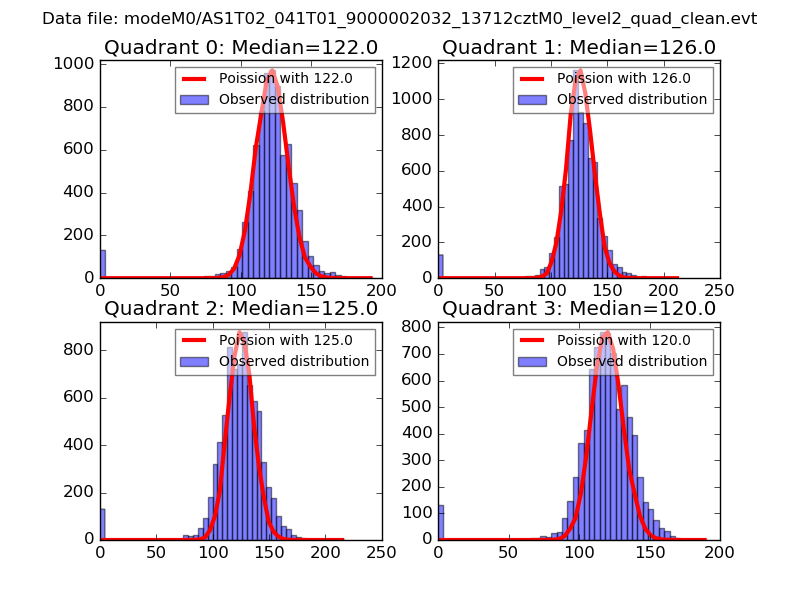
| Comparison with Poisson distribution Blue bars denote a histogram of data divided into 1 sec bins. Red curve is a Poisson curve with rate = median count rate of data. |
 |
 |
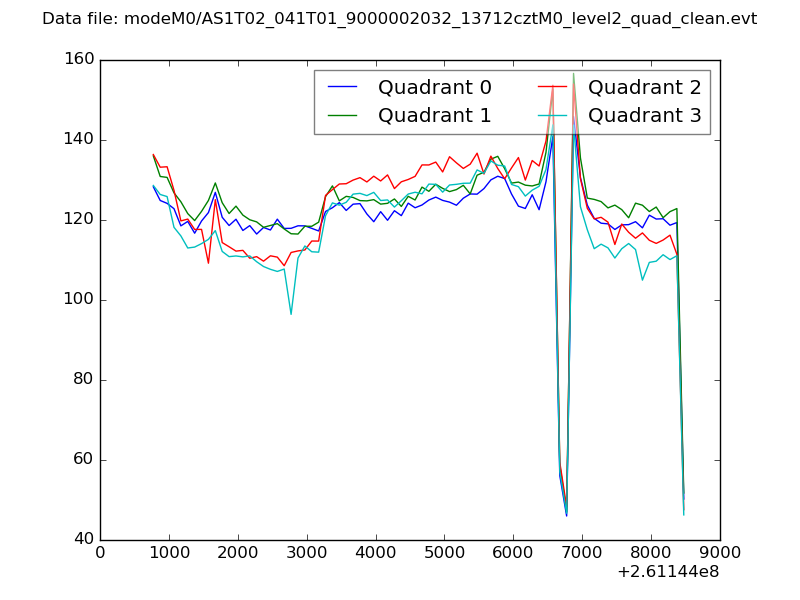
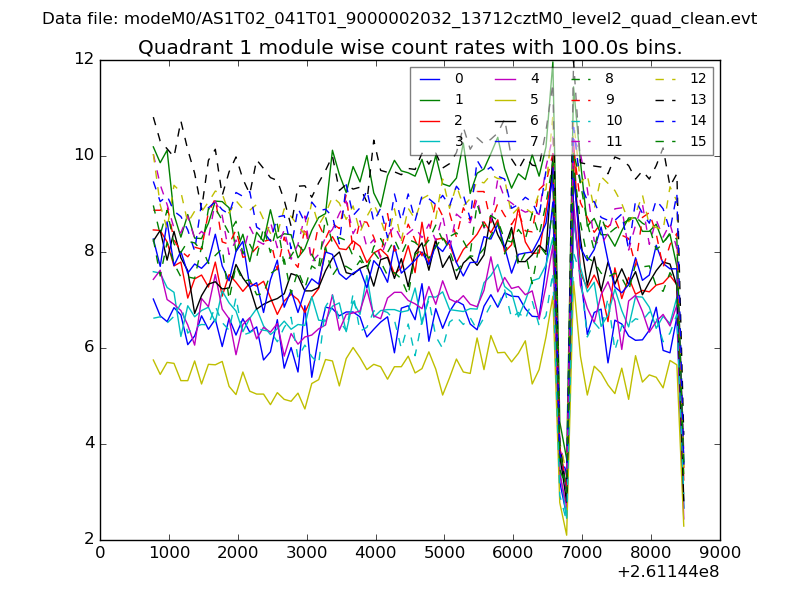
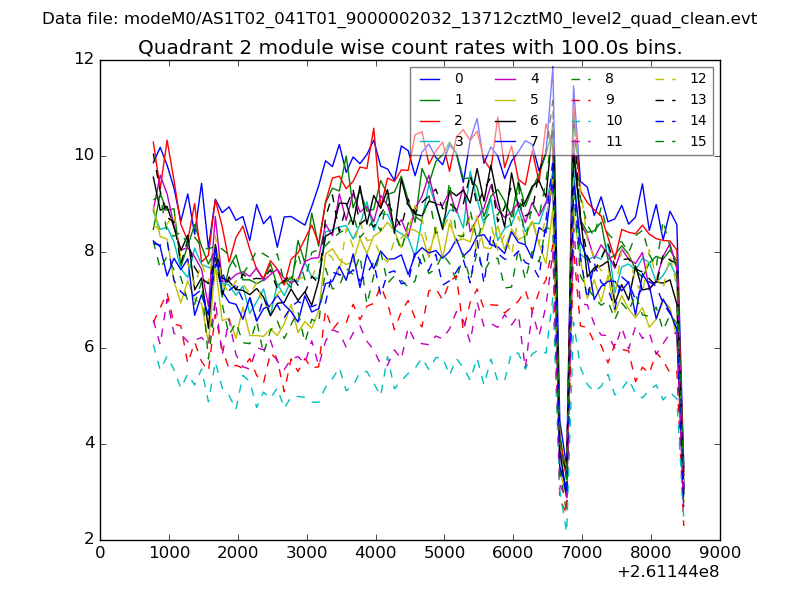
| Quadrant-wise count rates Data is divided into 100 sec bins |
 |
|
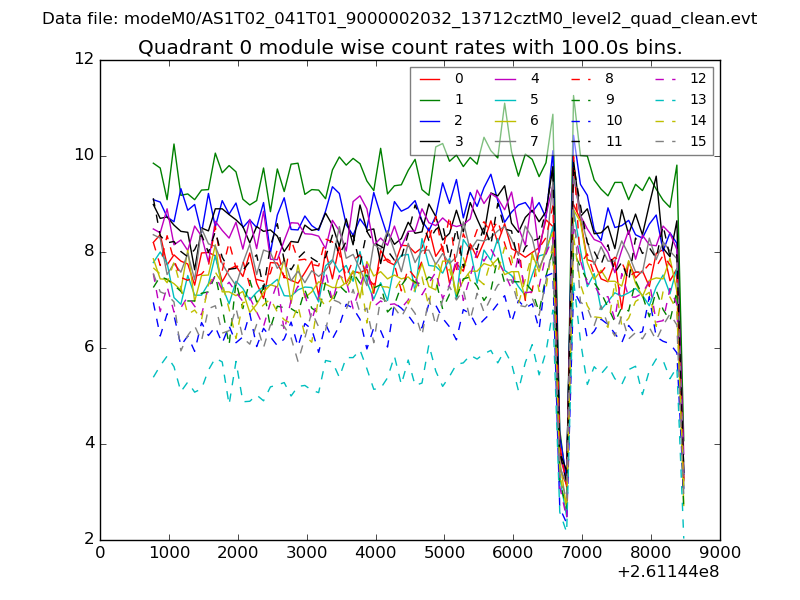
| Module-wise count rates for Quadrant A Data is divided into 100 sec bins |
 |
 |
| Module-wise count rates for Quadrant B Data is divided into 100 sec bins |
 |
 |
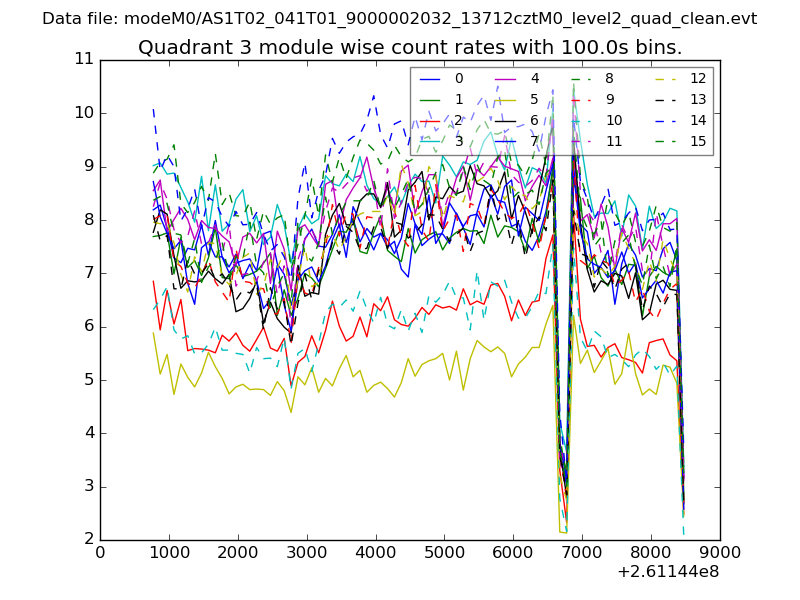
| Module-wise count rates for Quadrant C Data is divided into 100 sec bins |
 |
 |
| Module-wise count rates for Quadrant D Data is divided into 100 sec bins |
 |
 |
| Parameter | Plot |
|---|---|
| CZT HV Monitor | 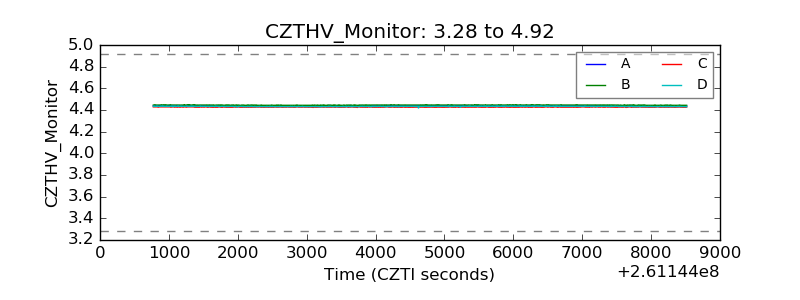 |
| D_VDD | 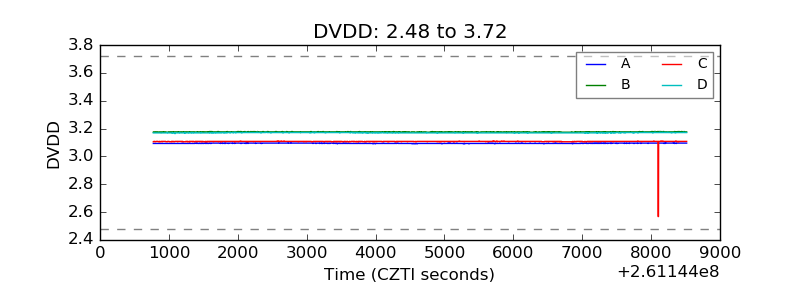 |
| Temperature 1 | 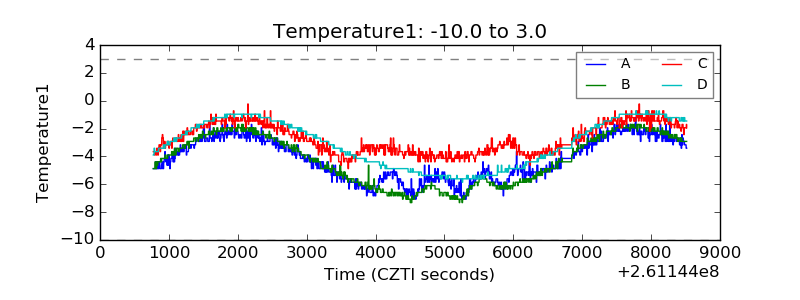 |
| Veto HV Monitor | 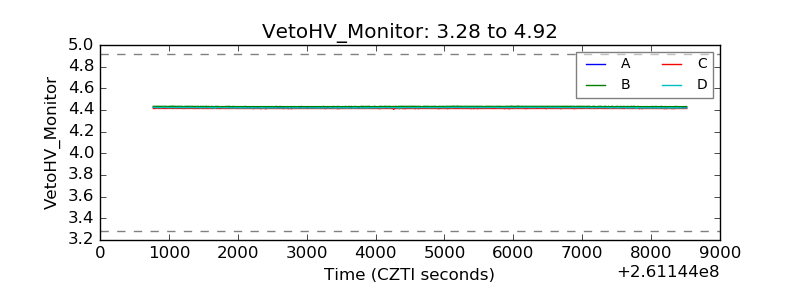 |
| Veto LLD | 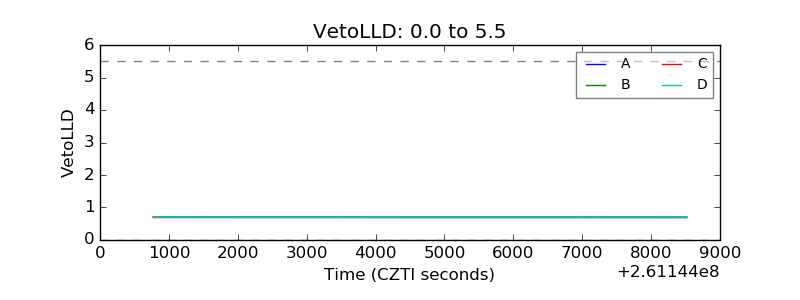 |
| Alpha Counter | 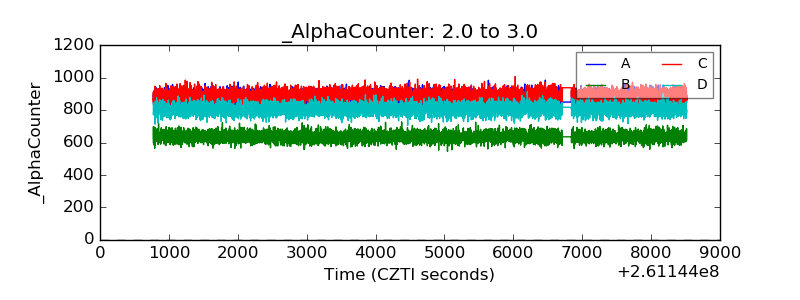 |
| _CPM_Rate | 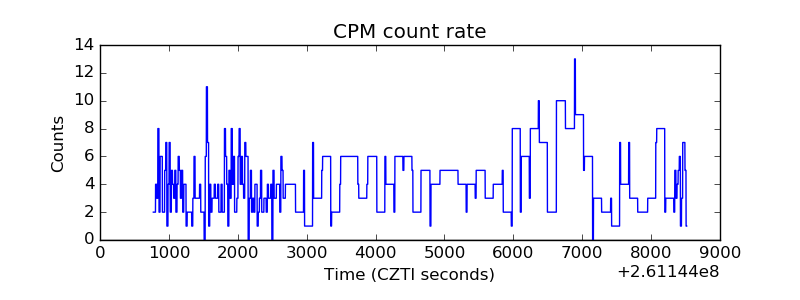 |
| CZT Counter | 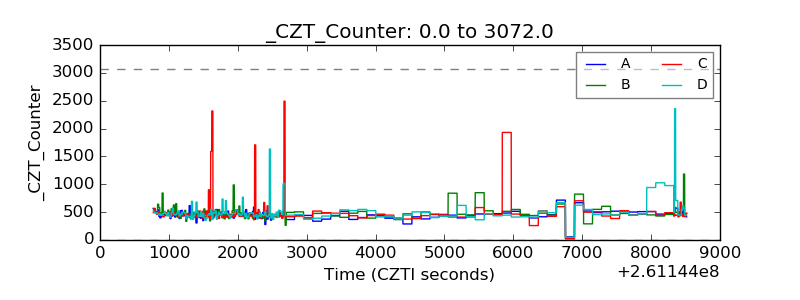 |
| +2.5 Volts monitor |  |
| +5 Volts monitor |  |
| _ROLL_ROT | 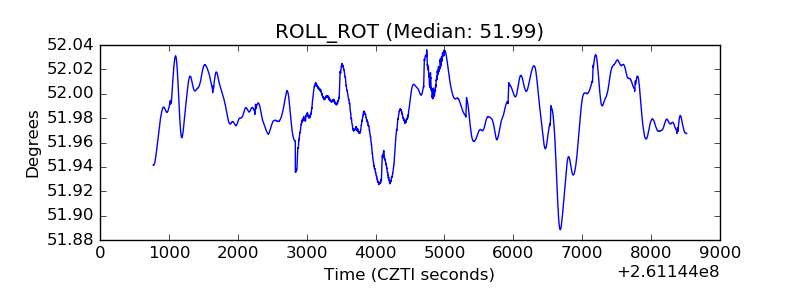 |
| _Roll_DEC | 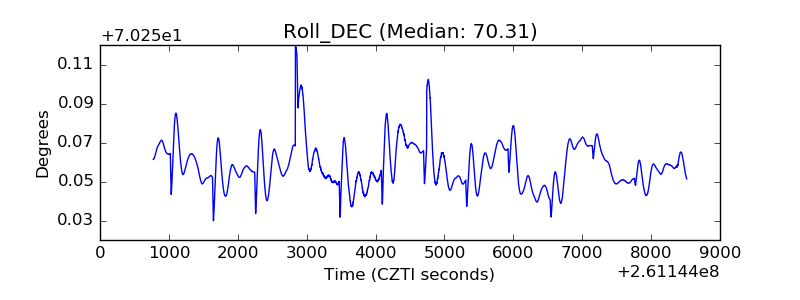 |
| _Roll_RA |  |
| Veto Counter | 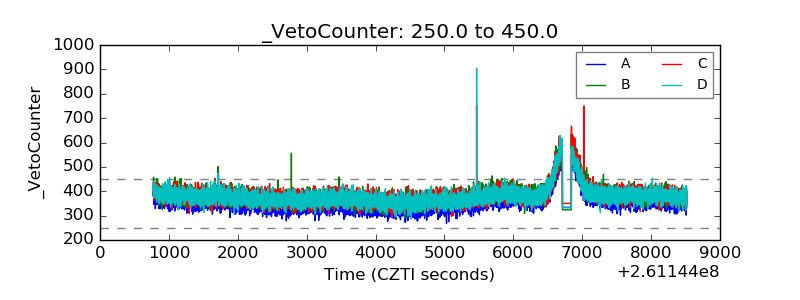 |