| Param | Original file | Final file |
|---|---|---|
| Filename | modeM0/AS1T02_041T01_9000002032_13715cztM0_level2.evt | modeM0/AS1T02_041T01_9000002032_13715cztM0_level2_quad_clean.evt |
| Size (bytes) | 1,214,349,120 | 331,905,600 |
| Size | 1.1 GB | 316.5 MB |
| Events in quadrant A | 8,062,774 | 2,190,123 |
| Events in quadrant B | 8,663,512 | 2,242,183 |
| Events in quadrant C | 9,904,043 | 2,226,475 |
| Events in quadrant D | 8,941,838 | 2,167,589 |
| Mode M0 | |||
|---|---|---|---|
| Quadrant | BADHDUFLAG | Total packets | Discarded packets |
| A | 0 | 36331 | 4 |
| B | 0 | 37500 | 3 |
| C | 0 | 41009 | 3 |
| D | 0 | 38520 | 3 |
| Mode SS | |||
|---|---|---|---|
| Quadrant | BADHDUFLAG | Total packets | Discarded packets |
| A | 0 | 362 | 0 |
| B | 0 | 362 | 0 |
| C | 0 | 362 | 0 |
| D | 0 | 362 | 0 |
| Mode M9 | |||
|---|---|---|---|
| Quadrant | BADHDUFLAG | Total packets | Discarded packets |
| A | 0 | 17 | 0 |
| B | 0 | 17 | 0 |
| C | 0 | 17 | 0 |
| D | 0 | 17 | 0 |
| Quadrant | Total seconds | Saturated seconds | Saturation percentage |
|---|---|---|---|
| A | 17812 | 94 | 0.527734% |
| B | 17812 | 150 | 0.842129% |
| C | 17812 | 508 | 2.852010% |
| D | 17812 | 156 | 0.875814% |
Noise dominated data is calculated using 1-second bins in cleaned event files. If a bin has >2000 counts, and if more than 50% of those come from <1% of pixels, then it is considered to be noise-dominated and hence unusable.
| Quadrant | # 1 sec bins | Bins with >0 counts | Bins with >2000 counts | High rate bins dominated by noise | Noise dominated (total time) | Noise dominated (detector-on time) | Marked lightcurve |
|---|---|---|---|---|---|---|---|
| A | 19498 | 17816 | 14 | 14 | 0.07% | 0.08% | 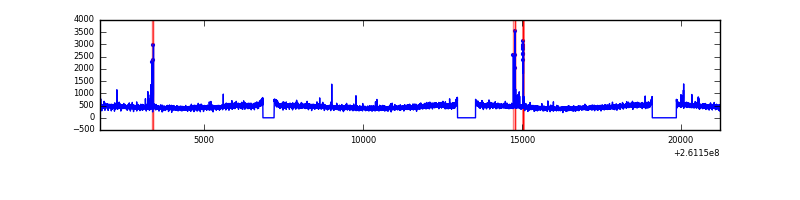 |
| B | 19498 | 17816 | 20 | 20 | 0.10% | 0.11% | 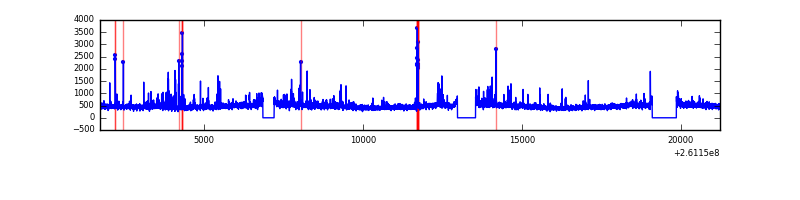 |
| C | 19498 | 17816 | 259 | 259 | 1.33% | 1.45% | 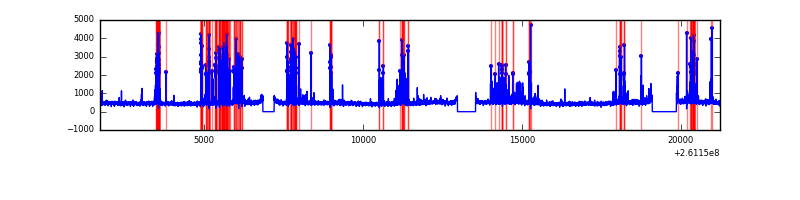 |
| D | 19498 | 17816 | 38 | 38 | 0.19% | 0.21% | 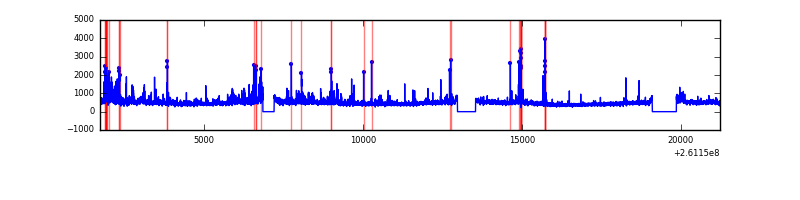 |
Top three noisy pixels from each quadrant. If the there are fewer than three noisy pixels in the level2.evt file, extra rows are filled as -1
| Pixel properties | Quadrant properties | ||||||
|---|---|---|---|---|---|---|---|
| Quadrant | DetID | PixID | Counts | Sigma | Mean | Median | Sigma |
| A | 15 | 69 | 87924 | 204.91 | 2066 | 2015 | 419.2 |
| A | 1 | 162 | 18583 | 39.52 | 2066 | 2015 | 419.2 |
| A | 0 | 226 | 18245 | 38.71 | 2066 | 2015 | 419.2 |
| B | 0 | 219 | 125303 | 314.86 | 2076 | 2020 | 391.6 |
| B | 4 | 173 | 90751 | 226.61 | 2076 | 2020 | 391.6 |
| B | 8 | 250 | 81087 | 201.93 | 2076 | 2020 | 391.6 |
| C | 4 | 254 | 1561469 | 3383.27 | 2017 | 2027 | 460.9 |
| C | 3 | 233 | 452039 | 976.32 | 2017 | 2027 | 460.9 |
| C | 4 | 238 | 22201 | 43.77 | 2017 | 2027 | 460.9 |
| D | 1 | 52 | 590804 | 1226.83 | 2027 | 1971 | 480.0 |
| D | 8 | 195 | 317233 | 656.85 | 2027 | 1971 | 480.0 |
| D | 10 | 157 | 189404 | 390.52 | 2027 | 1971 | 480.0 |
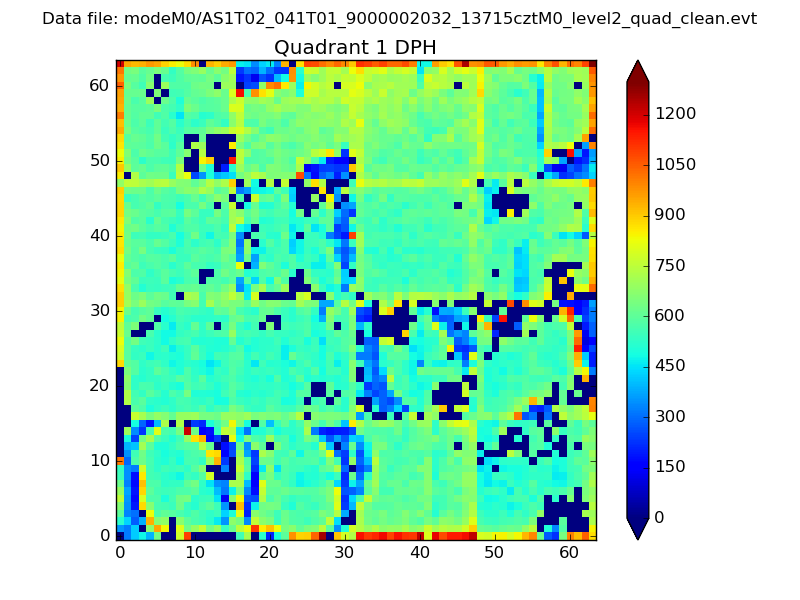
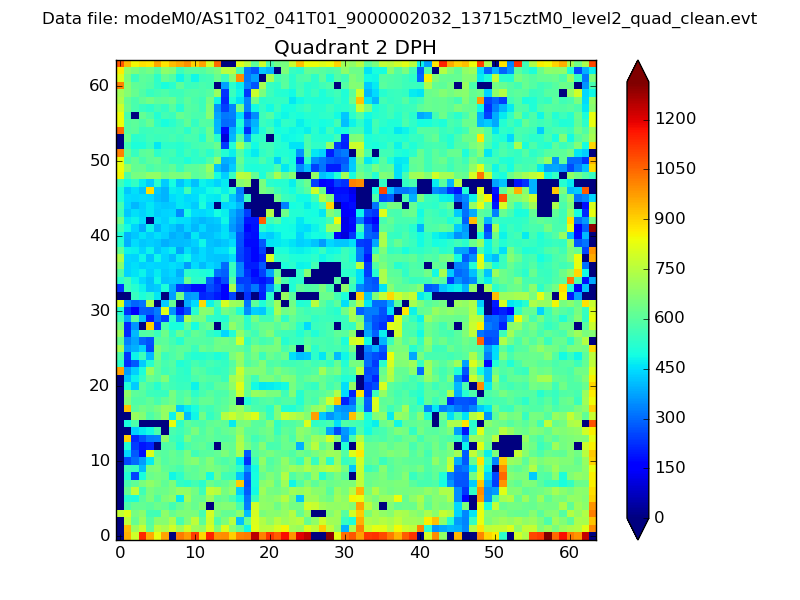
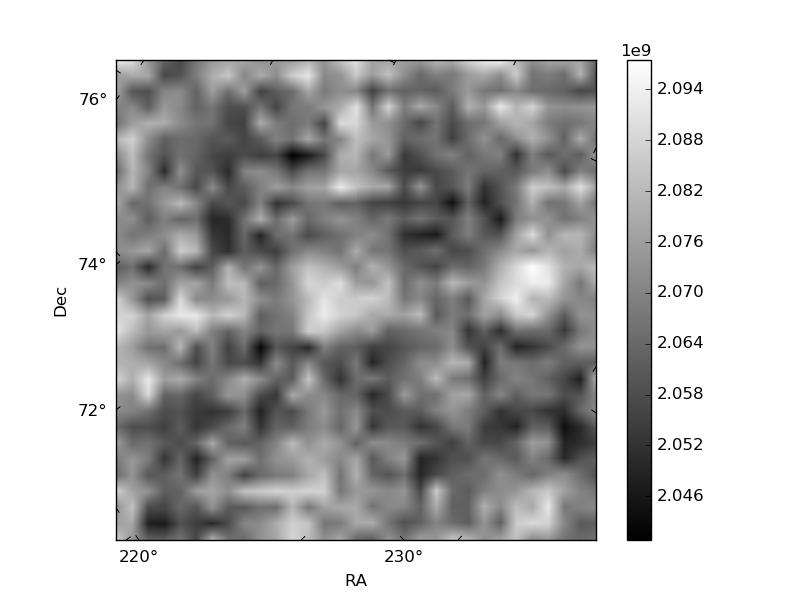
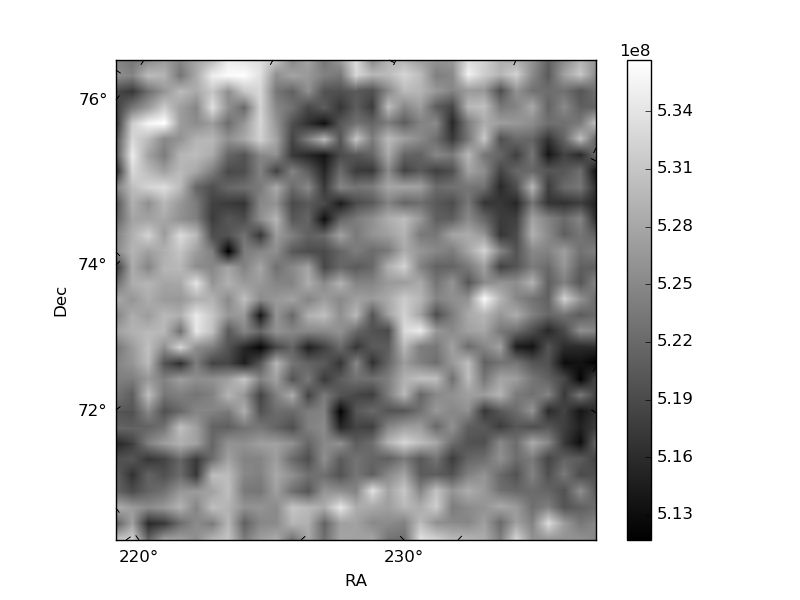
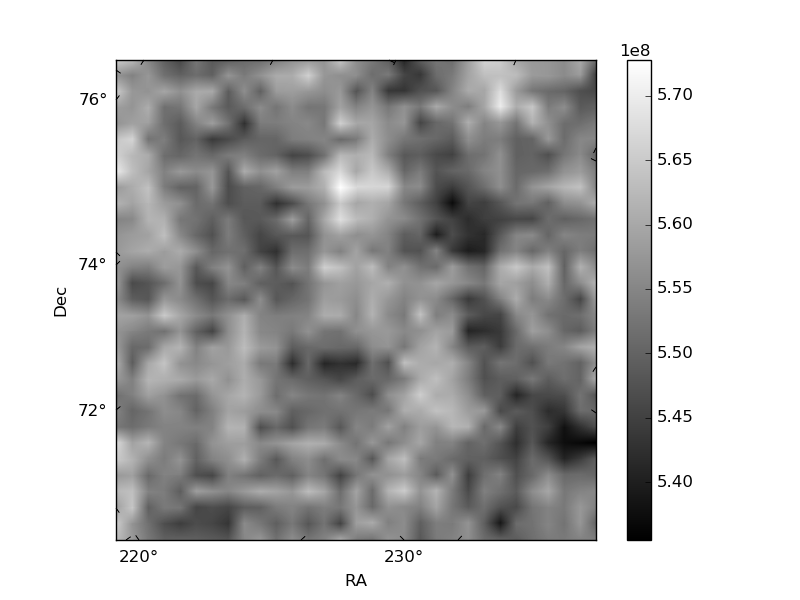
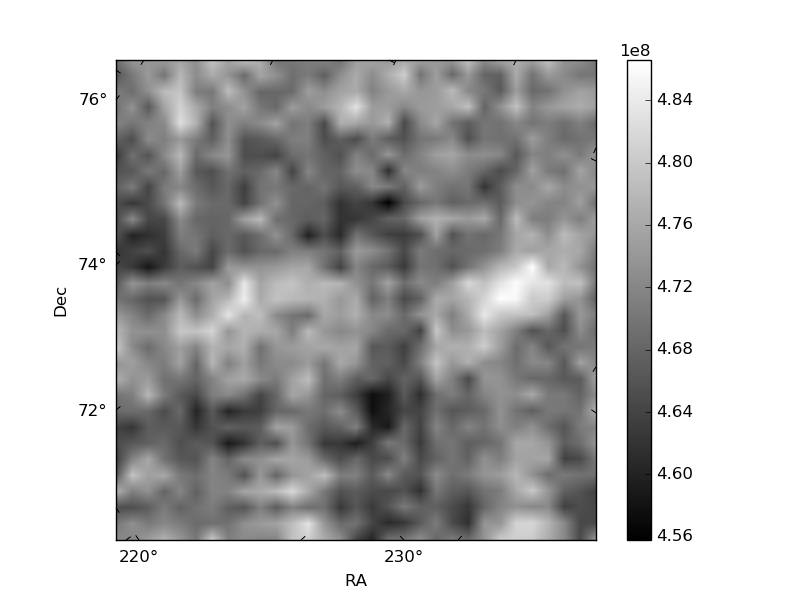
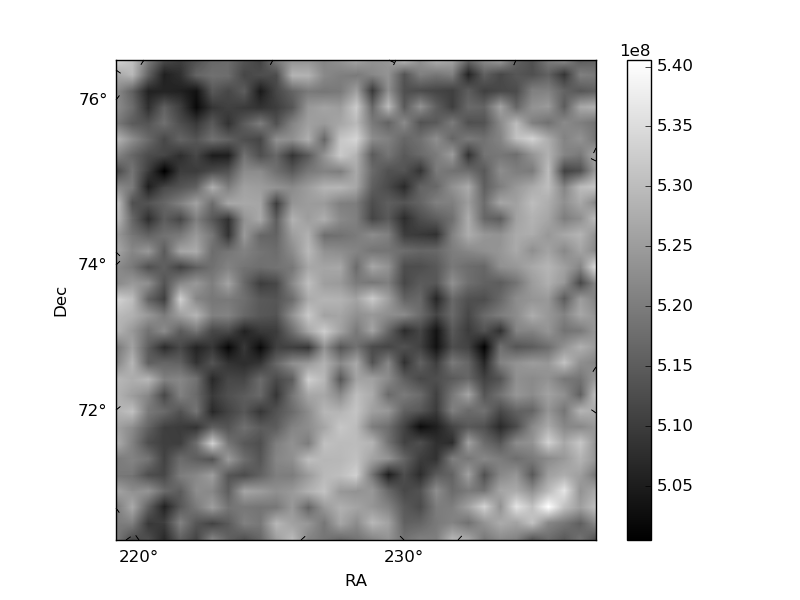
Histogram calculated using DETX and DETY for each event in the final _common_clean file
| Quadrant A |  |
 |
Quadrant B |
|---|---|---|---|
| Quadrant D | 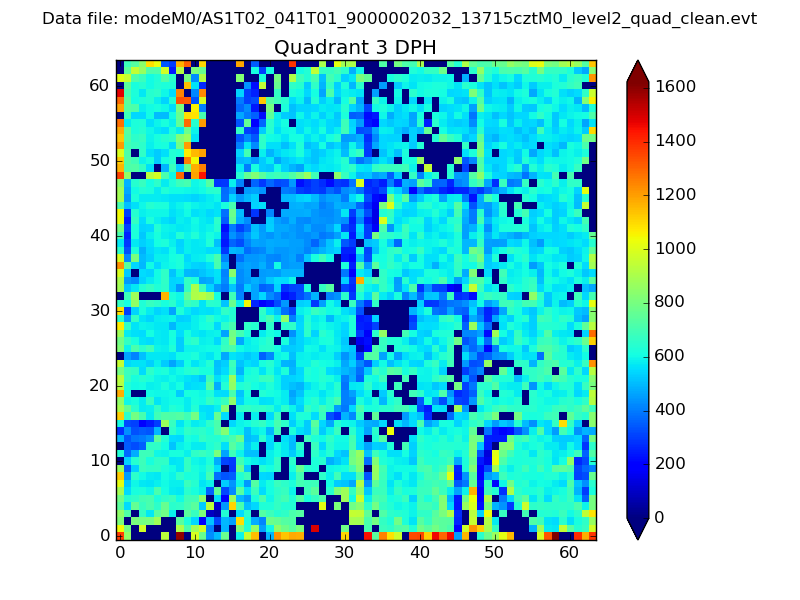 |
 |
Quadrant C |
| Plot type | Count rate plots | Images |
|---|---|---|
| Comparison with Poisson distribution Blue bars denote a histogram of data divided into 1 sec bins. Red curve is a Poisson curve with rate = median count rate of data. |
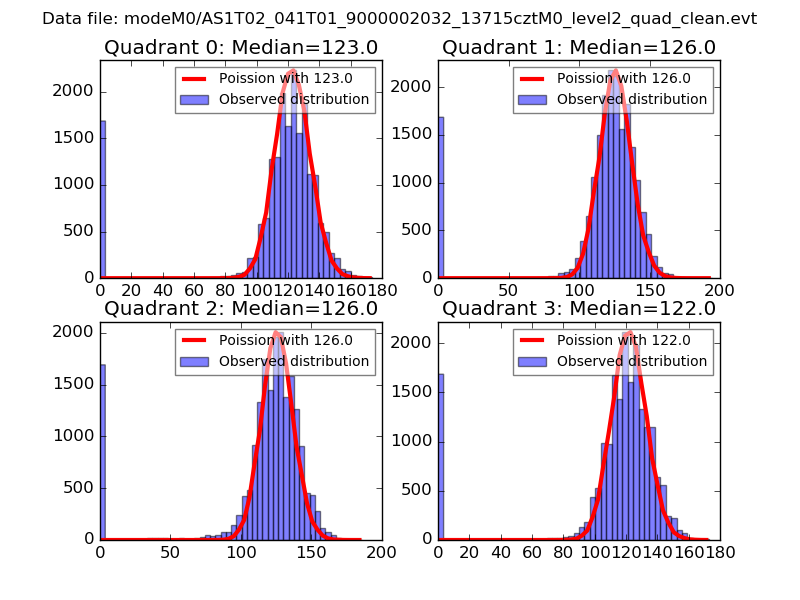 |
 |
| Quadrant-wise count rates Data is divided into 100 sec bins |
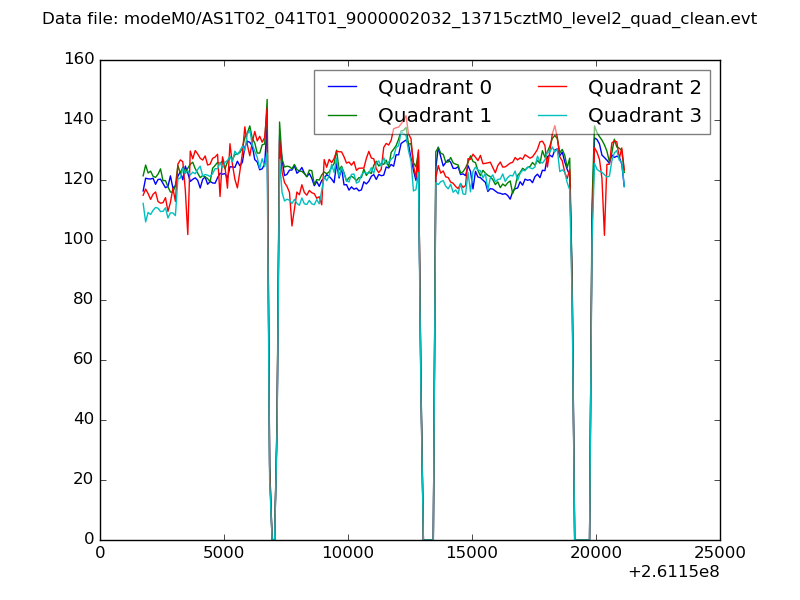 |
|
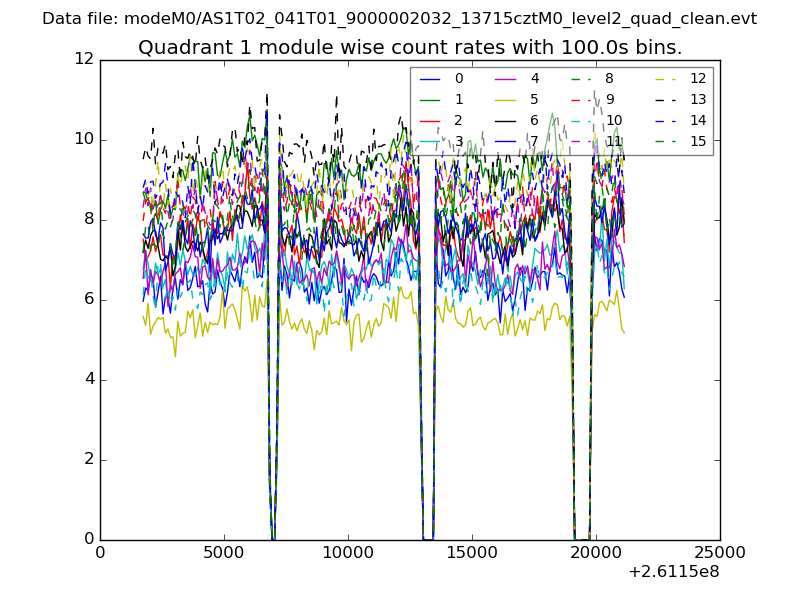
| Module-wise count rates for Quadrant A Data is divided into 100 sec bins |
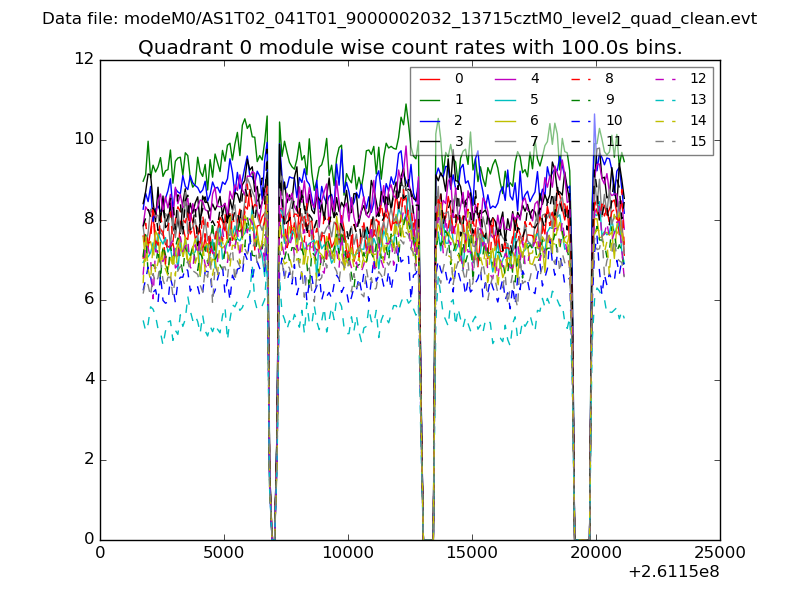 |
 |
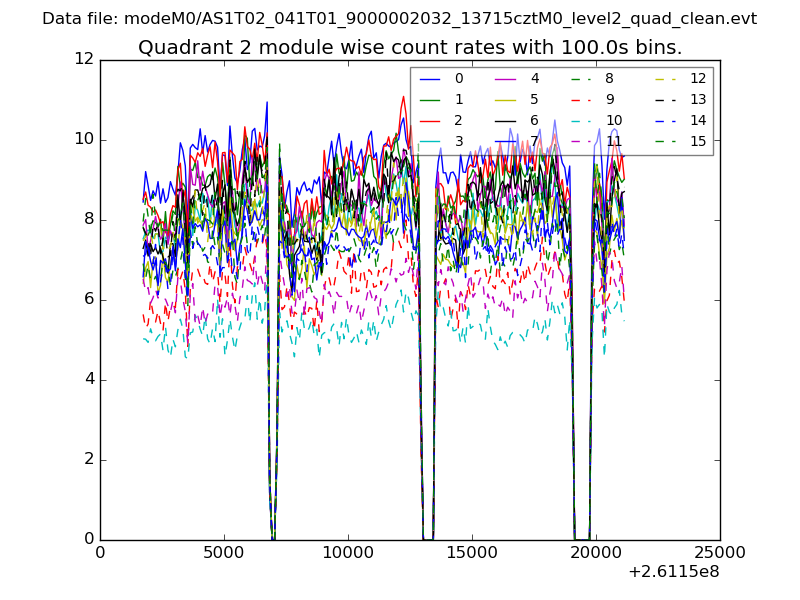
| Module-wise count rates for Quadrant B Data is divided into 100 sec bins |
 |
 |
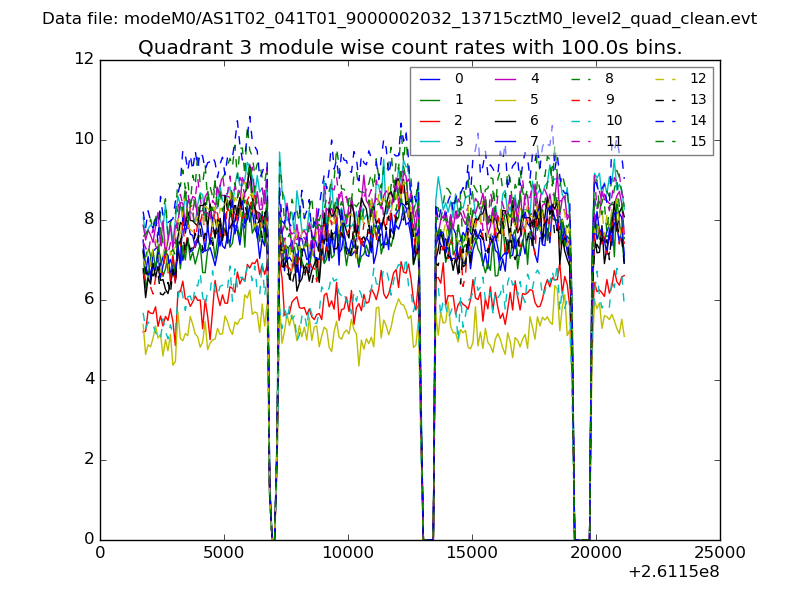
| Module-wise count rates for Quadrant C Data is divided into 100 sec bins |
 |
 |
| Module-wise count rates for Quadrant D Data is divided into 100 sec bins |
 |
 |
| Parameter | Plot |
|---|---|
| CZT HV Monitor | 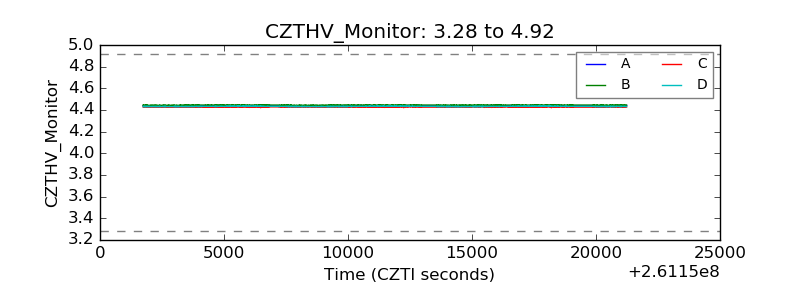 |
| D_VDD | 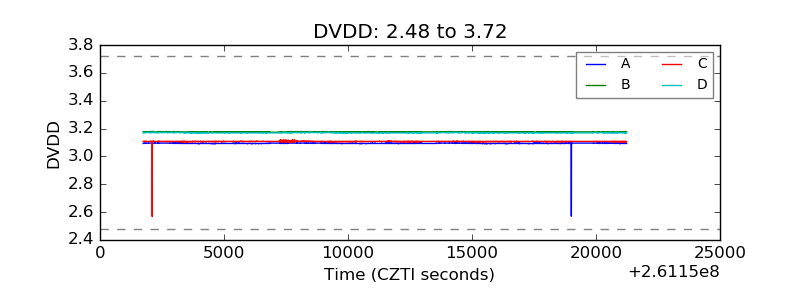 |
| Temperature 1 | 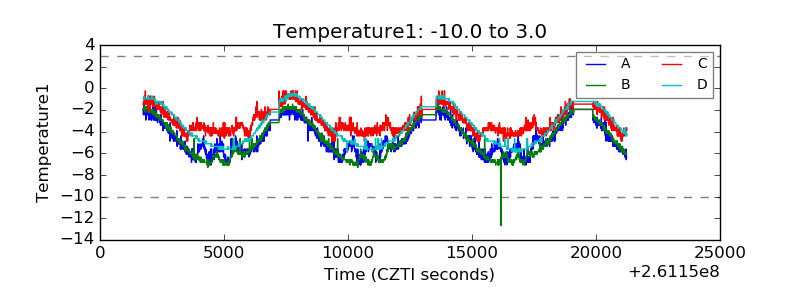 |
| Veto HV Monitor | 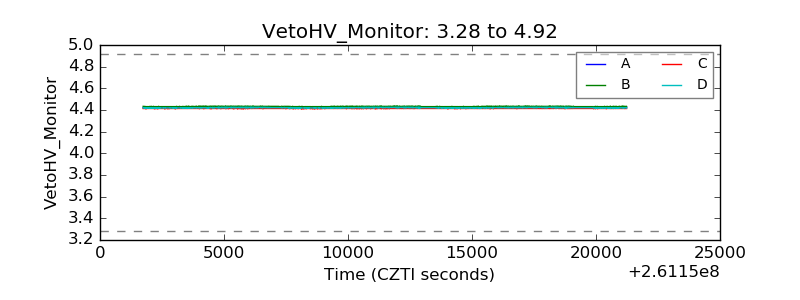 |
| Veto LLD | 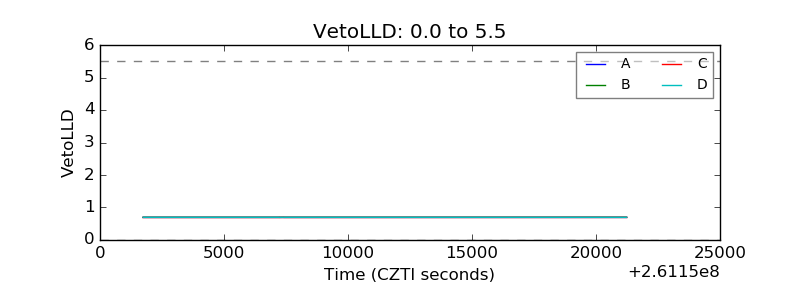 |
| Alpha Counter | 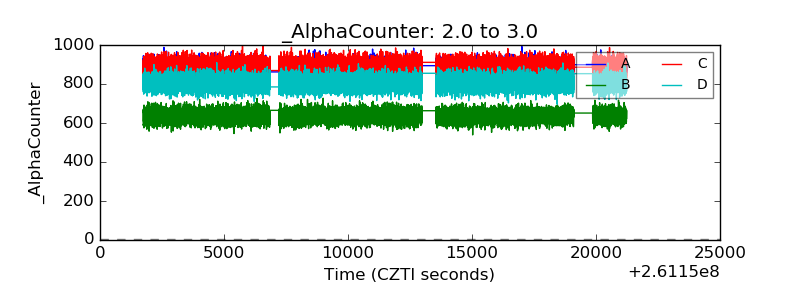 |
| _CPM_Rate | 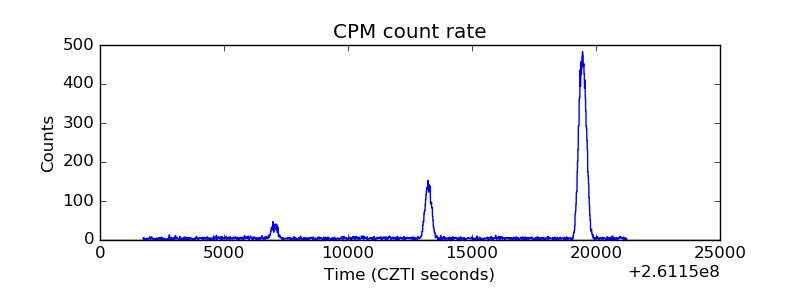 |
| CZT Counter | 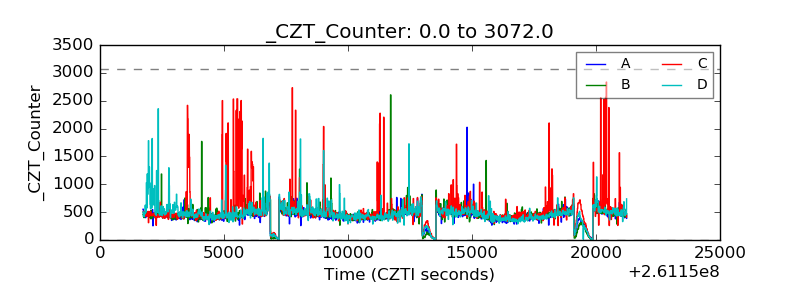 |
| +2.5 Volts monitor |  |
| +5 Volts monitor |  |
| _ROLL_ROT | 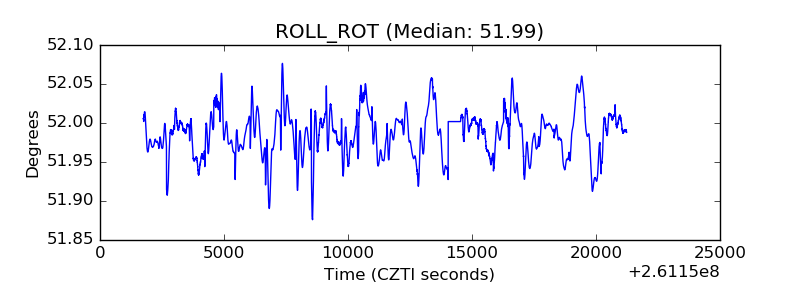 |
| _Roll_DEC | 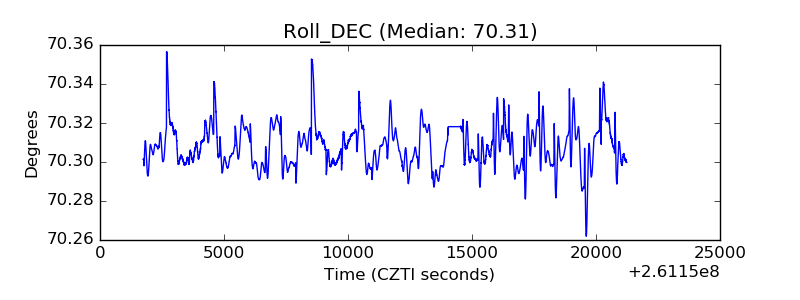 |
| _Roll_RA | 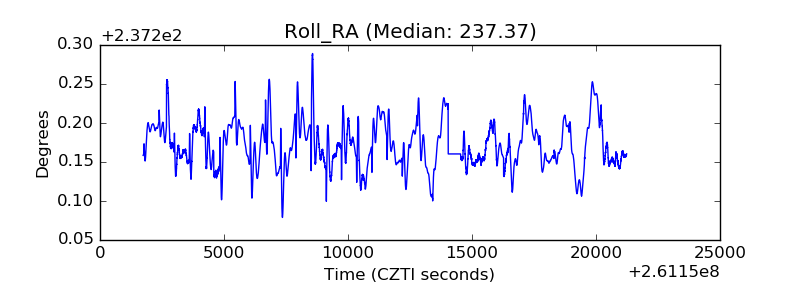 |
| Veto Counter | 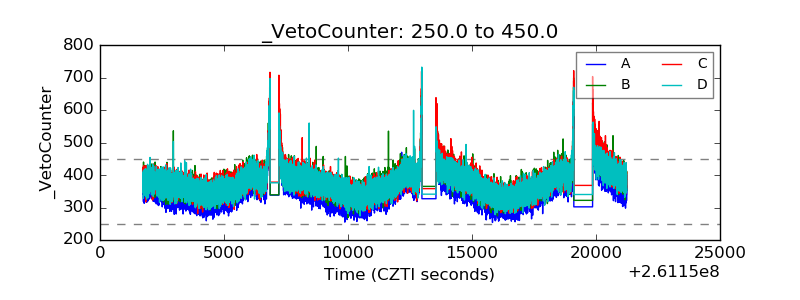 |