| Param | Original file | Final file |
|---|---|---|
| Filename | modeM0/AS1T02_041T01_9000002032_13719cztM0_level2.evt | modeM0/AS1T02_041T01_9000002032_13719cztM0_level2_quad_clean.evt |
| Size (bytes) | 242,303,040 | 72,861,120 |
| Size | 231.1 MB | 69.5 MB |
| Events in quadrant A | 1,603,463 | 473,064 |
| Events in quadrant B | 1,961,018 | 491,451 |
| Events in quadrant C | 1,745,699 | 506,942 |
| Events in quadrant D | 1,778,704 | 477,341 |
| Mode M0 | |||
|---|---|---|---|
| Quadrant | BADHDUFLAG | Total packets | Discarded packets |
| A | 0 | 7418 | 1 |
| B | 0 | 8304 | 1 |
| C | 0 | 7664 | 1 |
| D | 0 | 7914 | 1 |
| Mode SS | |||
|---|---|---|---|
| Quadrant | BADHDUFLAG | Total packets | Discarded packets |
| A | 0 | 76 | 0 |
| B | 0 | 76 | 0 |
| C | 0 | 76 | 0 |
| D | 0 | 76 | 0 |
| Mode M9 | |||
|---|---|---|---|
| Quadrant | BADHDUFLAG | Total packets | Discarded packets |
| A | 0 | 11 | 0 |
| B | 0 | 11 | 0 |
| C | 0 | 11 | 0 |
| D | 0 | 11 | 0 |
| Quadrant | Total seconds | Saturated seconds | Saturation percentage |
|---|---|---|---|
| A | 3637 | 5 | 0.137476% |
| B | 3637 | 17 | 0.467418% |
| C | 3637 | 2 | 0.054990% |
| D | 3637 | 13 | 0.357437% |
Noise dominated data is calculated using 1-second bins in cleaned event files. If a bin has >2000 counts, and if more than 50% of those come from <1% of pixels, then it is considered to be noise-dominated and hence unusable.
| Quadrant | # 1 sec bins | Bins with >0 counts | Bins with >2000 counts | High rate bins dominated by noise | Noise dominated (total time) | Noise dominated (detector-on time) | Marked lightcurve |
|---|---|---|---|---|---|---|---|
| A | 4763 | 3639 | 2 | 2 | 0.04% | 0.05% |  |
| B | 4763 | 3639 | 6 | 6 | 0.13% | 0.16% |  |
| C | 4763 | 3639 | 2 | 2 | 0.04% | 0.05% |  |
| D | 4763 | 3639 | 10 | 10 | 0.21% | 0.27% |  |
Top three noisy pixels from each quadrant. If the there are fewer than three noisy pixels in the level2.evt file, extra rows are filled as -1
| Pixel properties | Quadrant properties | ||||||
|---|---|---|---|---|---|---|---|
| Quadrant | DetID | PixID | Counts | Sigma | Mean | Median | Sigma |
| A | 15 | 222 | 5558 | 60.8 | 413 | 403 | 84.8 |
| A | 15 | 69 | 5384 | 58.74 | 413 | 403 | 84.8 |
| A | 1 | 162 | 4000 | 42.42 | 413 | 403 | 84.8 |
| B | 8 | 250 | 209719 | 2647.56 | 422 | 410 | 79.1 |
| B | 10 | 244 | 47807 | 599.53 | 422 | 410 | 79.1 |
| B | 3 | 64 | 16576 | 204.48 | 422 | 410 | 79.1 |
| C | 3 | 233 | 67612 | 698.12 | 417 | 420 | 96.2 |
| C | 12 | 4 | 49802 | 513.08 | 417 | 420 | 96.2 |
| C | 13 | 61 | 3112 | 27.97 | 417 | 420 | 96.2 |
| D | 8 | 195 | 98932 | 1013.28 | 407 | 396 | 97.2 |
| D | 5 | 222 | 88267 | 903.6 | 407 | 396 | 97.2 |
| D | 10 | 157 | 29270 | 296.92 | 407 | 396 | 97.2 |
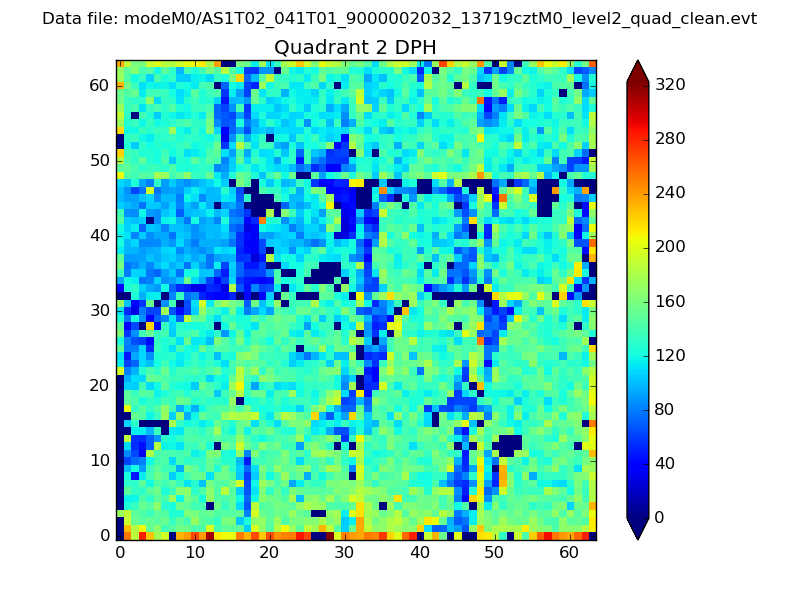
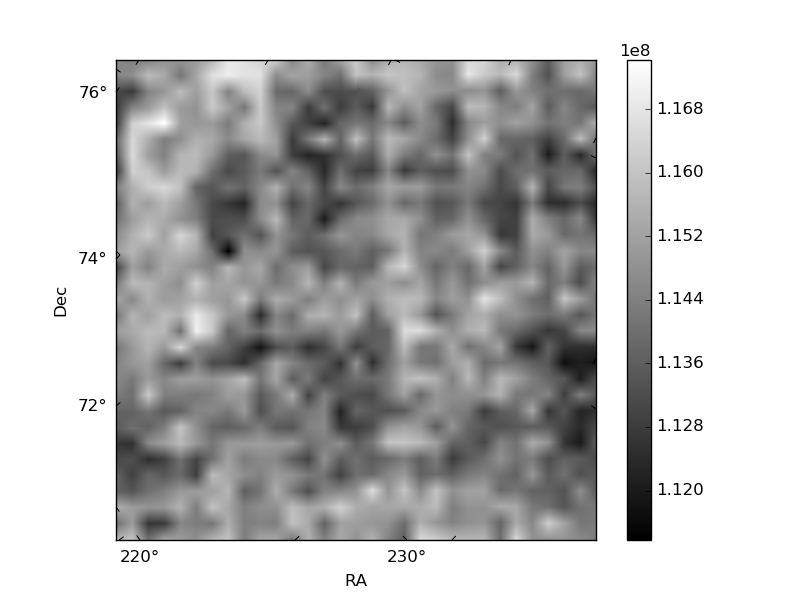
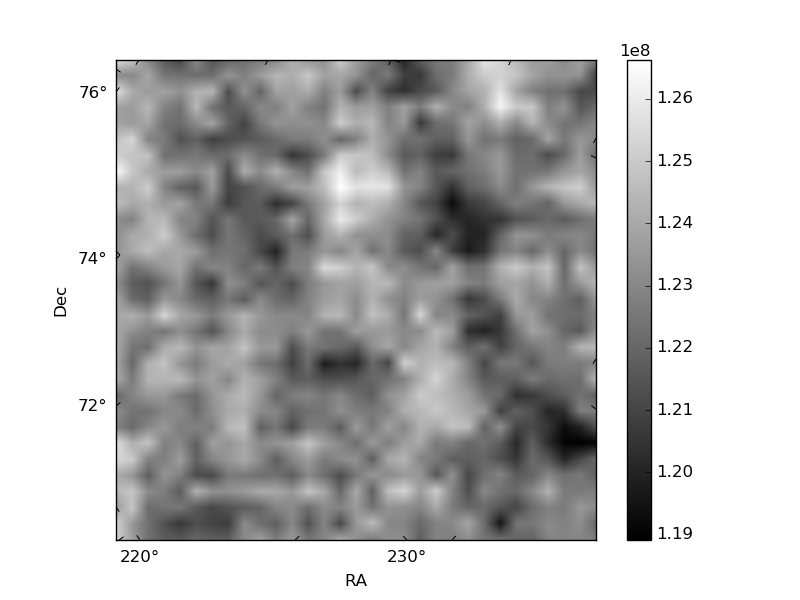
Histogram calculated using DETX and DETY for each event in the final _common_clean file
| Quadrant A | 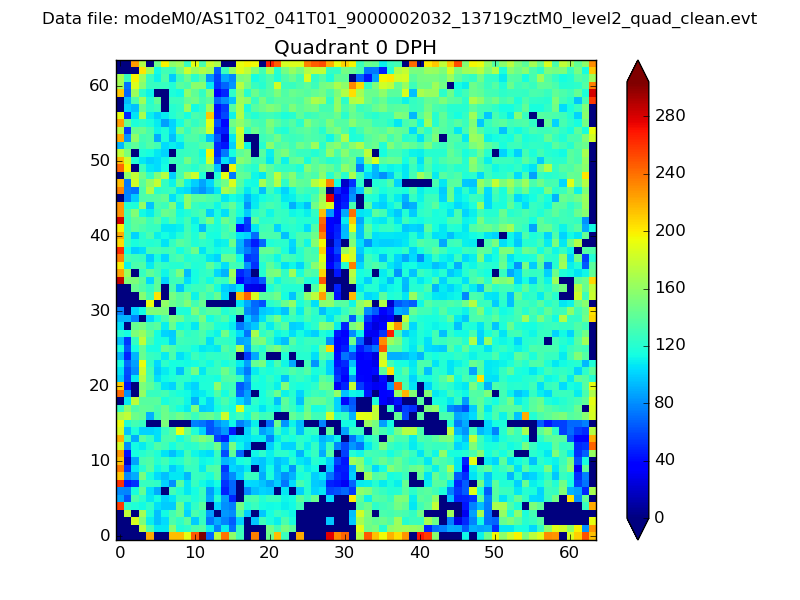 |
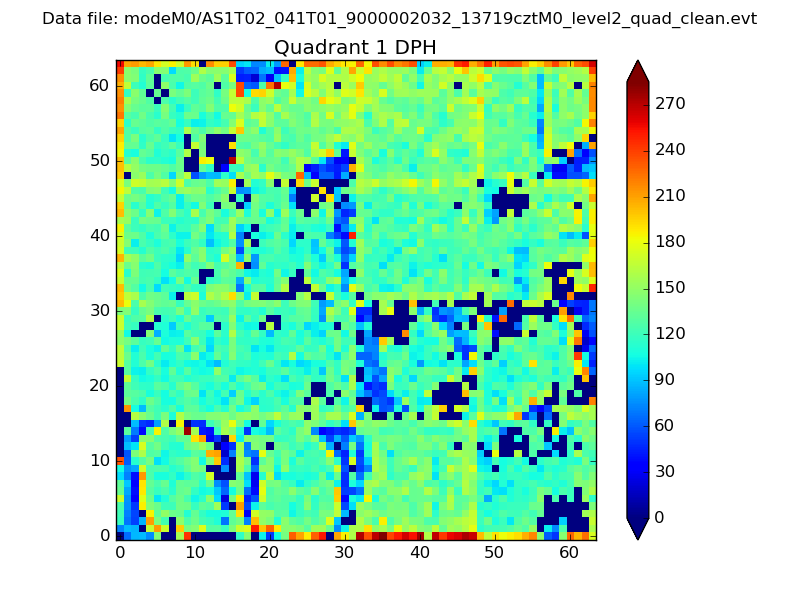 |
Quadrant B |
|---|---|---|---|
| Quadrant D | 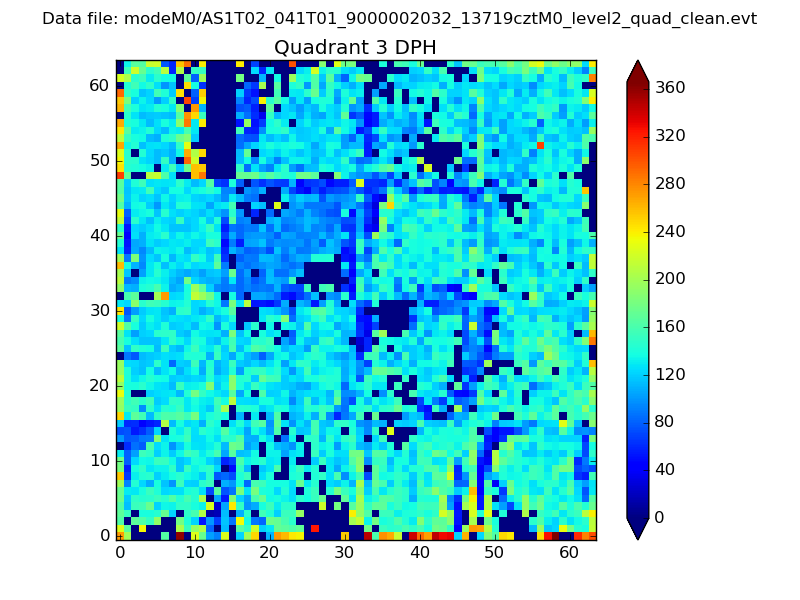 |
 |
Quadrant C |
| Plot type | Count rate plots | Images |
|---|---|---|
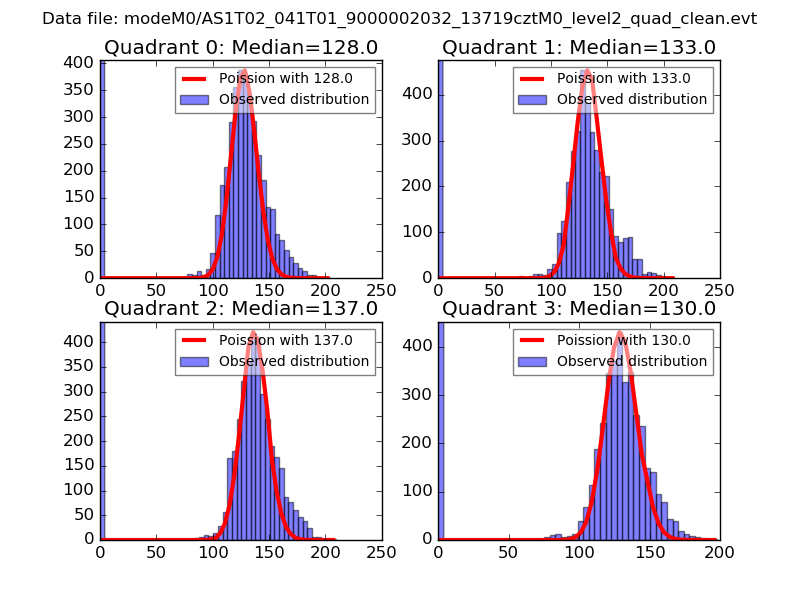
| Comparison with Poisson distribution Blue bars denote a histogram of data divided into 1 sec bins. Red curve is a Poisson curve with rate = median count rate of data. |
 |
 |
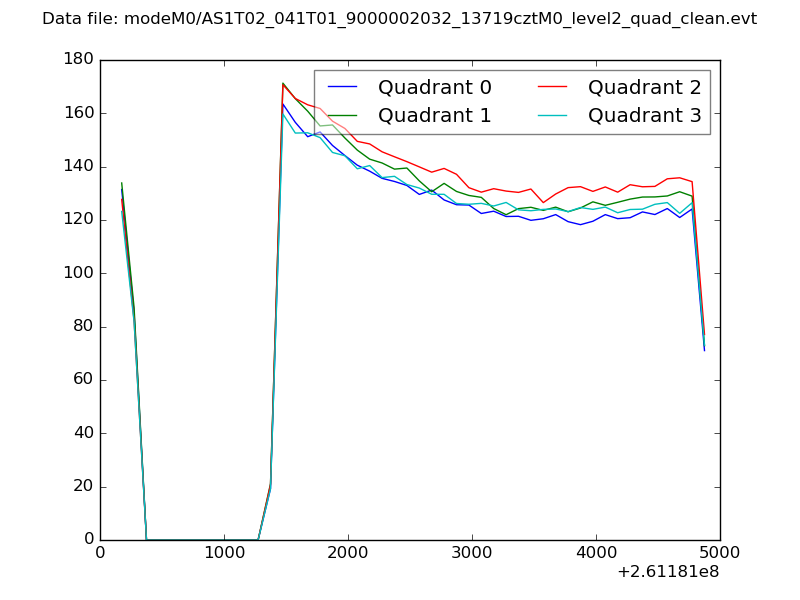
| Quadrant-wise count rates Data is divided into 100 sec bins |
 |
|
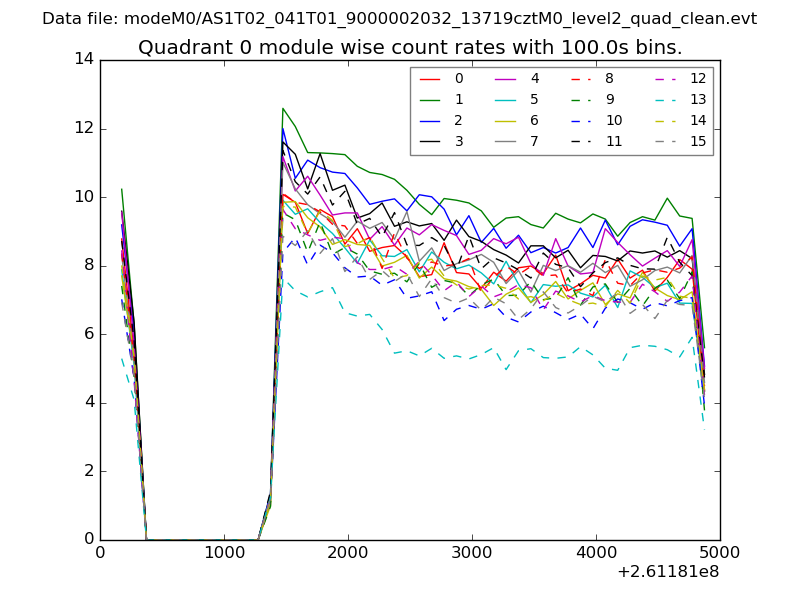
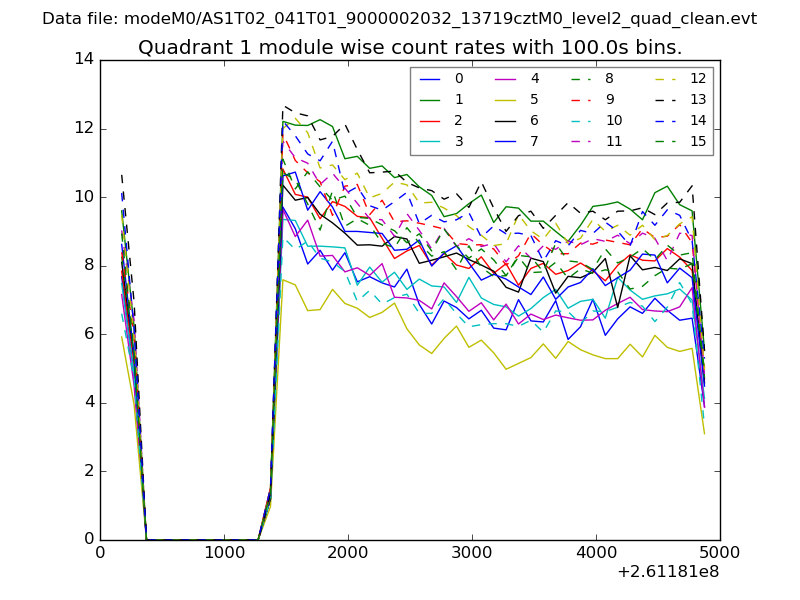
| Module-wise count rates for Quadrant A Data is divided into 100 sec bins |
 |
 |
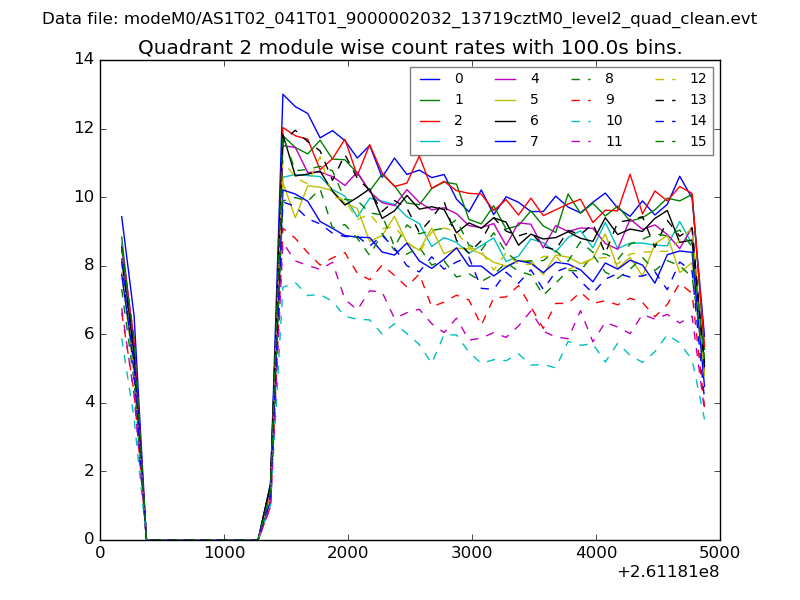
| Module-wise count rates for Quadrant B Data is divided into 100 sec bins |
 |
 |
| Module-wise count rates for Quadrant C Data is divided into 100 sec bins |
 |
 |
| Module-wise count rates for Quadrant D Data is divided into 100 sec bins |
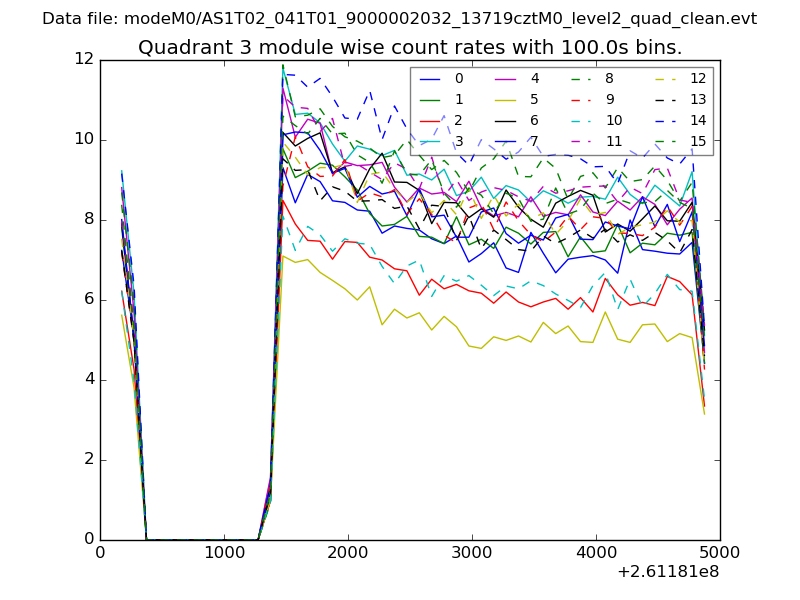 |
 |
| Parameter | Plot |
|---|---|
| CZT HV Monitor |  |
| D_VDD | 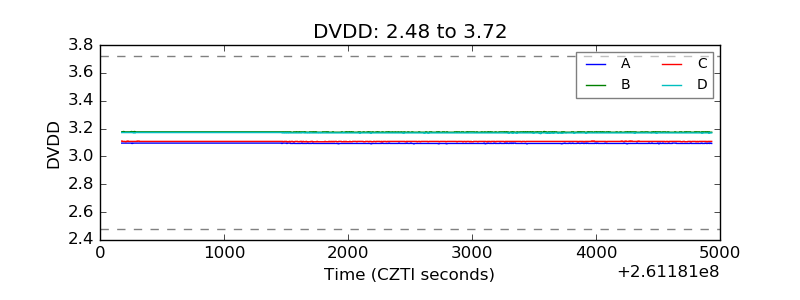 |
| Temperature 1 | 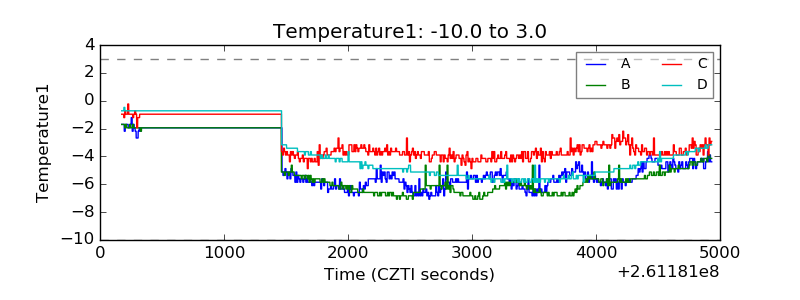 |
| Veto HV Monitor | 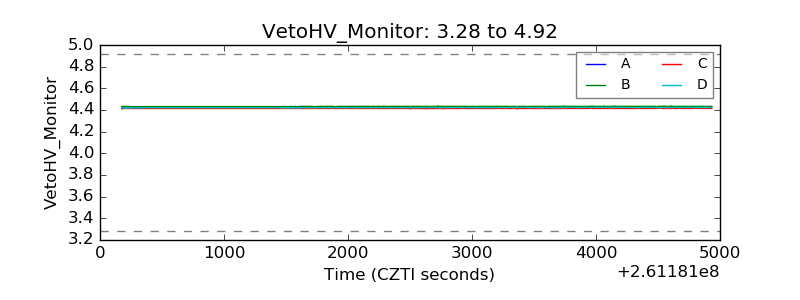 |
| Veto LLD | 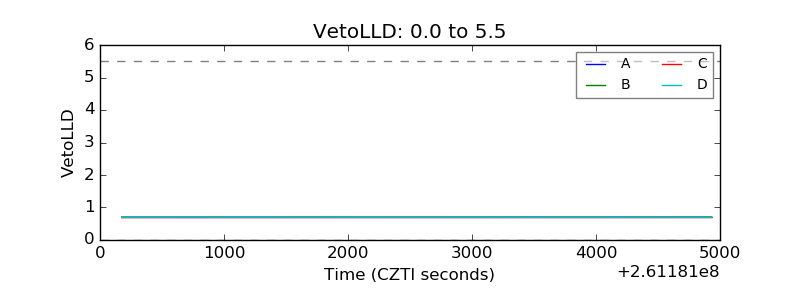 |
| Alpha Counter | 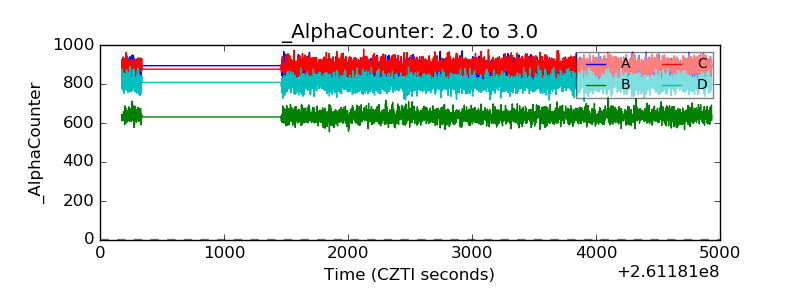 |
| _CPM_Rate | 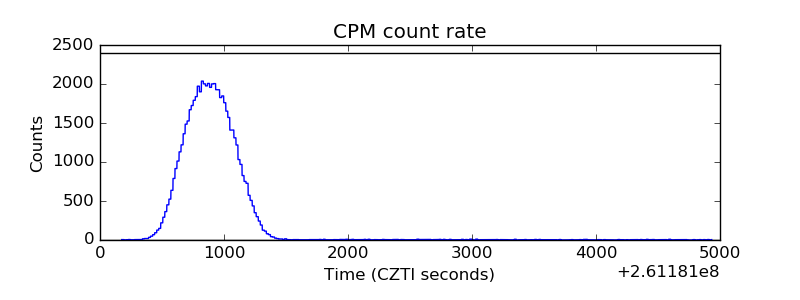 |
| CZT Counter | 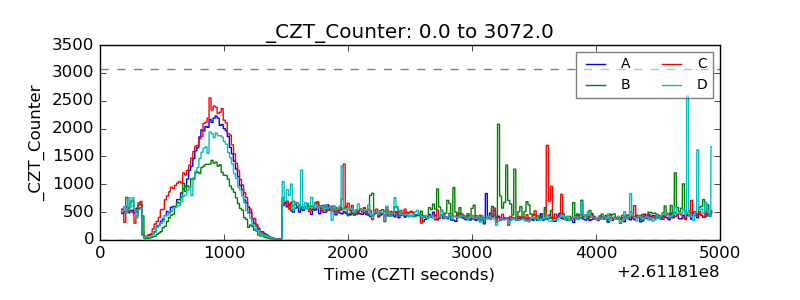 |
| +2.5 Volts monitor |  |
| +5 Volts monitor |  |
| _ROLL_ROT | 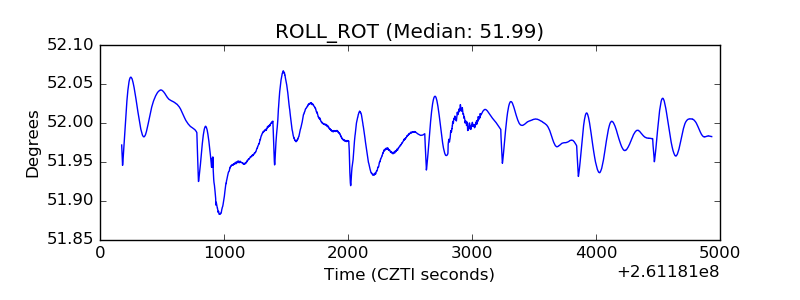 |
| _Roll_DEC | 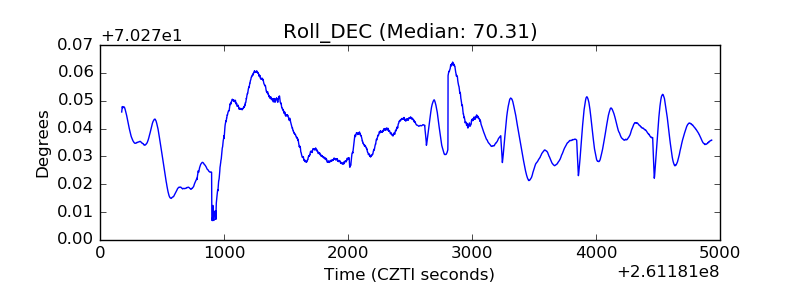 |
| _Roll_RA | 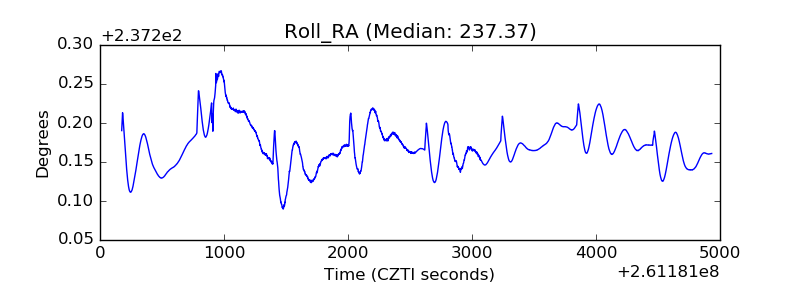 |
| Veto Counter | 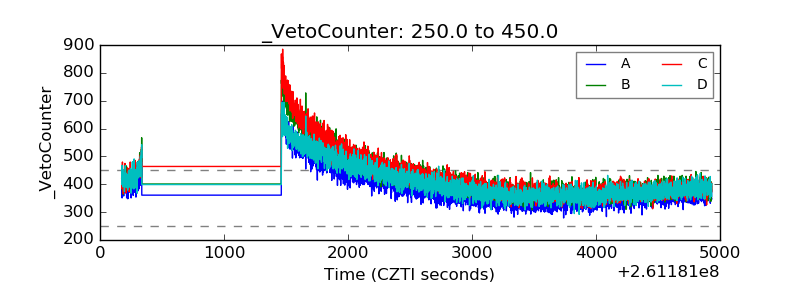 |