| Param | Original file | Final file |
|---|---|---|
| Filename | modeM0/AS1G08_039T01_9000002036_13724cztM0_level2.evt | modeM0/AS1G08_039T01_9000002036_13724cztM0_level2_quad_clean.evt |
| Size (bytes) | 203,235,840 | 44,550,720 |
| Size | 193.8 MB | 42.5 MB |
| Events in quadrant A | 1,410,482 | 290,103 |
| Events in quadrant B | 1,538,922 | 311,723 |
| Events in quadrant C | 1,456,769 | 280,604 |
| Events in quadrant D | 1,553,986 | 263,715 |
| Mode M0 | |||
|---|---|---|---|
| Quadrant | BADHDUFLAG | Total packets | Discarded packets |
| A | 0 | 5940 | 2 |
| B | 0 | 6203 | 1 |
| C | 0 | 5986 | 1 |
| D | 0 | 6419 | 1 |
| Mode SS | |||
|---|---|---|---|
| Quadrant | BADHDUFLAG | Total packets | Discarded packets |
| A | 0 | 58 | 0 |
| B | 0 | 58 | 0 |
| C | 0 | 58 | 0 |
| D | 0 | 58 | 0 |
| Mode M9 | |||
|---|---|---|---|
| Quadrant | BADHDUFLAG | Total packets | Discarded packets |
| A | 0 | 8 | 0 |
| B | 0 | 8 | 0 |
| C | 0 | 8 | 0 |
| D | 0 | 8 | 0 |
| Quadrant | Total seconds | Saturated seconds | Saturation percentage |
|---|---|---|---|
| A | 2839 | 97 | 3.416696% |
| B | 2839 | 104 | 3.663262% |
| C | 2839 | 84 | 2.958788% |
| D | 2839 | 91 | 3.205354% |
Noise dominated data is calculated using 1-second bins in cleaned event files. If a bin has >2000 counts, and if more than 50% of those come from <1% of pixels, then it is considered to be noise-dominated and hence unusable.
| Quadrant | # 1 sec bins | Bins with >0 counts | Bins with >2000 counts | High rate bins dominated by noise | Noise dominated (total time) | Noise dominated (detector-on time) | Marked lightcurve |
|---|---|---|---|---|---|---|---|
| A | 3640 | 2841 | 0 | 0 | 0.00% | 0.00% | 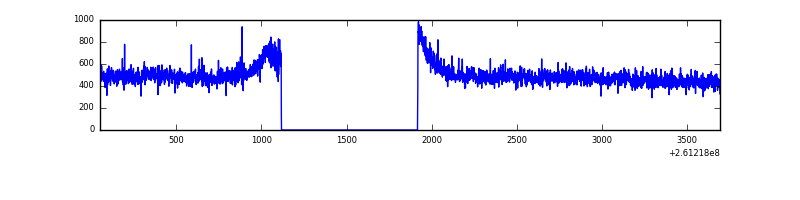 |
| B | 3640 | 2841 | 2 | 2 | 0.05% | 0.07% | 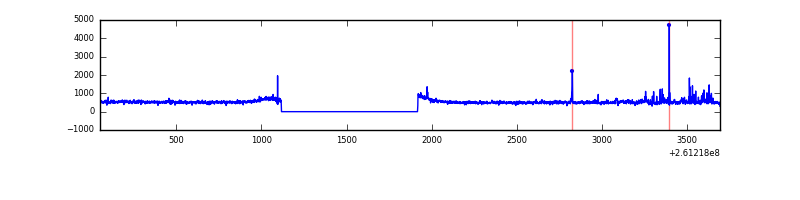 |
| C | 3640 | 2841 | 0 | 0 | 0.00% | 0.00% | 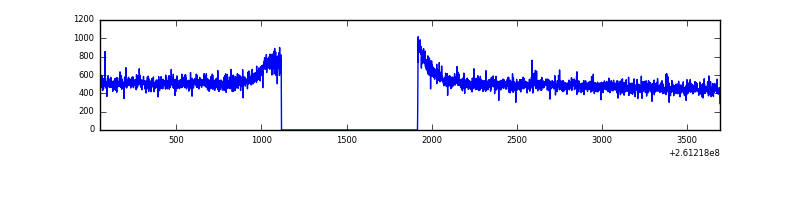 |
| D | 3640 | 2841 | 7 | 7 | 0.19% | 0.25% | 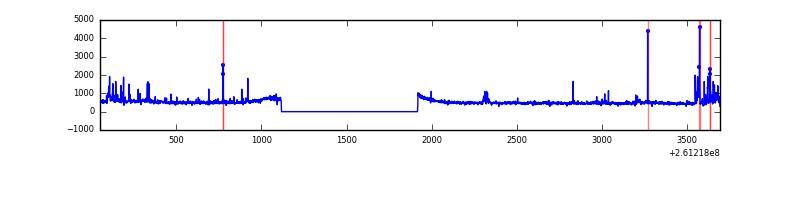 |
Top three noisy pixels from each quadrant. If the there are fewer than three noisy pixels in the level2.evt file, extra rows are filled as -1
| Pixel properties | Quadrant properties | ||||||
|---|---|---|---|---|---|---|---|
| Quadrant | DetID | PixID | Counts | Sigma | Mean | Median | Sigma |
| A | 1 | 162 | 3558 | 42.2 | 365 | 356 | 75.9 |
| A | 0 | 226 | 3207 | 37.57 | 365 | 356 | 75.9 |
| A | 12 | 194 | 2742 | 31.44 | 365 | 356 | 75.9 |
| B | 10 | 244 | 24460 | 333.1 | 369 | 360 | 72.4 |
| B | 3 | 64 | 19516 | 264.77 | 369 | 360 | 72.4 |
| B | 4 | 173 | 18263 | 247.45 | 369 | 360 | 72.4 |
| C | 3 | 233 | 65527 | 771.75 | 356 | 358 | 84.4 |
| C | 13 | 61 | 2526 | 25.67 | 356 | 358 | 84.4 |
| C | 14 | 234 | 2245 | 22.35 | 356 | 358 | 84.4 |
| D | 5 | 222 | 111264 | 1265.25 | 354 | 342 | 87.7 |
| D | 1 | 52 | 30857 | 348.07 | 354 | 342 | 87.7 |
| D | 8 | 195 | 26909 | 303.04 | 354 | 342 | 87.7 |
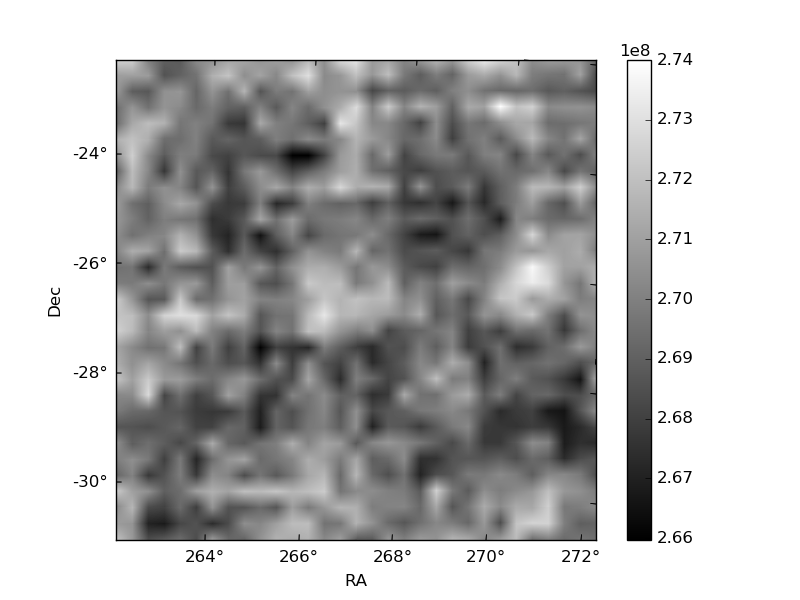
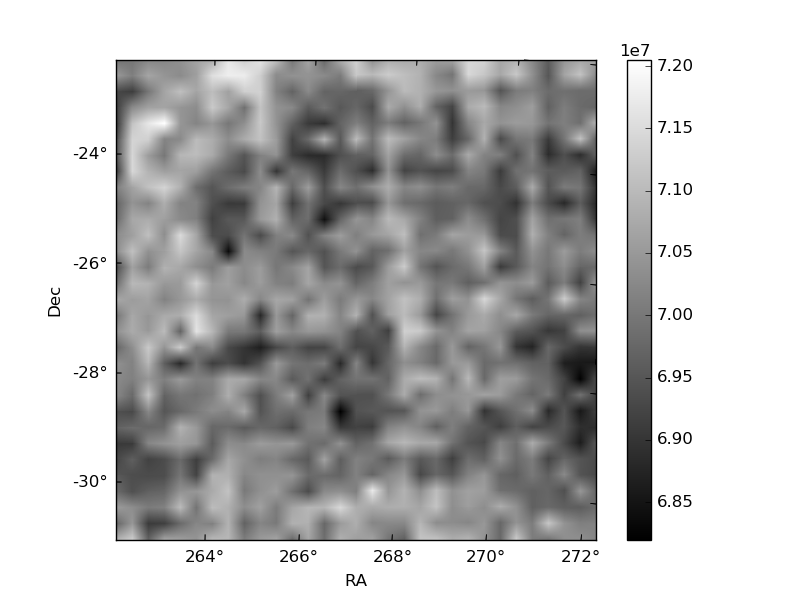
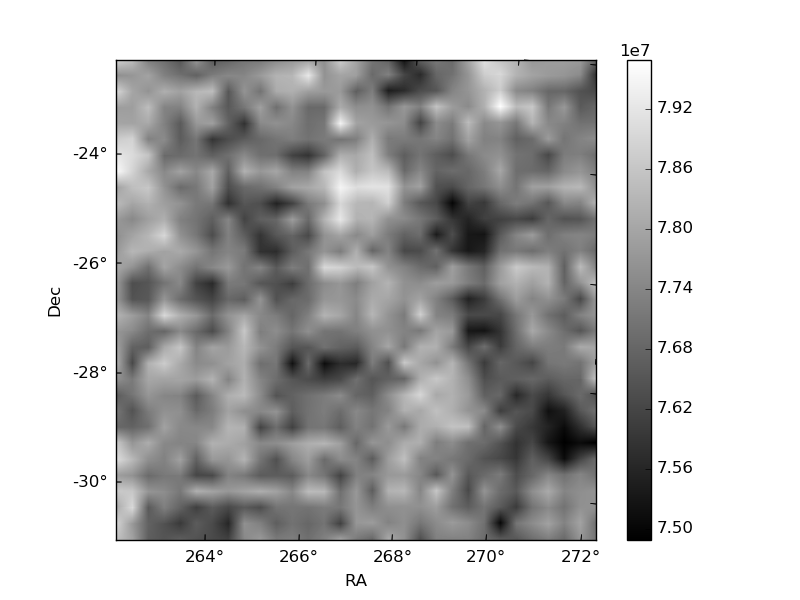
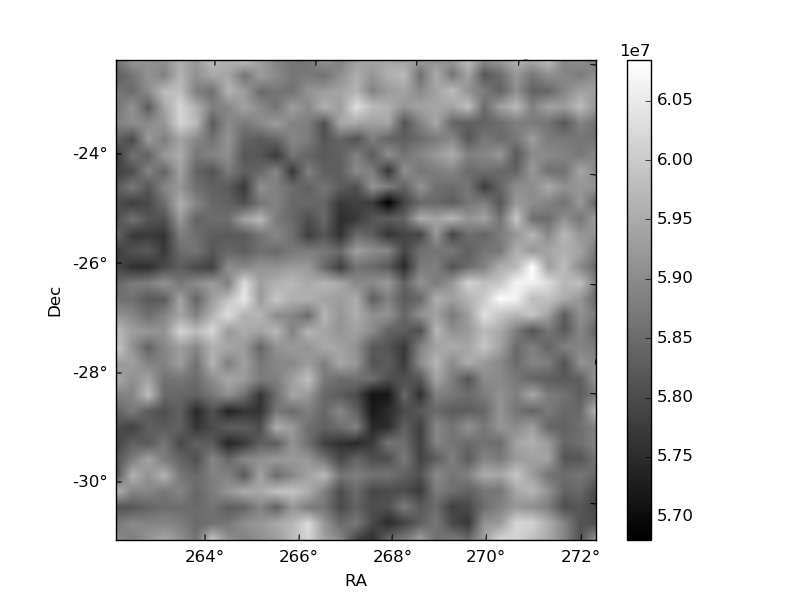
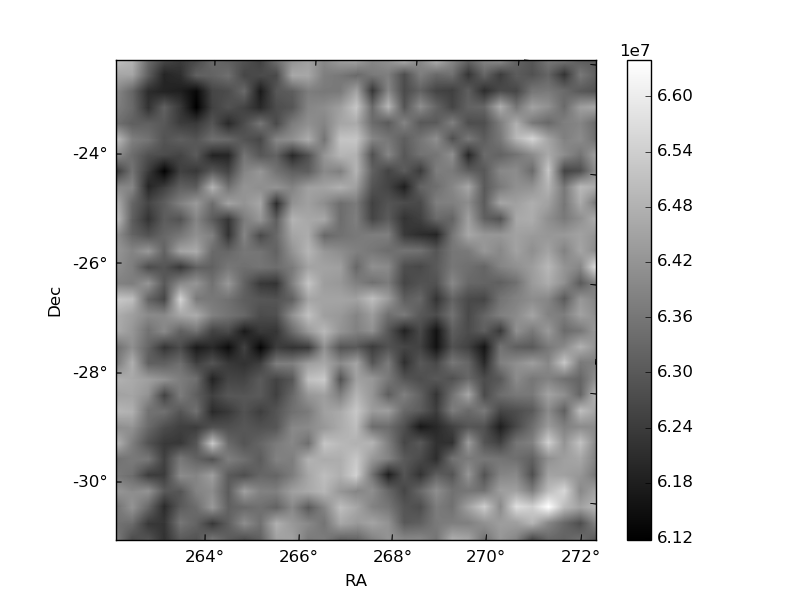
Histogram calculated using DETX and DETY for each event in the final _common_clean file
| Quadrant A | 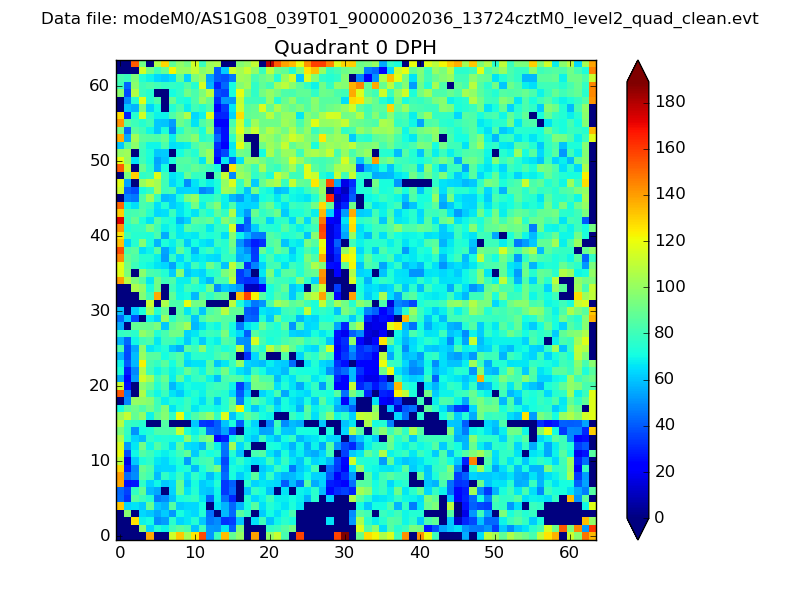 |
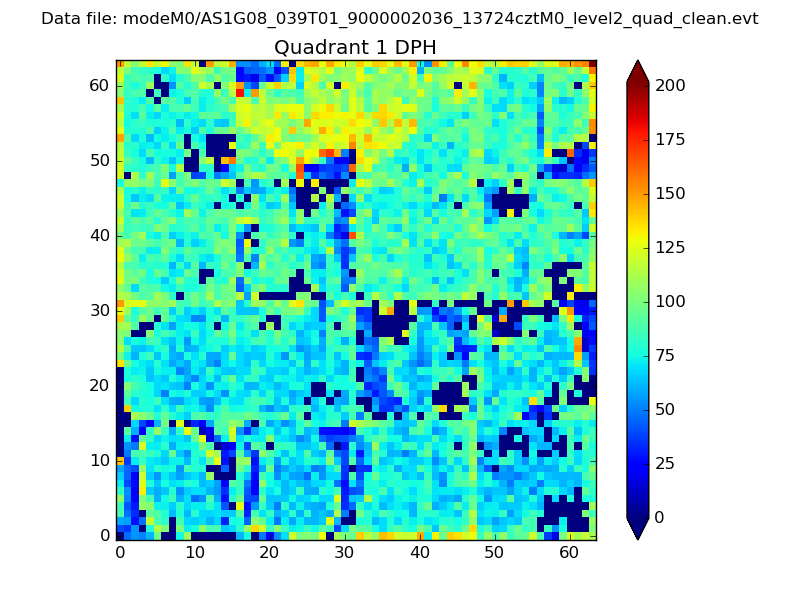 |
Quadrant B |
|---|---|---|---|
| Quadrant D | 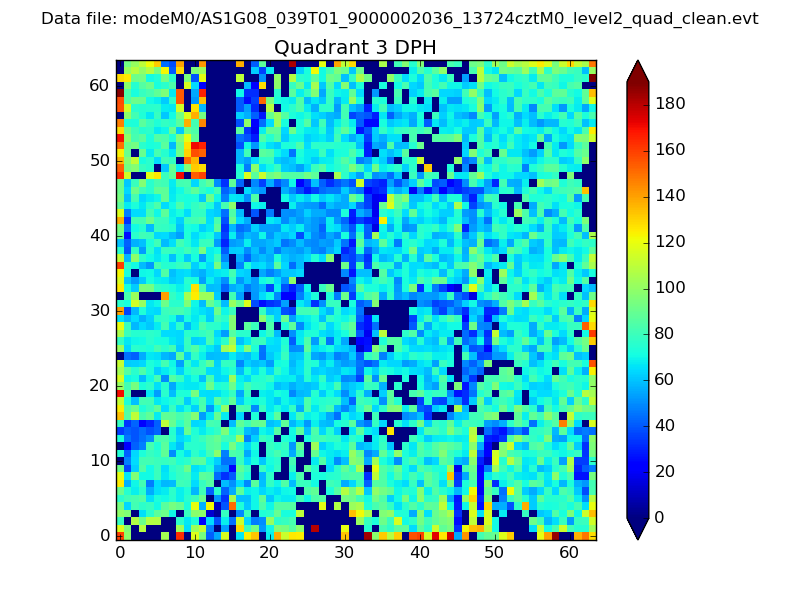 |
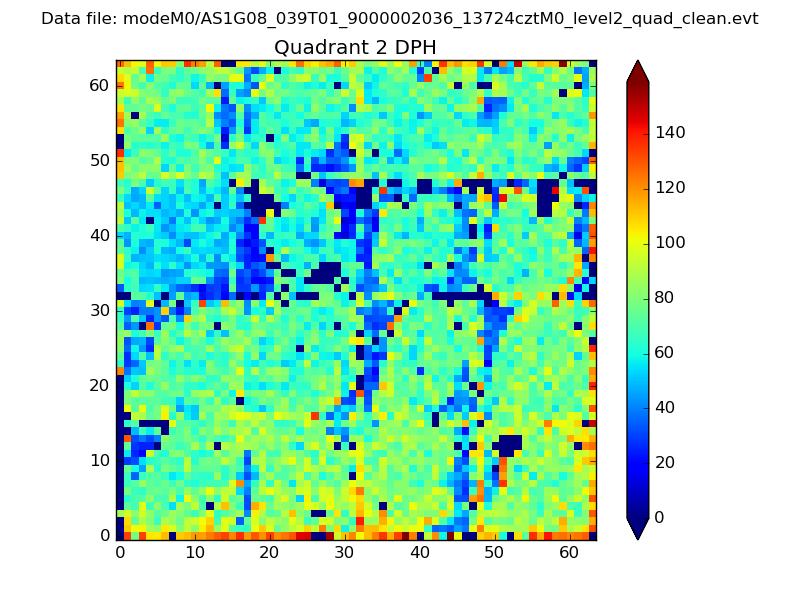 |
Quadrant C |
| Plot type | Count rate plots | Images |
|---|---|---|
| Comparison with Poisson distribution Blue bars denote a histogram of data divided into 1 sec bins. Red curve is a Poisson curve with rate = median count rate of data. |
 |
 |
| Quadrant-wise count rates Data is divided into 100 sec bins |
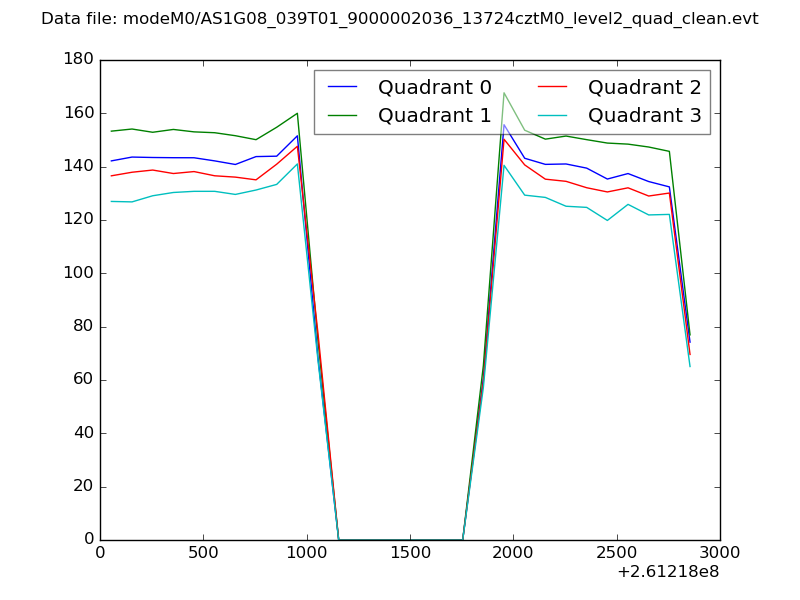 |
|
| Module-wise count rates for Quadrant A Data is divided into 100 sec bins |
 |
 |
| Module-wise count rates for Quadrant B Data is divided into 100 sec bins |
 |
 |
| Module-wise count rates for Quadrant C Data is divided into 100 sec bins |
 |
 |
| Module-wise count rates for Quadrant D Data is divided into 100 sec bins |
 |
 |
| Parameter | Plot |
|---|---|
| CZT HV Monitor |  |
| D_VDD | 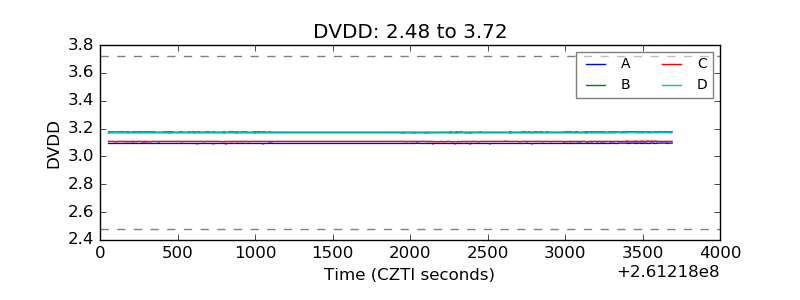 |
| Temperature 1 | 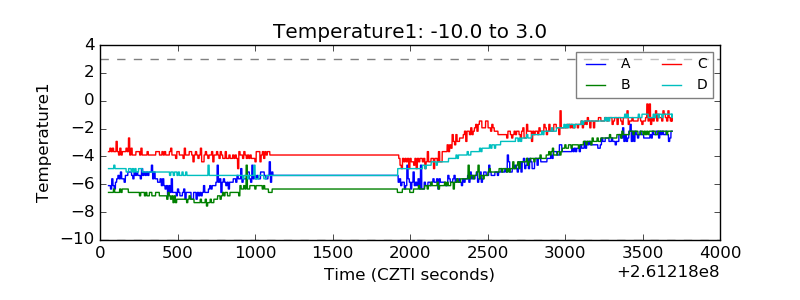 |
| Veto HV Monitor | 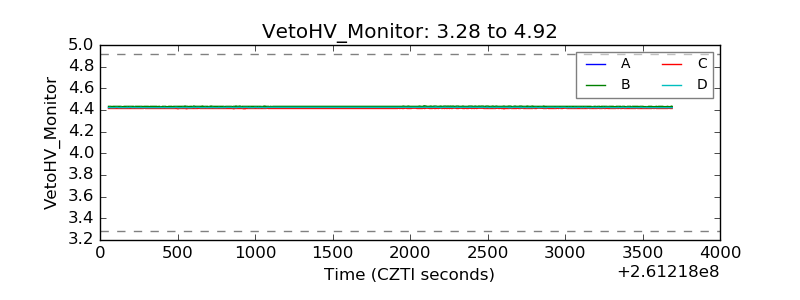 |
| Veto LLD |  |
| Alpha Counter | 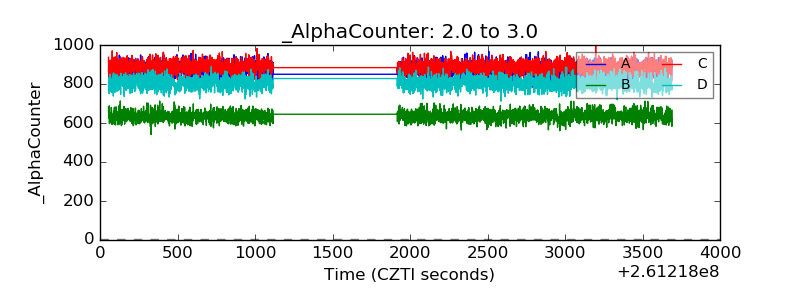 |
| _CPM_Rate | 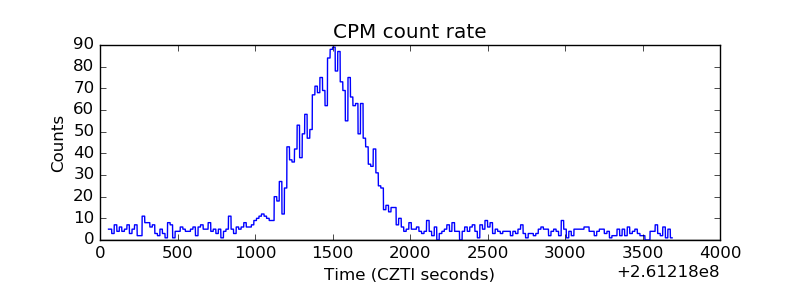 |
| CZT Counter | 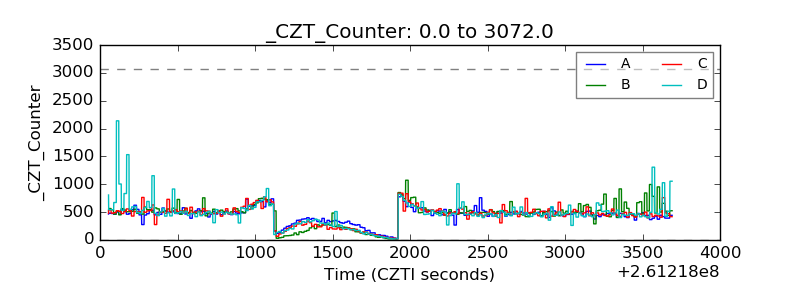 |
| +2.5 Volts monitor |  |
| +5 Volts monitor |  |
| _ROLL_ROT | 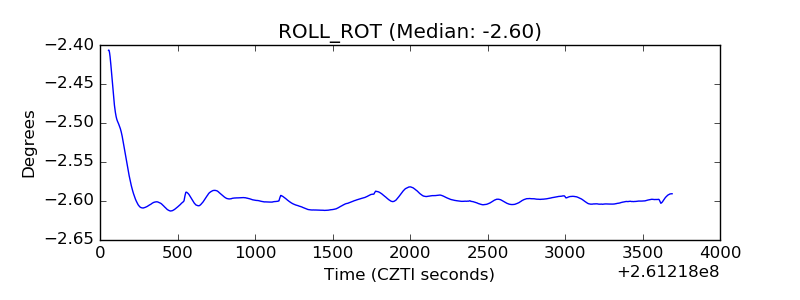 |
| _Roll_DEC | 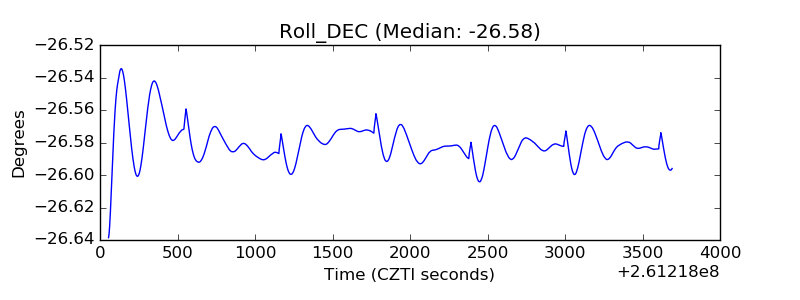 |
| _Roll_RA | 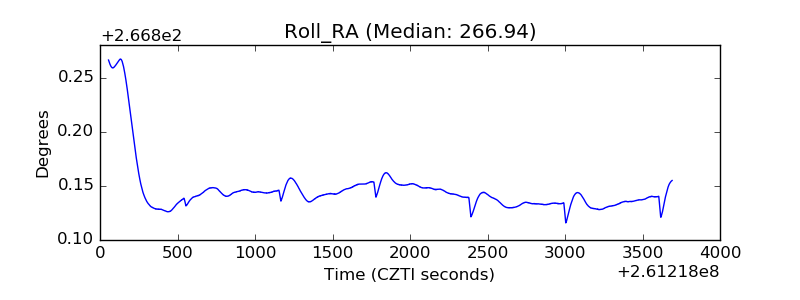 |
| Veto Counter | 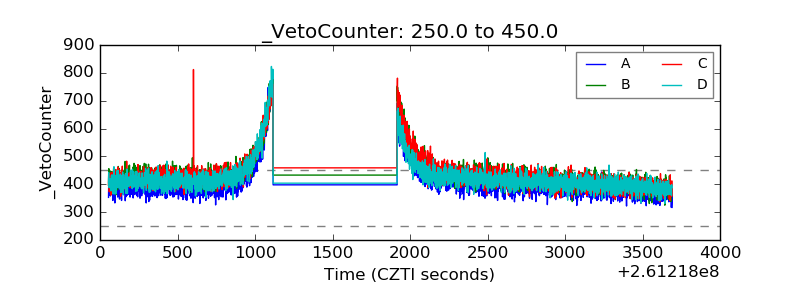 |