| Param | Original file | Final file |
|---|---|---|
| Filename | modeM0/AS1G08_039T01_9000002036_13725cztM0_level2.evt | modeM0/AS1G08_039T01_9000002036_13725cztM0_level2_quad_clean.evt |
| Size (bytes) | 507,931,200 | 86,368,320 |
| Size | 484.4 MB | 82.4 MB |
| Events in quadrant A | 3,470,969 | 535,633 |
| Events in quadrant B | 4,003,749 | 570,493 |
| Events in quadrant C | 3,557,245 | 517,526 |
| Events in quadrant D | 3,862,056 | 490,569 |
| Mode M0 | |||
|---|---|---|---|
| Quadrant | BADHDUFLAG | Total packets | Discarded packets |
| A | 0 | 14915 | 2 |
| B | 0 | 16225 | 1 |
| C | 0 | 15024 | 1 |
| D | 0 | 16144 | 1 |
| Mode SS | |||
|---|---|---|---|
| Quadrant | BADHDUFLAG | Total packets | Discarded packets |
| A | 0 | 146 | 0 |
| B | 0 | 146 | 0 |
| C | 0 | 146 | 0 |
| D | 0 | 146 | 0 |
| Mode M9 | |||
|---|---|---|---|
| Quadrant | BADHDUFLAG | Total packets | Discarded packets |
| A | 0 | 3 | 0 |
| B | 0 | 3 | 0 |
| C | 0 | 3 | 0 |
| D | 0 | 3 | 0 |
| Quadrant | Total seconds | Saturated seconds | Saturation percentage |
|---|---|---|---|
| A | 7195 | 170 | 2.362752% |
| B | 7195 | 190 | 2.640723% |
| C | 7195 | 109 | 1.514941% |
| D | 7195 | 152 | 2.112578% |
Noise dominated data is calculated using 1-second bins in cleaned event files. If a bin has >2000 counts, and if more than 50% of those come from <1% of pixels, then it is considered to be noise-dominated and hence unusable.
| Quadrant | # 1 sec bins | Bins with >0 counts | Bins with >2000 counts | High rate bins dominated by noise | Noise dominated (total time) | Noise dominated (detector-on time) | Marked lightcurve |
|---|---|---|---|---|---|---|---|
| A | 7531 | 7197 | 0 | 0 | 0.00% | 0.00% | 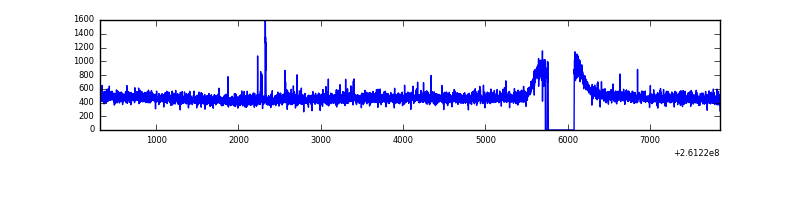 |
| B | 7531 | 7198 | 9 | 9 | 0.12% | 0.13% | 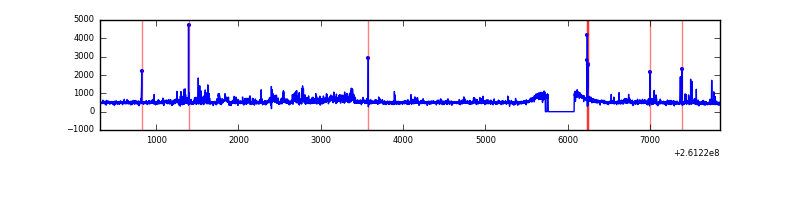 |
| C | 7531 | 7198 | 0 | 0 | 0.00% | 0.00% | 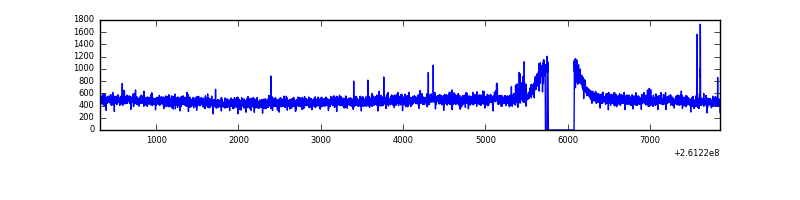 |
| D | 7531 | 7198 | 26 | 26 | 0.35% | 0.36% | 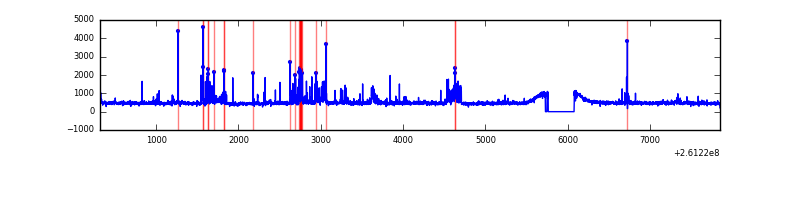 |
Top three noisy pixels from each quadrant. If the there are fewer than three noisy pixels in the level2.evt file, extra rows are filled as -1
| Pixel properties | Quadrant properties | ||||||
|---|---|---|---|---|---|---|---|
| Quadrant | DetID | PixID | Counts | Sigma | Mean | Median | Sigma |
| A | 9 | 143 | 24219 | 126.52 | 893 | 872 | 184.5 |
| A | 1 | 162 | 10009 | 49.51 | 893 | 872 | 184.5 |
| A | 0 | 226 | 7953 | 38.37 | 893 | 872 | 184.5 |
| B | 10 | 244 | 228113 | 1320.37 | 896 | 874 | 172.1 |
| B | 4 | 173 | 69899 | 401.07 | 896 | 874 | 172.1 |
| B | 0 | 219 | 63801 | 365.64 | 896 | 874 | 172.1 |
| C | 3 | 233 | 149900 | 737.84 | 863 | 868 | 202.0 |
| C | 4 | 254 | 39306 | 190.3 | 863 | 868 | 202.0 |
| C | 13 | 61 | 6420 | 27.49 | 863 | 868 | 202.0 |
| D | 5 | 222 | 394581 | 1886.98 | 861 | 837 | 208.7 |
| D | 8 | 195 | 92746 | 440.46 | 861 | 837 | 208.7 |
| D | 13 | 249 | 71217 | 337.29 | 861 | 837 | 208.7 |
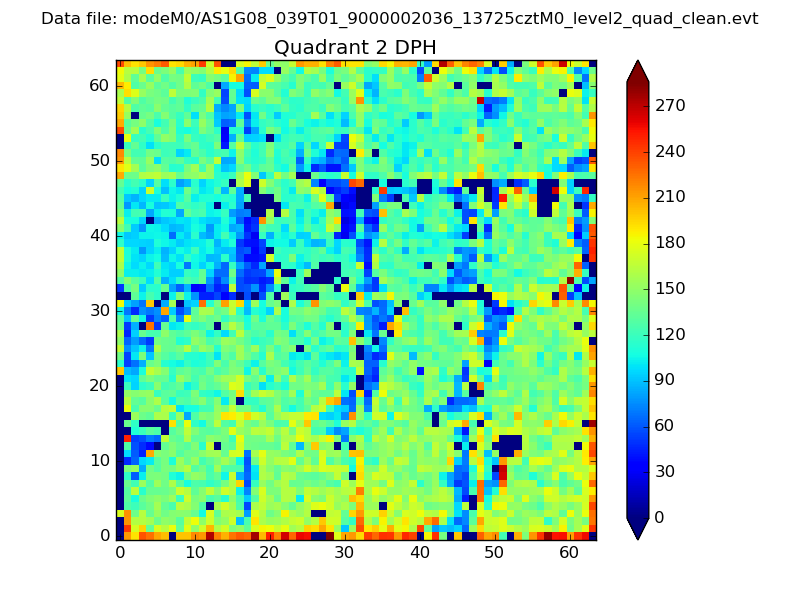
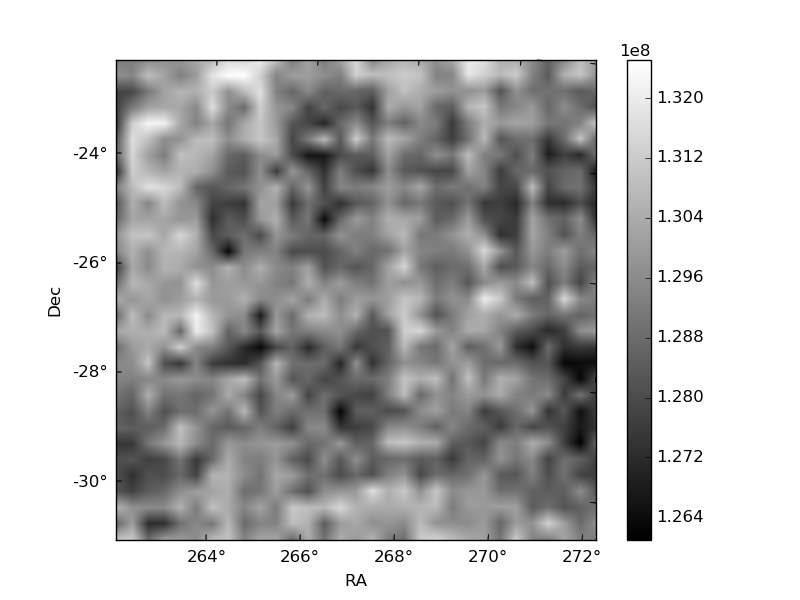
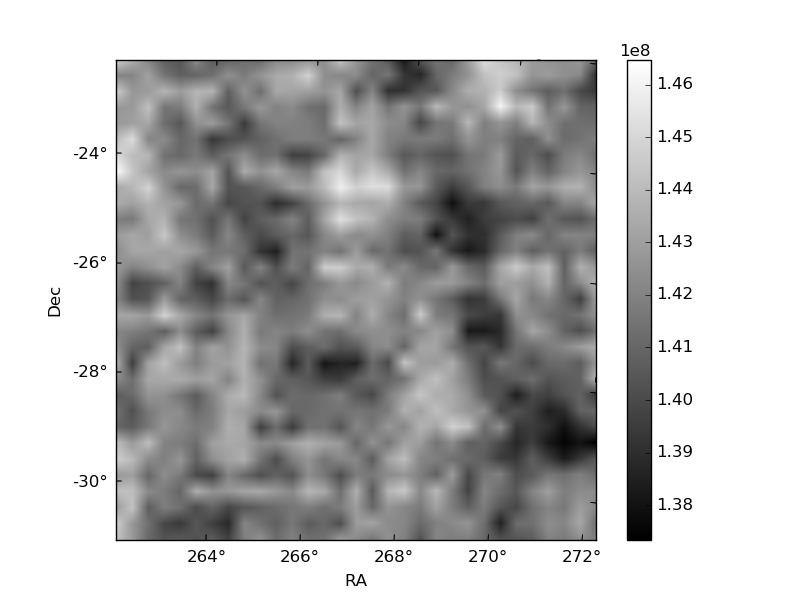
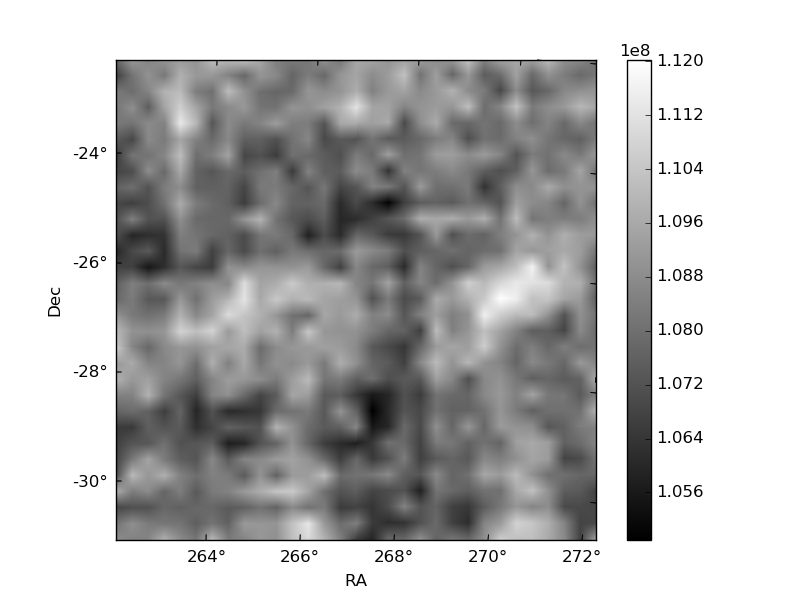
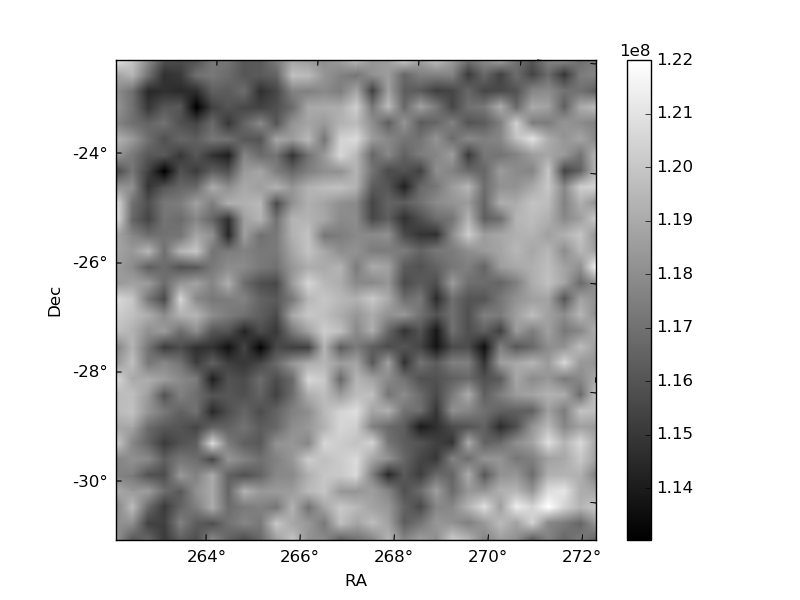
Histogram calculated using DETX and DETY for each event in the final _common_clean file
| Quadrant A |  |
 |
Quadrant B |
|---|---|---|---|
| Quadrant D | 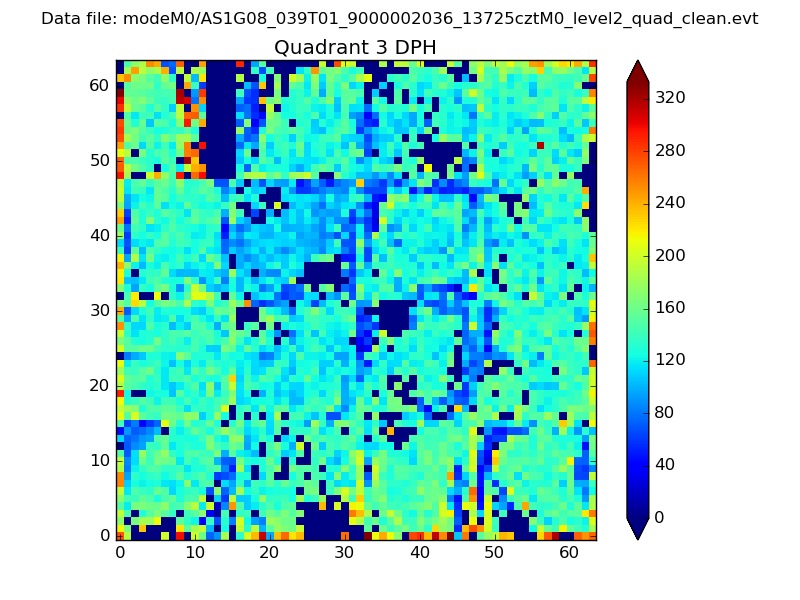 |
 |
Quadrant C |
| Plot type | Count rate plots | Images |
|---|---|---|
| Comparison with Poisson distribution Blue bars denote a histogram of data divided into 1 sec bins. Red curve is a Poisson curve with rate = median count rate of data. |
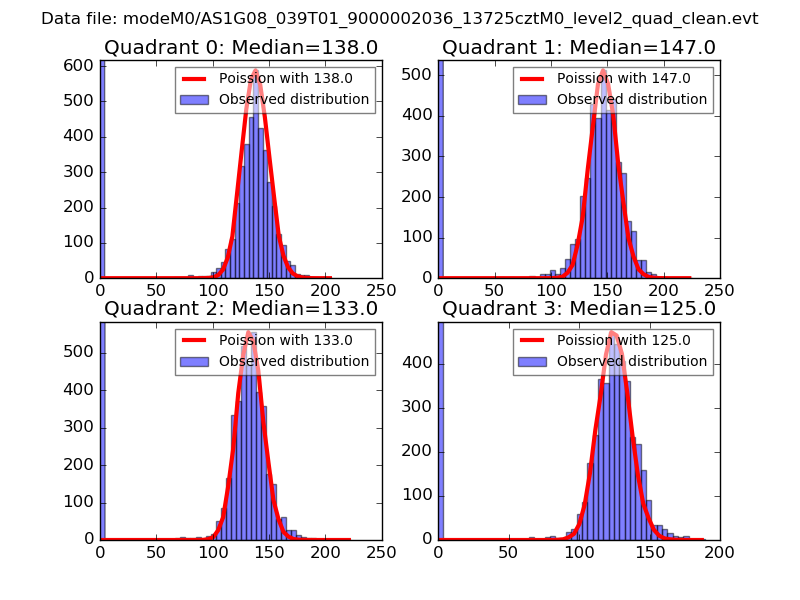 |
 |
| Quadrant-wise count rates Data is divided into 100 sec bins |
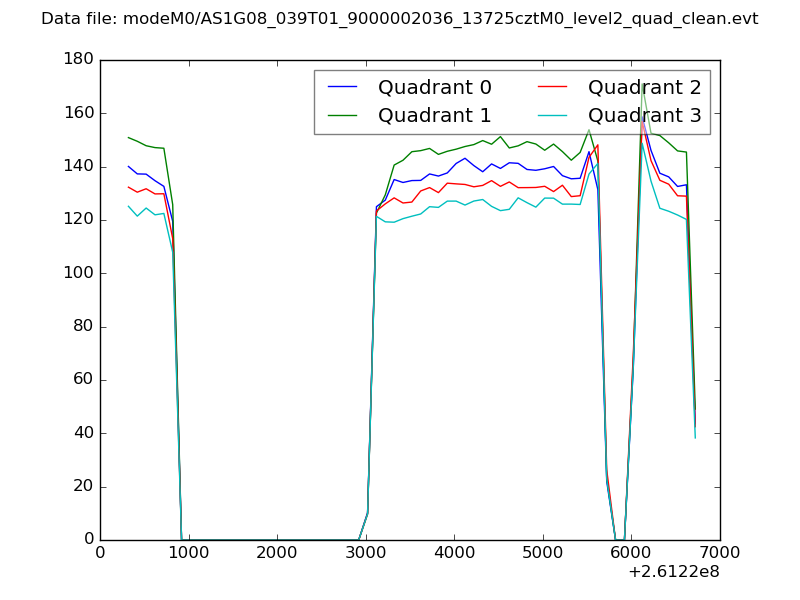 |
|
| Module-wise count rates for Quadrant A Data is divided into 100 sec bins |
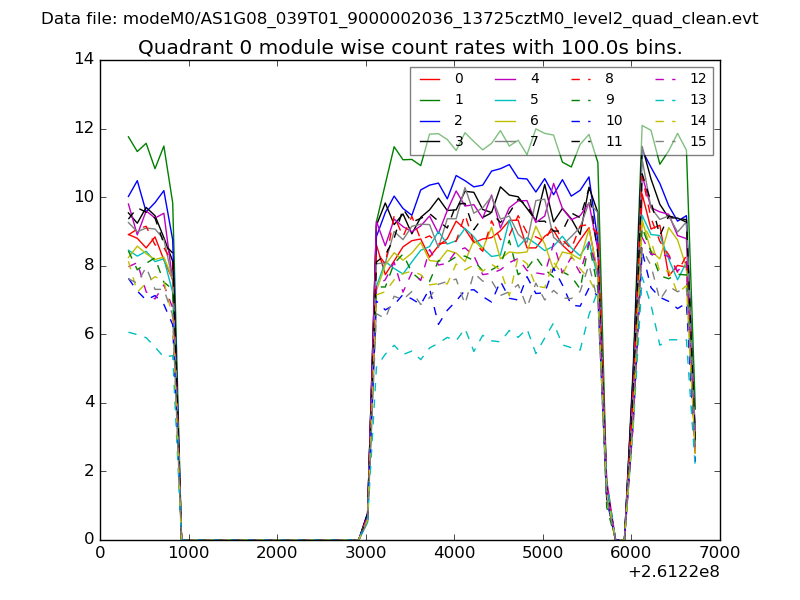 |
 |
| Module-wise count rates for Quadrant B Data is divided into 100 sec bins |
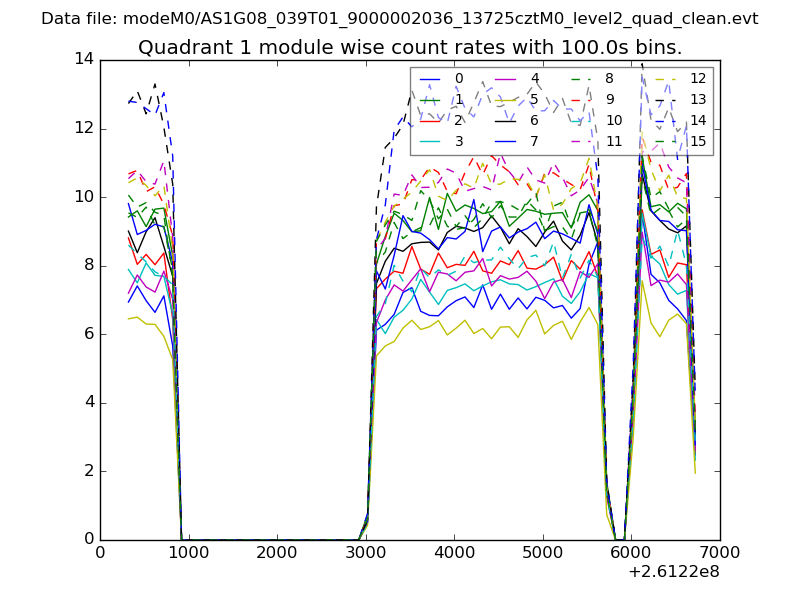 |
 |
| Module-wise count rates for Quadrant C Data is divided into 100 sec bins |
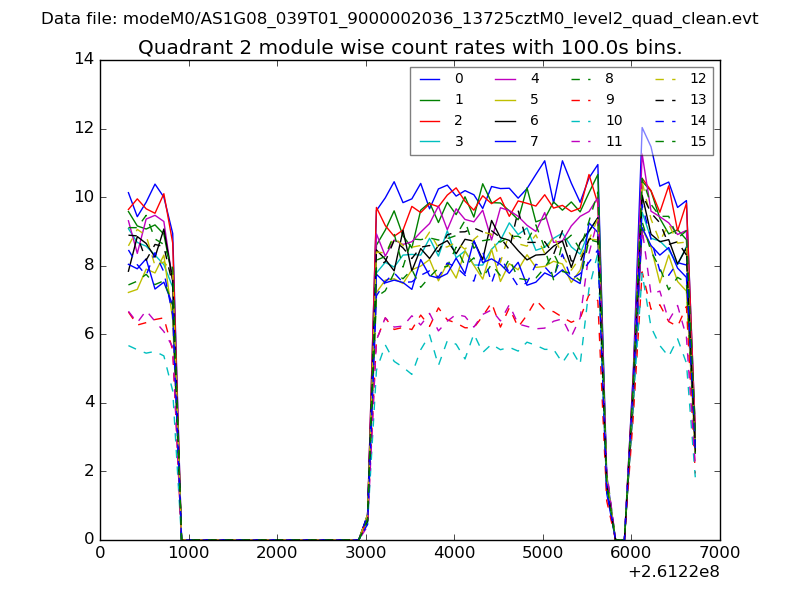 |
 |
| Module-wise count rates for Quadrant D Data is divided into 100 sec bins |
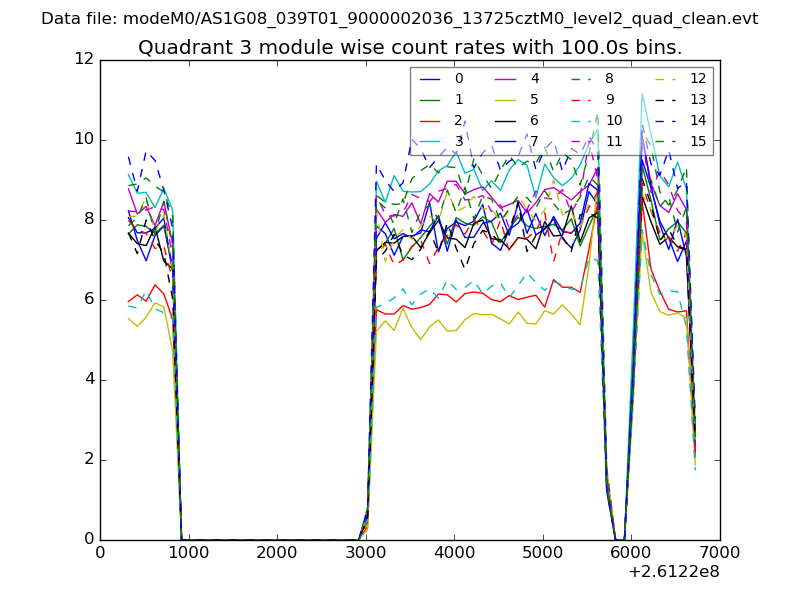 |
 |
| Parameter | Plot |
|---|---|
| CZT HV Monitor | 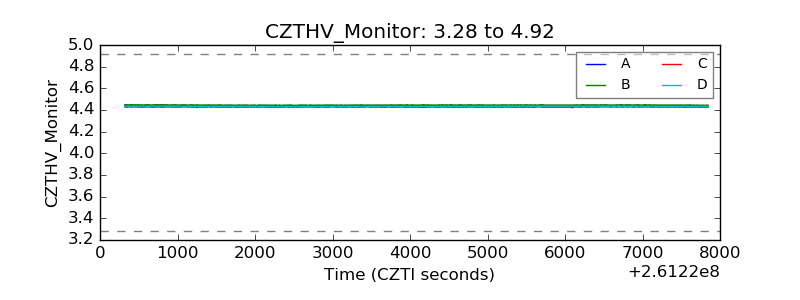 |
| D_VDD | 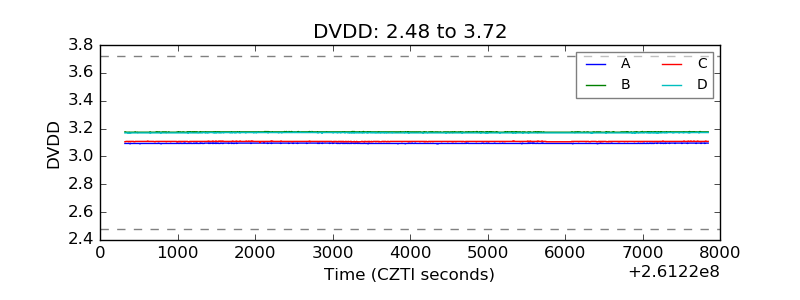 |
| Temperature 1 | 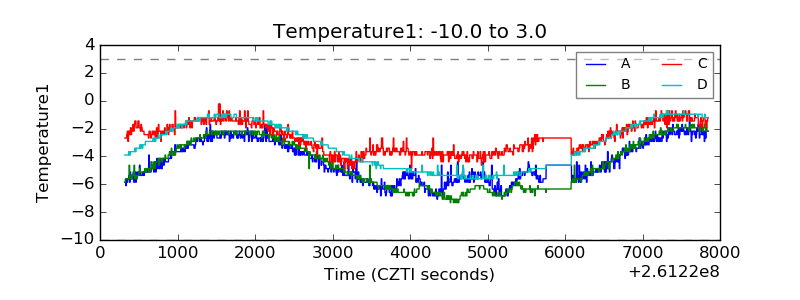 |
| Veto HV Monitor |  |
| Veto LLD | 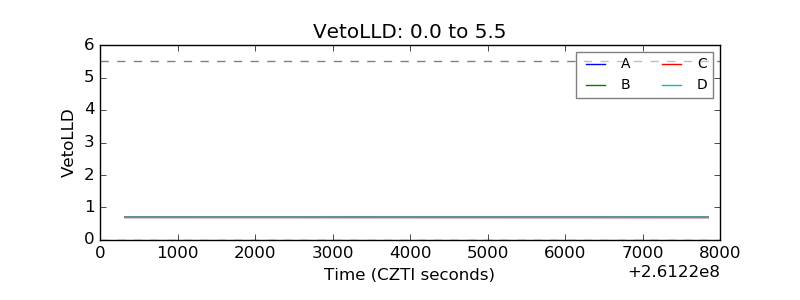 |
| Alpha Counter | 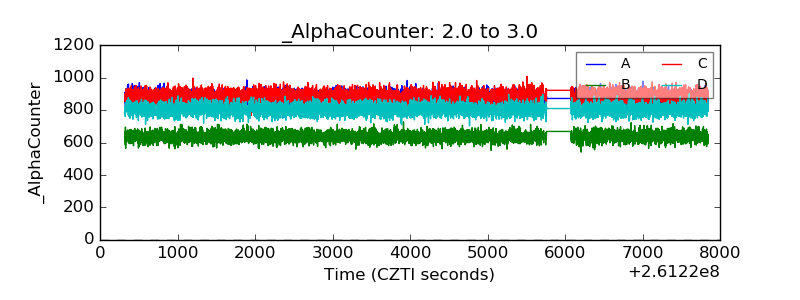 |
| _CPM_Rate | 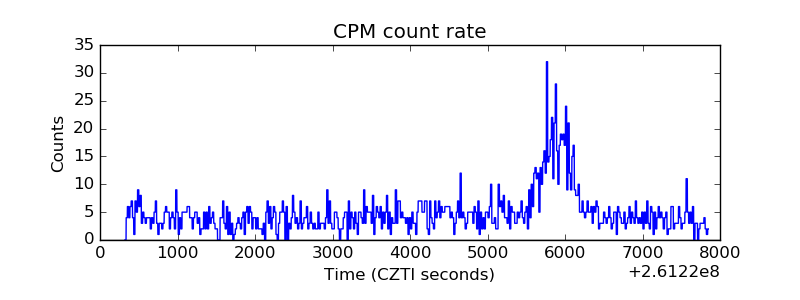 |
| CZT Counter | 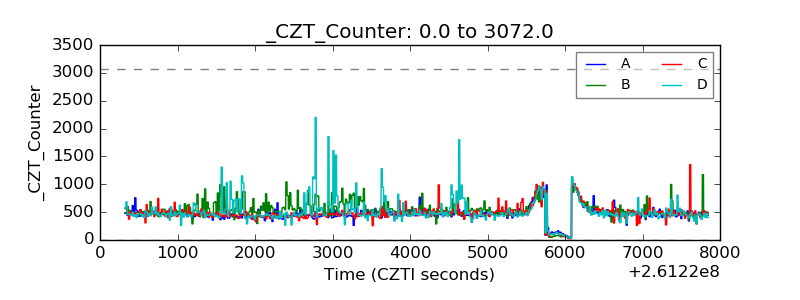 |
| +2.5 Volts monitor |  |
| +5 Volts monitor |  |
| _ROLL_ROT | 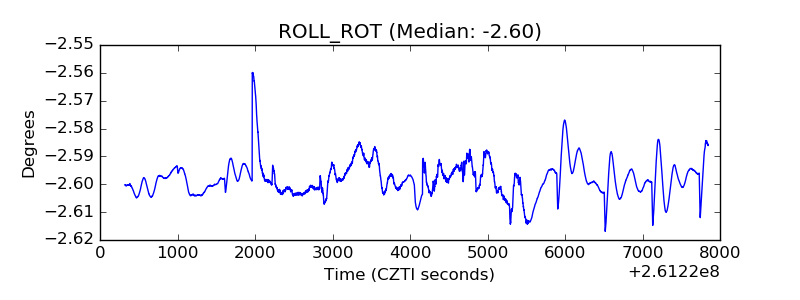 |
| _Roll_DEC | 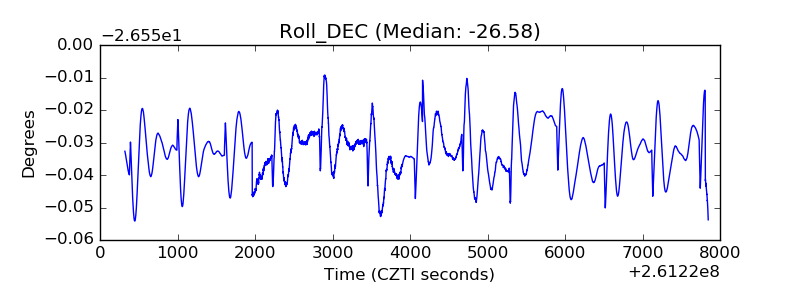 |
| _Roll_RA |  |
| Veto Counter | 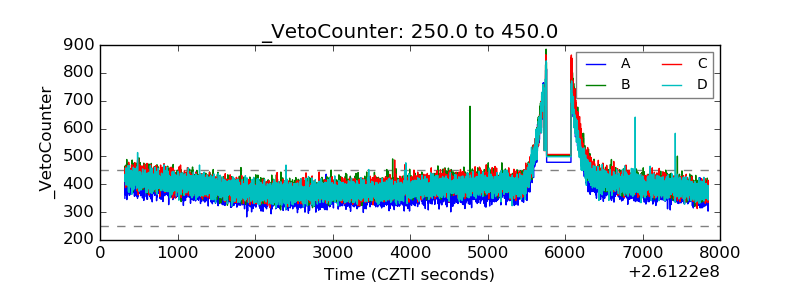 |