| Param | Original file | Final file |
|---|---|---|
| Filename | modeM0/AS1G08_039T01_9000002036_13726cztM0_level2.evt | modeM0/AS1G08_039T01_9000002036_13726cztM0_level2_quad_clean.evt |
| Size (bytes) | 541,388,160 | 87,390,720 |
| Size | 516.3 MB | 83.3 MB |
| Events in quadrant A | 3,764,448 | 532,997 |
| Events in quadrant B | 4,264,914 | 568,733 |
| Events in quadrant C | 3,937,238 | 519,979 |
| Events in quadrant D | 3,910,886 | 493,185 |
| Mode M0 | |||
|---|---|---|---|
| Quadrant | BADHDUFLAG | Total packets | Discarded packets |
| A | 0 | 16179 | 1 |
| B | 0 | 17391 | 0 |
| C | 0 | 16401 | 0 |
| D | 0 | 16684 | 0 |
| Mode SS | |||
|---|---|---|---|
| Quadrant | BADHDUFLAG | Total packets | Discarded packets |
| A | 0 | 154 | 0 |
| B | 0 | 154 | 0 |
| C | 0 | 154 | 0 |
| D | 0 | 154 | 0 |
| Quadrant | Total seconds | Saturated seconds | Saturation percentage |
|---|---|---|---|
| A | 7629 | 297 | 3.893040% |
| B | 7629 | 323 | 4.233845% |
| C | 7629 | 219 | 2.870625% |
| D | 7629 | 244 | 3.198322% |
Noise dominated data is calculated using 1-second bins in cleaned event files. If a bin has >2000 counts, and if more than 50% of those come from <1% of pixels, then it is considered to be noise-dominated and hence unusable.
| Quadrant | # 1 sec bins | Bins with >0 counts | Bins with >2000 counts | High rate bins dominated by noise | Noise dominated (total time) | Noise dominated (detector-on time) | Marked lightcurve |
|---|---|---|---|---|---|---|---|
| A | 7630 | 7630 | 2 | 2 | 0.03% | 0.03% | 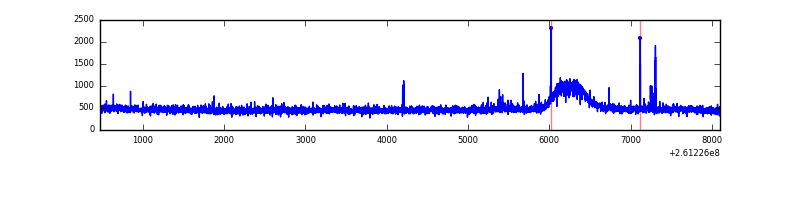 |
| B | 7630 | 7630 | 7 | 7 | 0.09% | 0.09% | 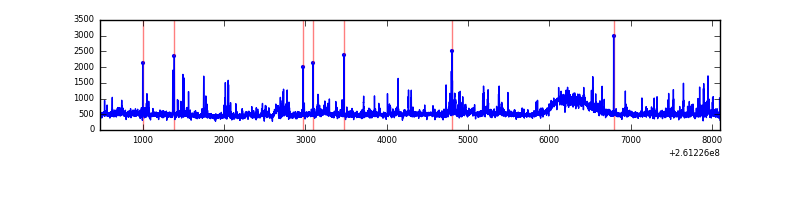 |
| C | 7630 | 7630 | 8 | 8 | 0.10% | 0.10% | 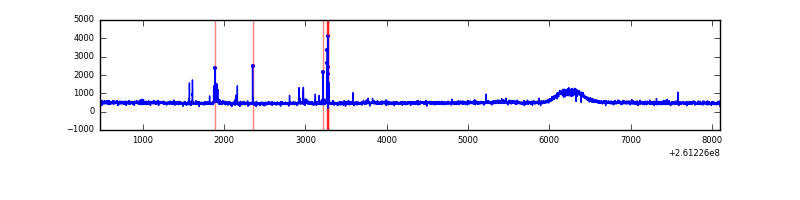 |
| D | 7630 | 7630 | 12 | 12 | 0.16% | 0.16% | 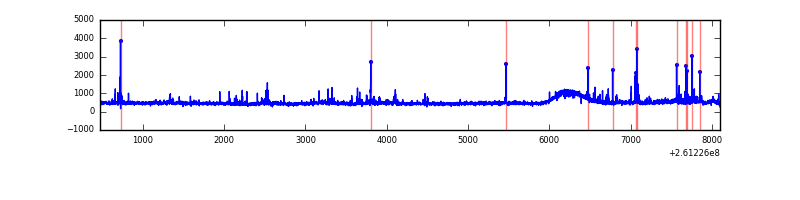 |
Top three noisy pixels from each quadrant. If the there are fewer than three noisy pixels in the level2.evt file, extra rows are filled as -1
| Pixel properties | Quadrant properties | ||||||
|---|---|---|---|---|---|---|---|
| Quadrant | DetID | PixID | Counts | Sigma | Mean | Median | Sigma |
| A | 9 | 143 | 35875 | 176.16 | 962 | 940 | 198.3 |
| A | 1 | 162 | 16025 | 76.07 | 962 | 940 | 198.3 |
| A | 0 | 226 | 8417 | 37.7 | 962 | 940 | 198.3 |
| B | 8 | 250 | 129065 | 690.49 | 966 | 945 | 185.5 |
| B | 4 | 173 | 103601 | 553.25 | 966 | 945 | 185.5 |
| B | 4 | 48 | 70858 | 376.79 | 966 | 945 | 185.5 |
| C | 3 | 233 | 211088 | 962.79 | 933 | 940 | 218.3 |
| C | 4 | 254 | 85478 | 387.31 | 933 | 940 | 218.3 |
| C | 13 | 61 | 6927 | 27.43 | 933 | 940 | 218.3 |
| D | 8 | 195 | 115433 | 508.27 | 933 | 908 | 225.3 |
| D | 5 | 222 | 75101 | 329.27 | 933 | 908 | 225.3 |
| D | 1 | 52 | 62080 | 271.48 | 933 | 908 | 225.3 |
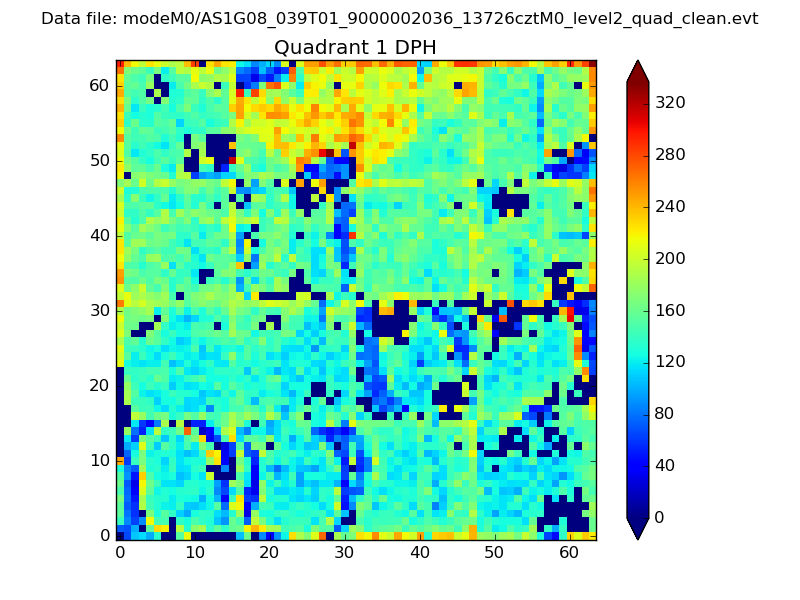
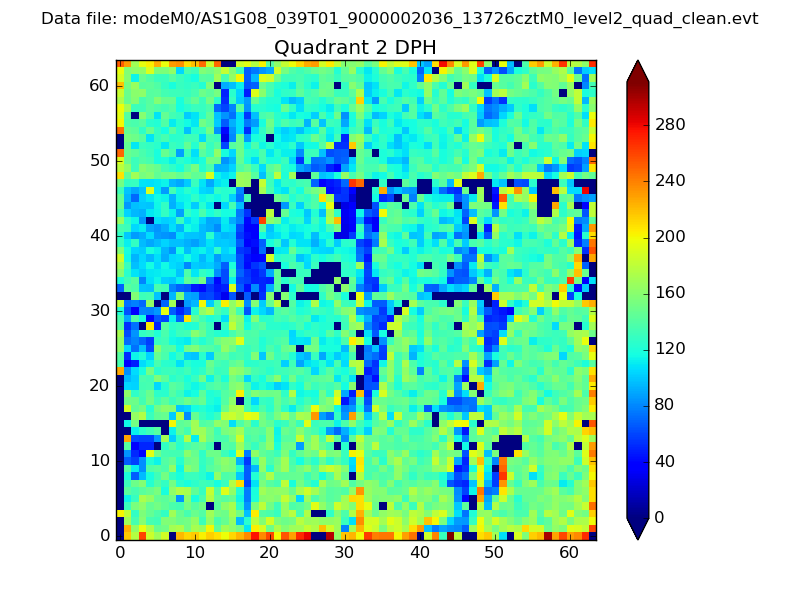
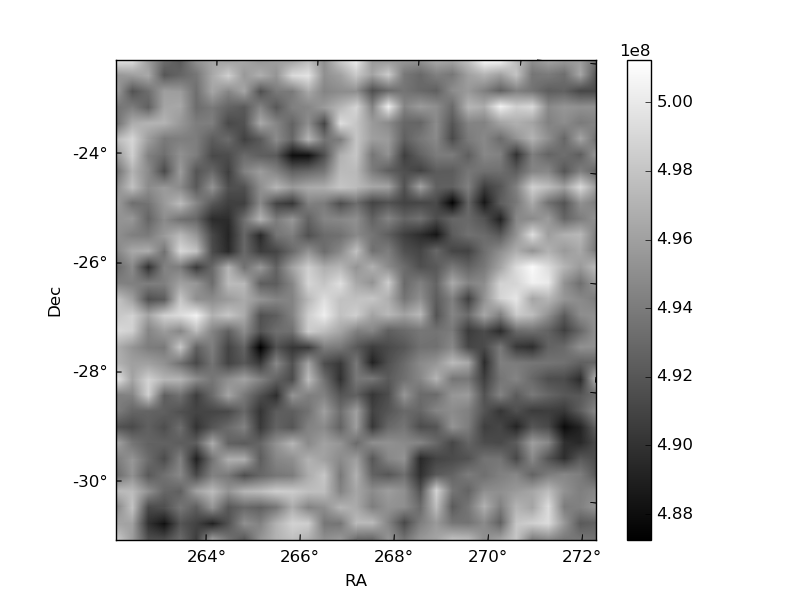
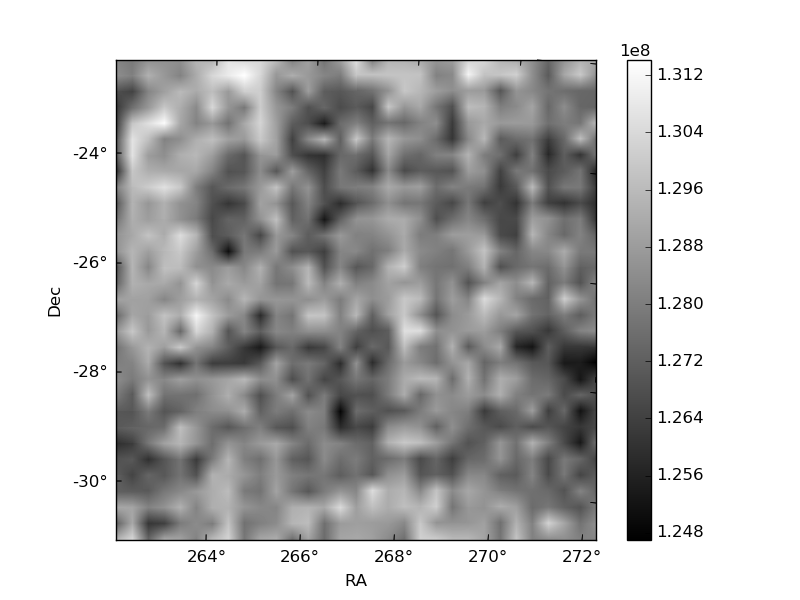
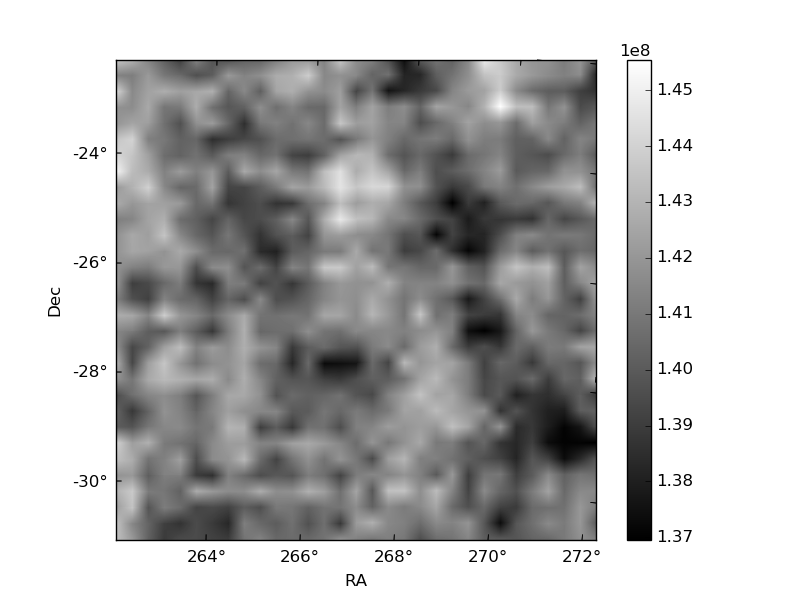
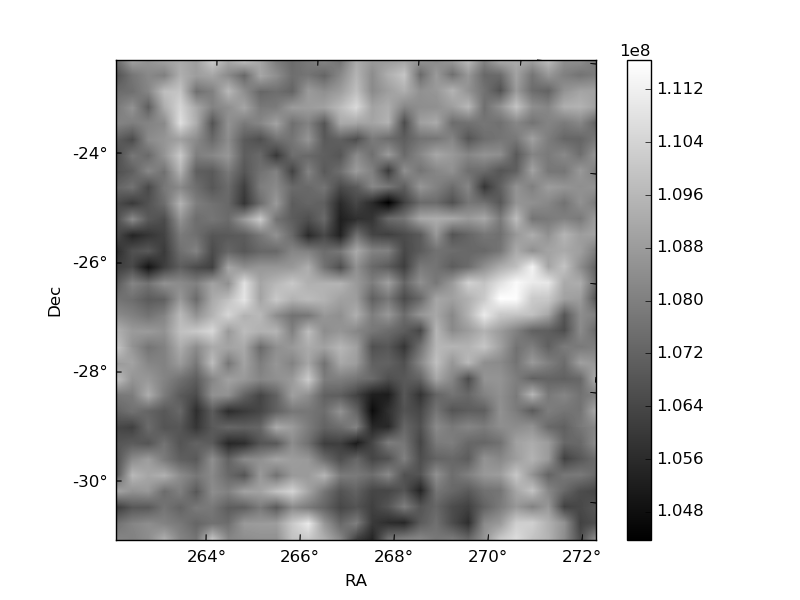
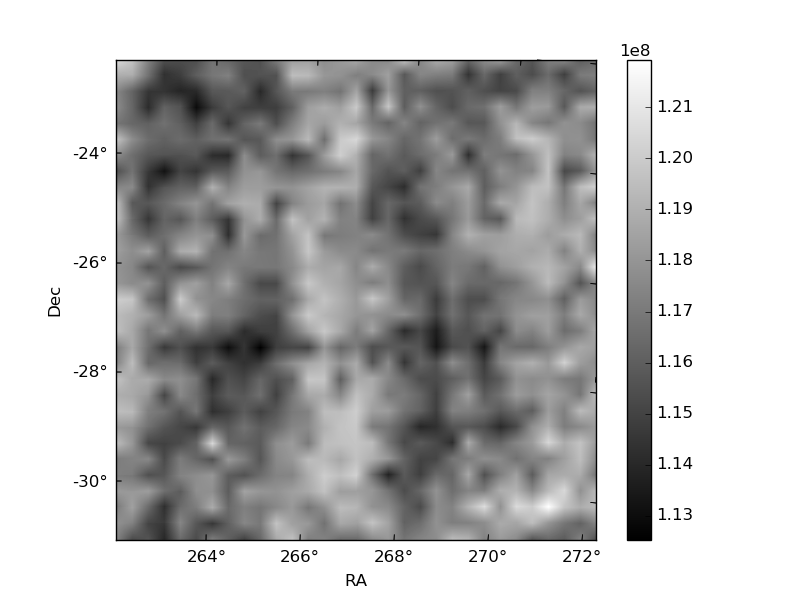
Histogram calculated using DETX and DETY for each event in the final _common_clean file
| Quadrant A |  |
 |
Quadrant B |
|---|---|---|---|
| Quadrant D | 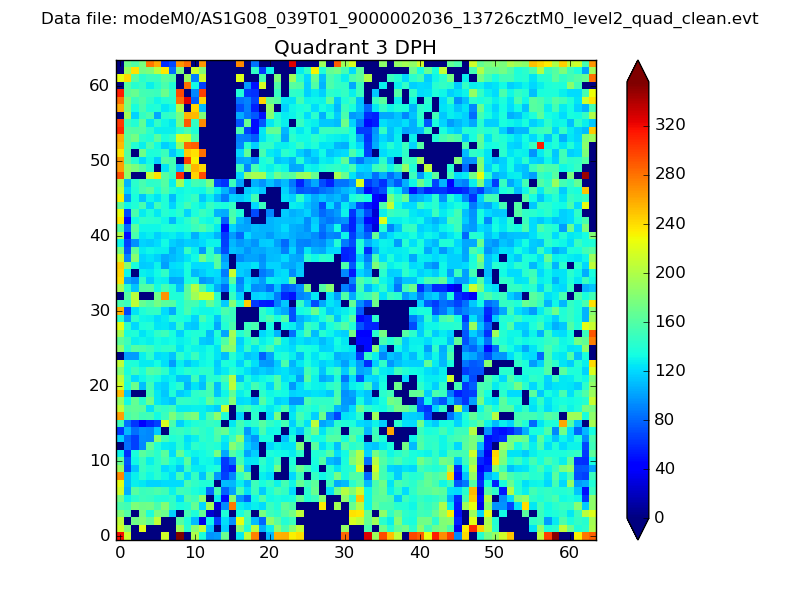 |
 |
Quadrant C |
| Plot type | Count rate plots | Images |
|---|---|---|
| Comparison with Poisson distribution Blue bars denote a histogram of data divided into 1 sec bins. Red curve is a Poisson curve with rate = median count rate of data. |
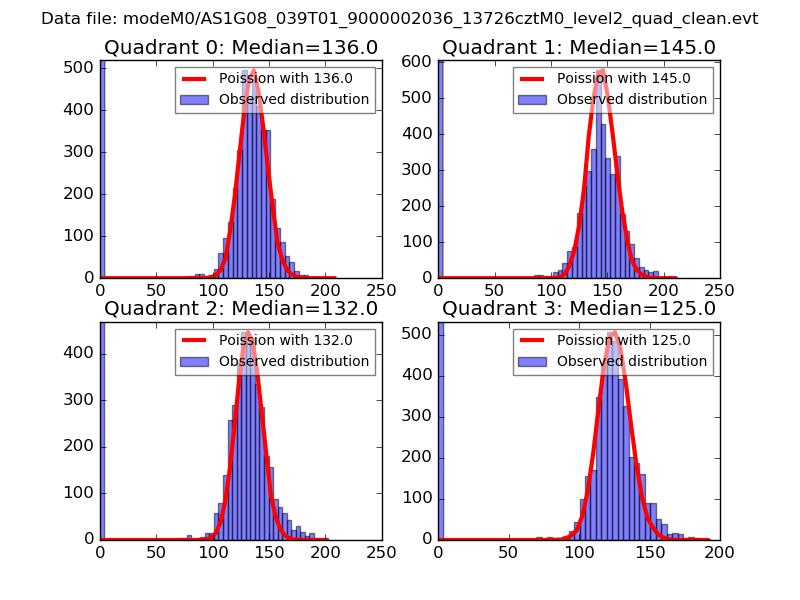 |
 |
| Quadrant-wise count rates Data is divided into 100 sec bins |
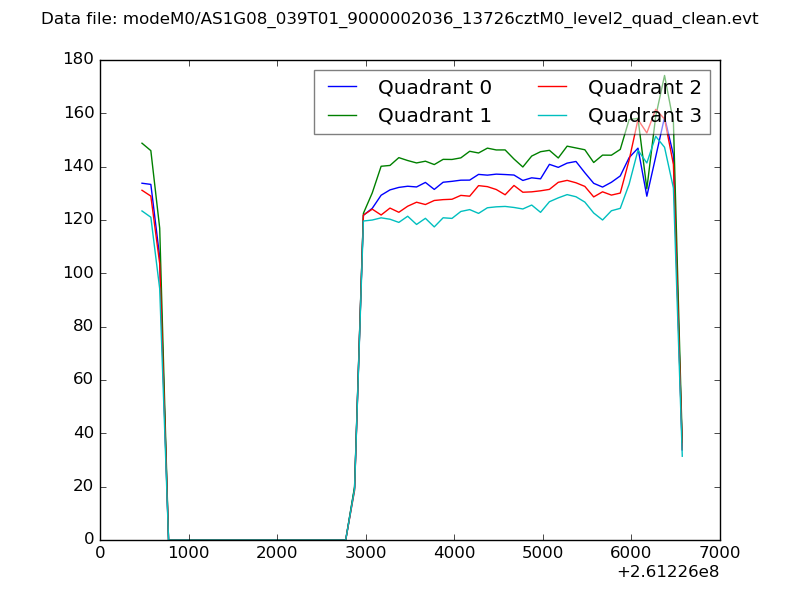 |
|
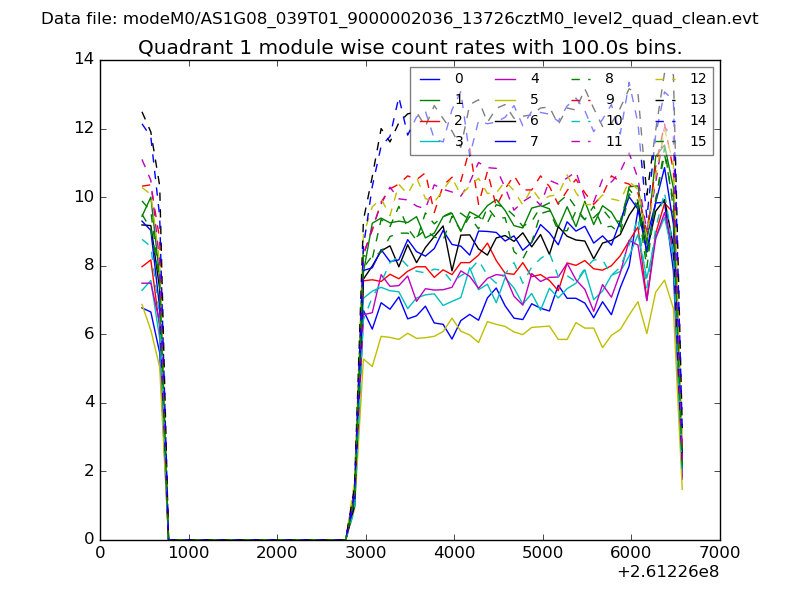
| Module-wise count rates for Quadrant A Data is divided into 100 sec bins |
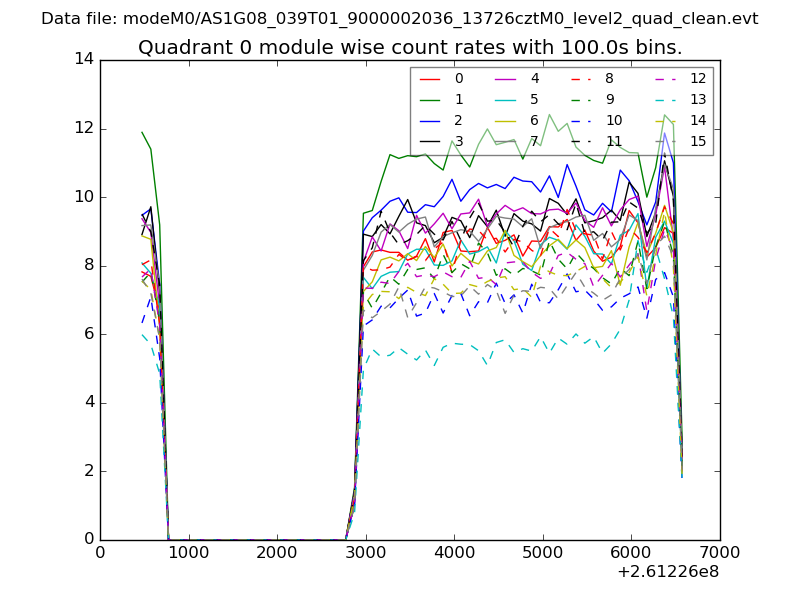 |
 |
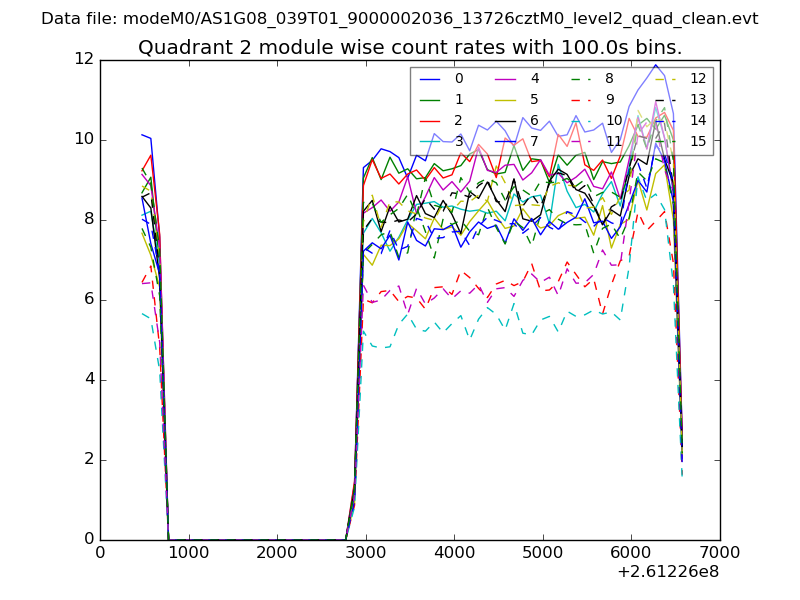
| Module-wise count rates for Quadrant B Data is divided into 100 sec bins |
 |
 |
| Module-wise count rates for Quadrant C Data is divided into 100 sec bins |
 |
 |
| Module-wise count rates for Quadrant D Data is divided into 100 sec bins |
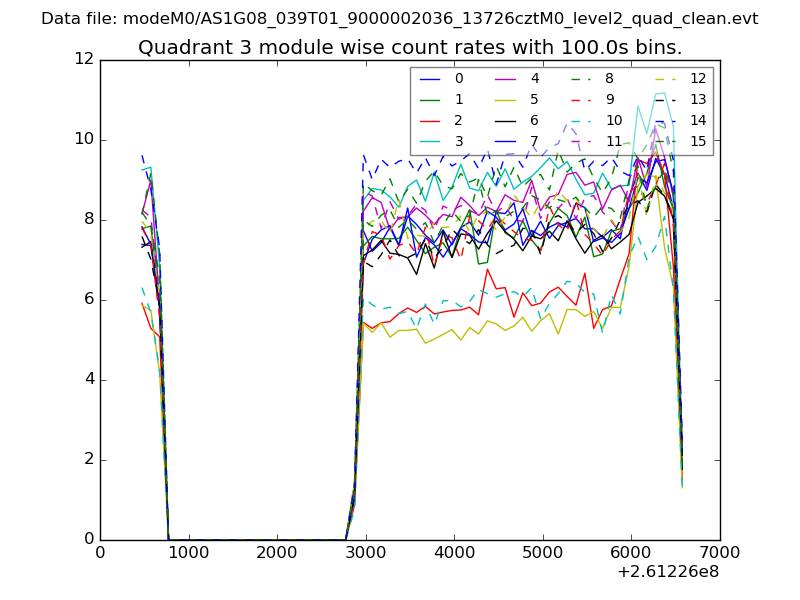 |
 |
| Parameter | Plot |
|---|---|
| CZT HV Monitor | 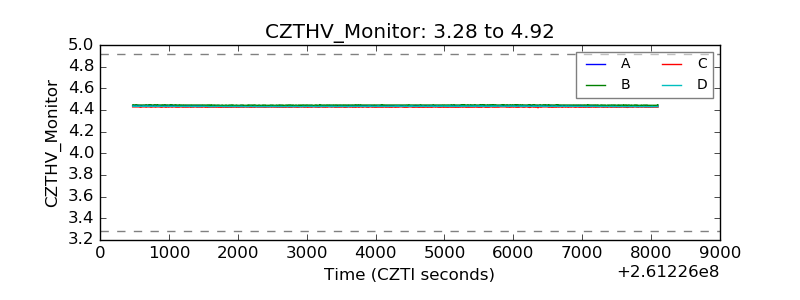 |
| D_VDD | 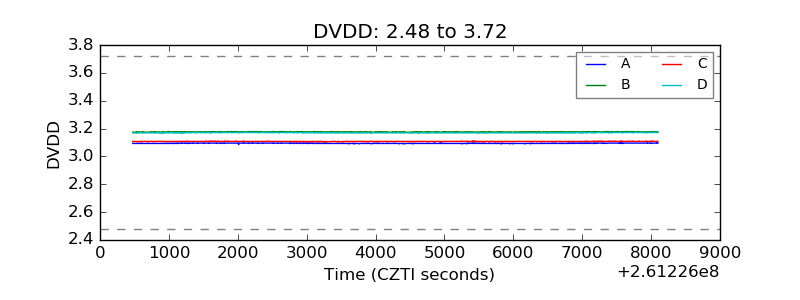 |
| Temperature 1 | 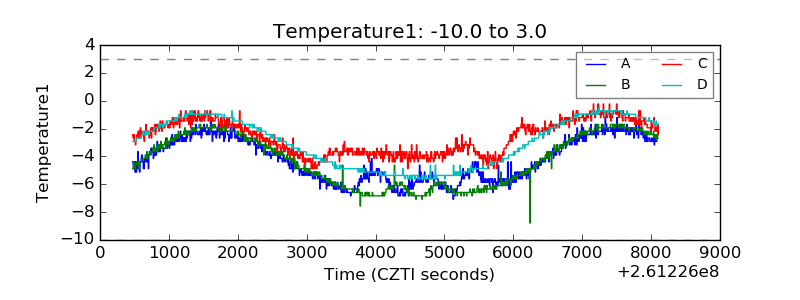 |
| Veto HV Monitor |  |
| Veto LLD | 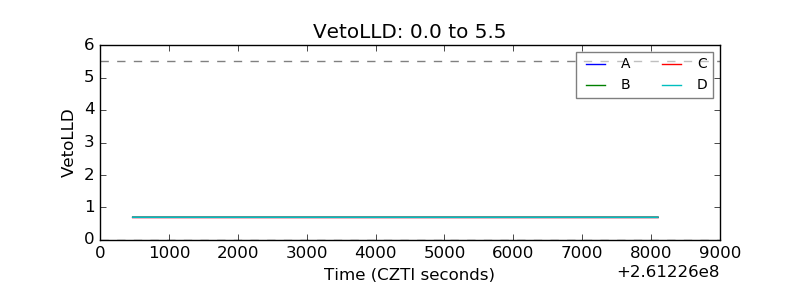 |
| Alpha Counter | 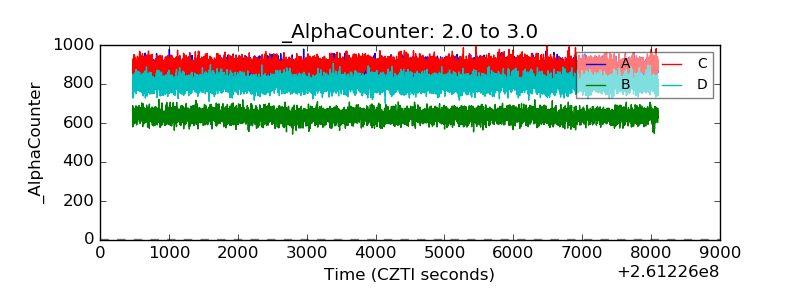 |
| _CPM_Rate |  |
| CZT Counter | 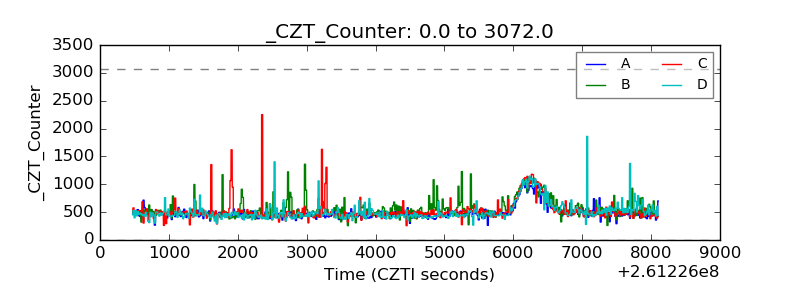 |
| +2.5 Volts monitor | 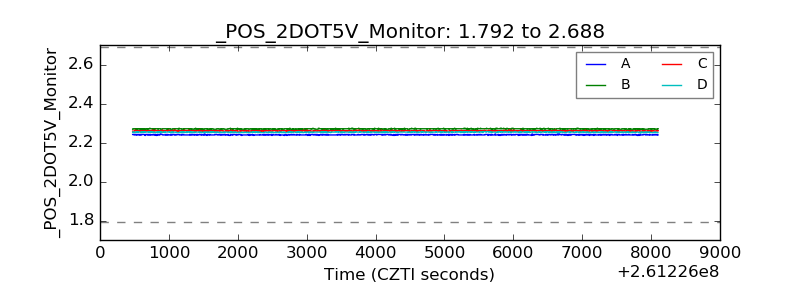 |
| +5 Volts monitor | 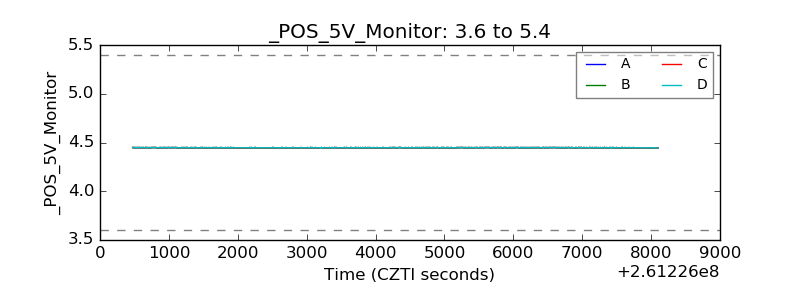 |
| _ROLL_ROT | 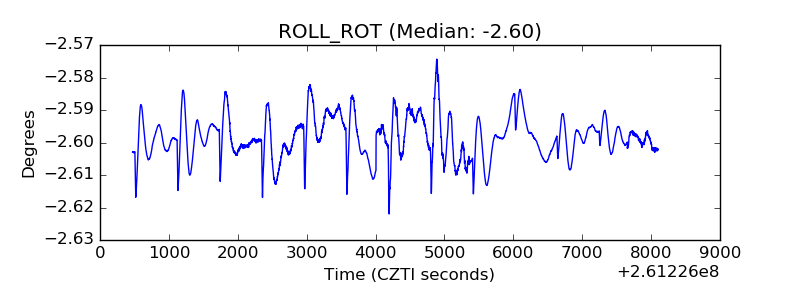 |
| _Roll_DEC |  |
| _Roll_RA | 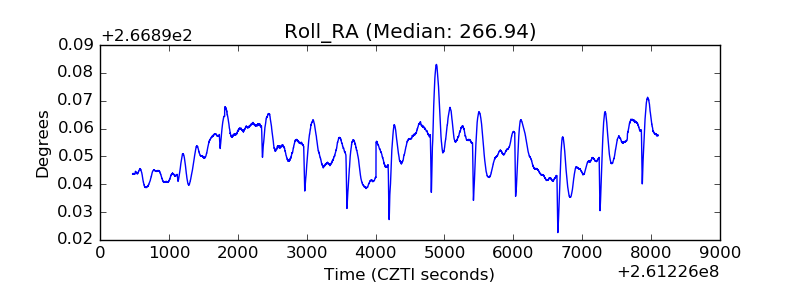 |
| Veto Counter | 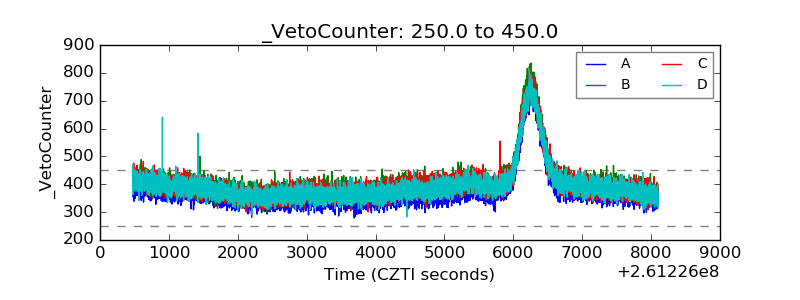 |