| Param | Original file | Final file |
|---|---|---|
| Filename | modeM0/AS1G08_039T01_9000002036_13727cztM0_level2.evt | modeM0/AS1G08_039T01_9000002036_13727cztM0_level2_quad_clean.evt |
| Size (bytes) | 507,738,240 | 81,158,400 |
| Size | 484.2 MB | 77.4 MB |
| Events in quadrant A | 3,531,172 | 493,252 |
| Events in quadrant B | 3,995,414 | 522,116 |
| Events in quadrant C | 3,604,234 | 476,278 |
| Events in quadrant D | 3,745,682 | 452,950 |
| Mode M0 | |||
|---|---|---|---|
| Quadrant | BADHDUFLAG | Total packets | Discarded packets |
| A | 0 | 15297 | 3 |
| B | 0 | 16408 | 2 |
| C | 0 | 15214 | 2 |
| D | 0 | 15839 | 2 |
| Mode SS | |||
|---|---|---|---|
| Quadrant | BADHDUFLAG | Total packets | Discarded packets |
| A | 0 | 150 | 0 |
| B | 0 | 150 | 0 |
| C | 0 | 150 | 0 |
| D | 0 | 150 | 0 |
| Mode M9 | |||
|---|---|---|---|
| Quadrant | BADHDUFLAG | Total packets | Discarded packets |
| A | 0 | 2 | 0 |
| B | 0 | 2 | 0 |
| C | 0 | 2 | 0 |
| D | 0 | 2 | 0 |
| Quadrant | Total seconds | Saturated seconds | Saturation percentage |
|---|---|---|---|
| A | 7366 | 127 | 1.724138% |
| B | 7366 | 194 | 2.633723% |
| C | 7366 | 92 | 1.248982% |
| D | 7366 | 105 | 1.425468% |
Noise dominated data is calculated using 1-second bins in cleaned event files. If a bin has >2000 counts, and if more than 50% of those come from <1% of pixels, then it is considered to be noise-dominated and hence unusable.
| Quadrant | # 1 sec bins | Bins with >0 counts | Bins with >2000 counts | High rate bins dominated by noise | Noise dominated (total time) | Noise dominated (detector-on time) | Marked lightcurve |
|---|---|---|---|---|---|---|---|
| A | 7642 | 7369 | 8 | 8 | 0.10% | 0.11% | 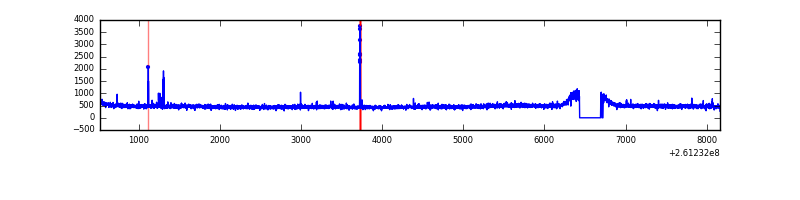 |
| B | 7642 | 7369 | 45 | 45 | 0.59% | 0.61% | 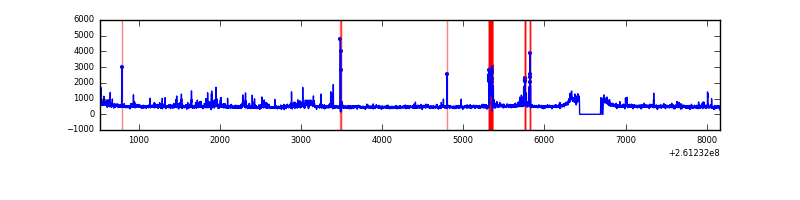 |
| C | 7642 | 7369 | 0 | 0 | 0.00% | 0.00% | 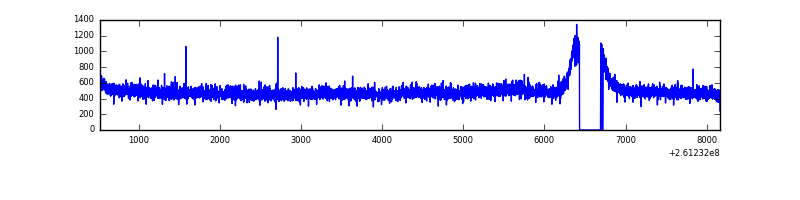 |
| D | 7642 | 7369 | 13 | 13 | 0.17% | 0.18% | 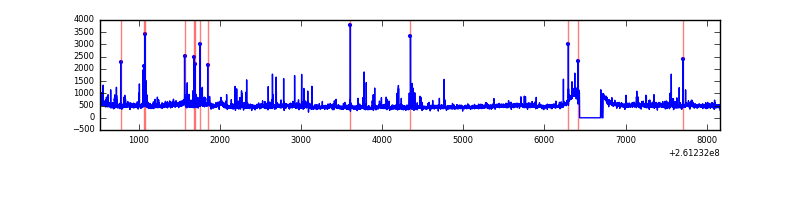 |
Top three noisy pixels from each quadrant. If the there are fewer than three noisy pixels in the level2.evt file, extra rows are filled as -1
| Pixel properties | Quadrant properties | ||||||
|---|---|---|---|---|---|---|---|
| Quadrant | DetID | PixID | Counts | Sigma | Mean | Median | Sigma |
| A | 9 | 143 | 43601 | 228.16 | 903 | 883 | 187.2 |
| A | 1 | 162 | 10228 | 49.91 | 903 | 883 | 187.2 |
| A | 0 | 226 | 8174 | 38.94 | 903 | 883 | 187.2 |
| B | 4 | 48 | 176208 | 996.6 | 909 | 889 | 175.9 |
| B | 0 | 219 | 63835 | 357.81 | 909 | 889 | 175.9 |
| B | 4 | 173 | 55893 | 312.67 | 909 | 889 | 175.9 |
| C | 3 | 233 | 185362 | 905.85 | 875 | 880 | 203.7 |
| C | 13 | 61 | 6326 | 26.74 | 875 | 880 | 203.7 |
| C | 8 | 128 | 4154 | 16.08 | 875 | 880 | 203.7 |
| D | 8 | 195 | 190538 | 890.86 | 872 | 846 | 212.9 |
| D | 1 | 52 | 93979 | 437.38 | 872 | 846 | 212.9 |
| D | 10 | 157 | 55916 | 258.63 | 872 | 846 | 212.9 |
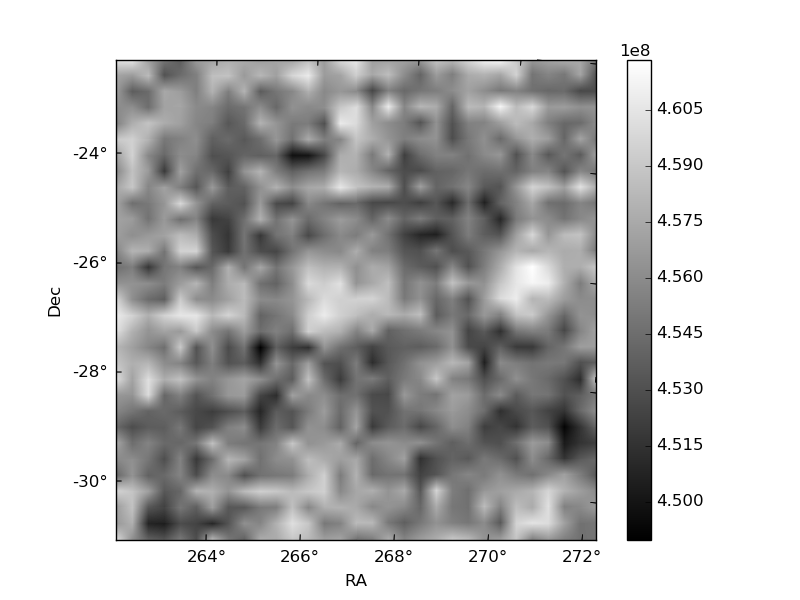
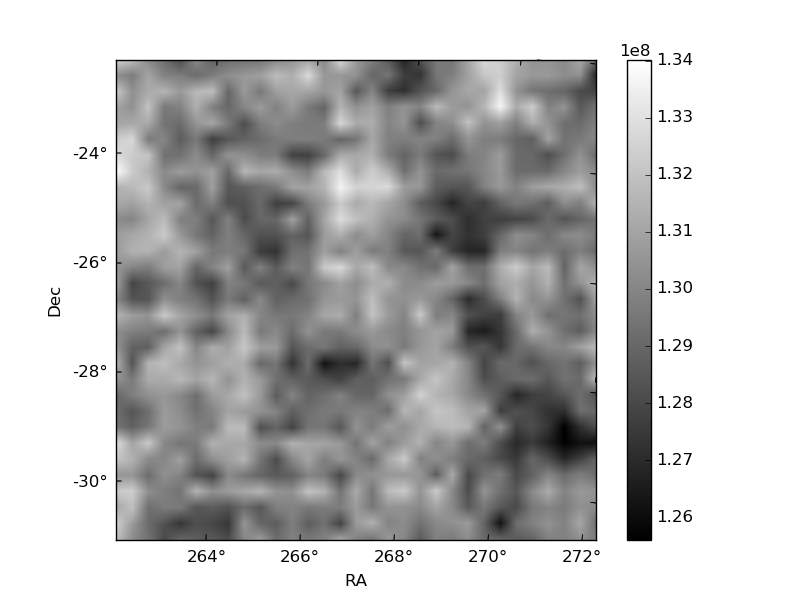
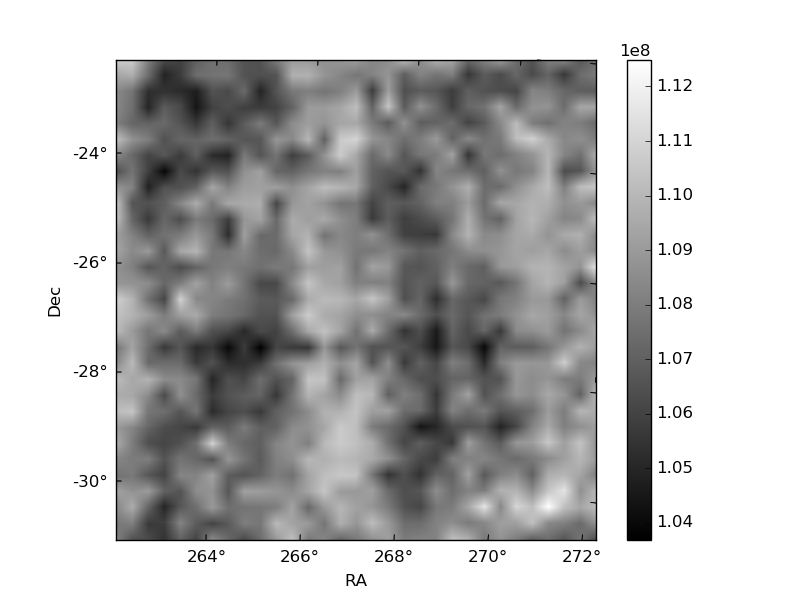
Histogram calculated using DETX and DETY for each event in the final _common_clean file
| Quadrant A | 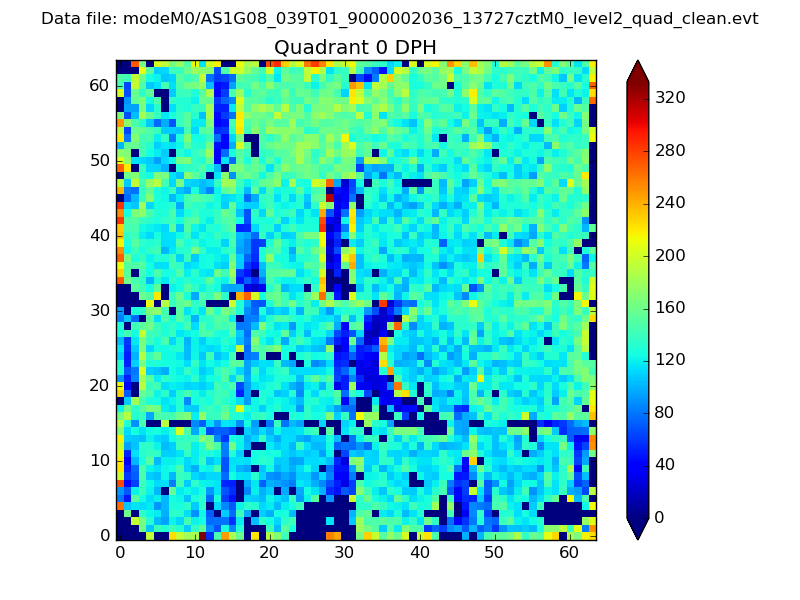 |
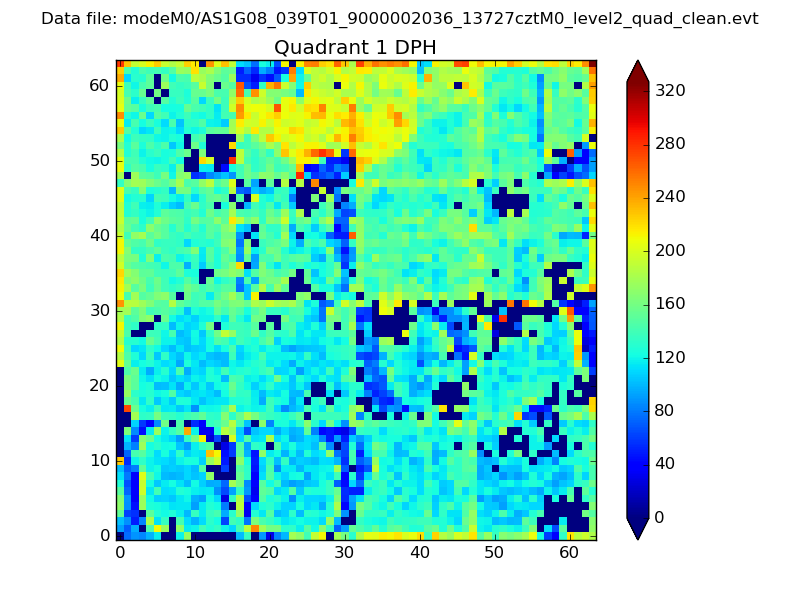 |
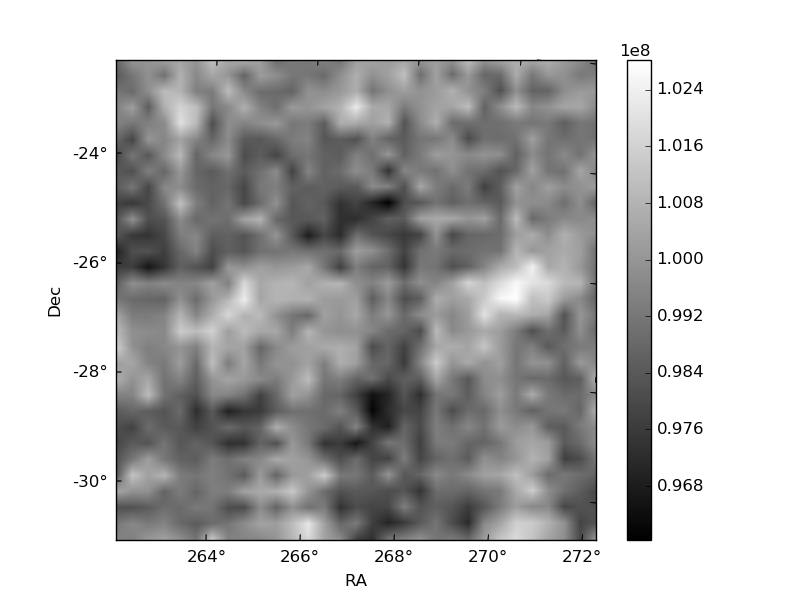
Quadrant B |
|---|---|---|---|
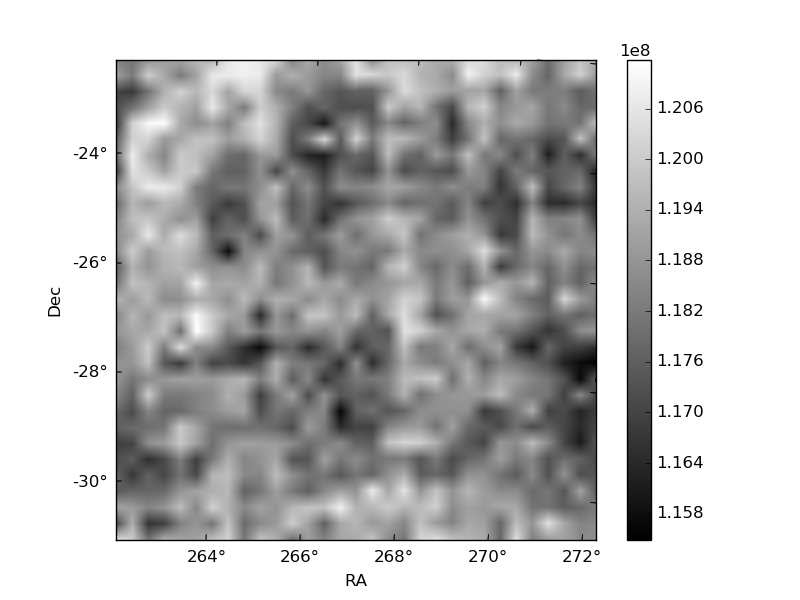
| Quadrant D |  |
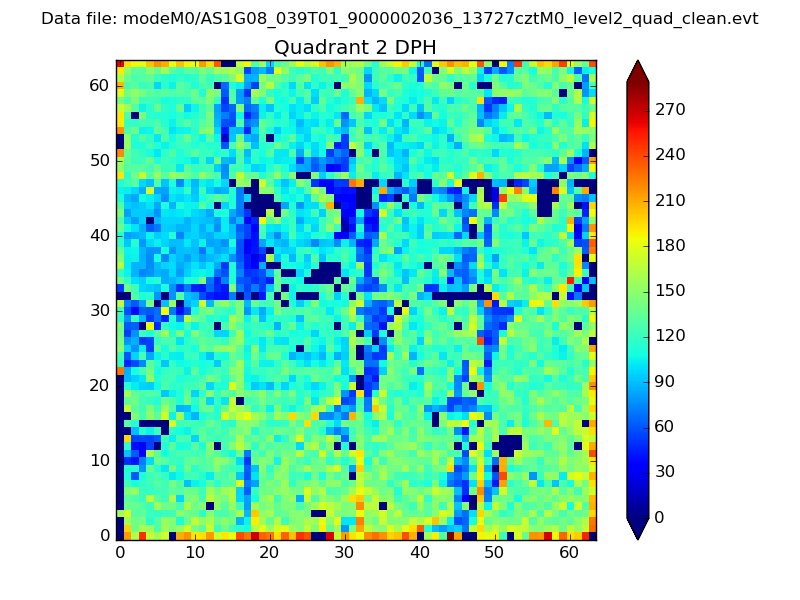 |
Quadrant C |
| Plot type | Count rate plots | Images |
|---|---|---|
| Comparison with Poisson distribution Blue bars denote a histogram of data divided into 1 sec bins. Red curve is a Poisson curve with rate = median count rate of data. |
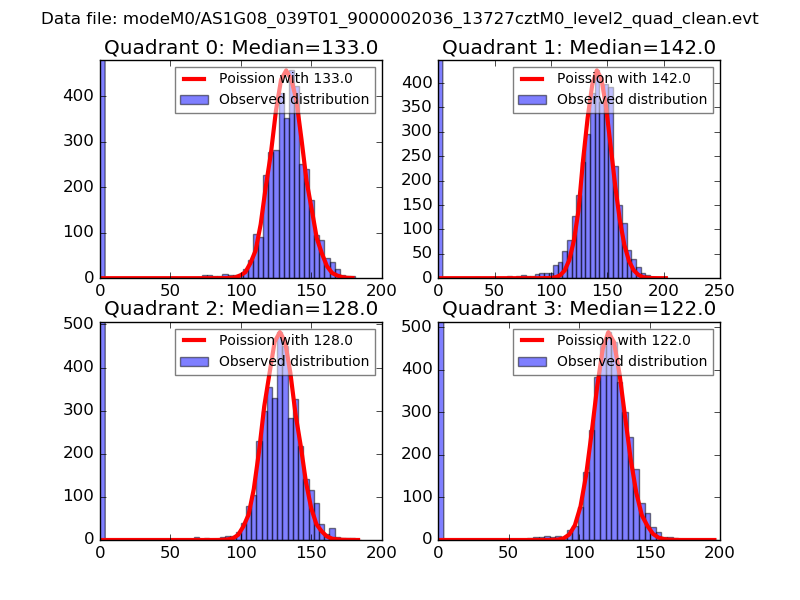 |
 |
| Quadrant-wise count rates Data is divided into 100 sec bins |
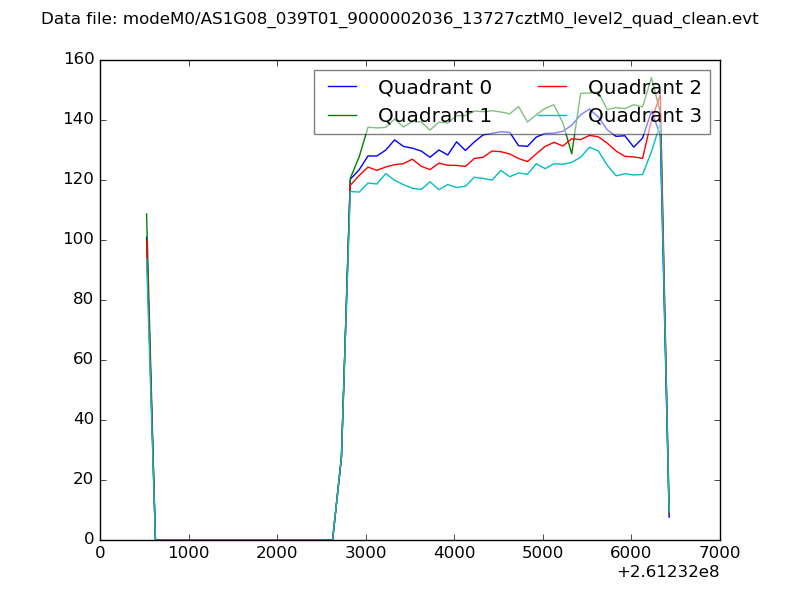 |
|
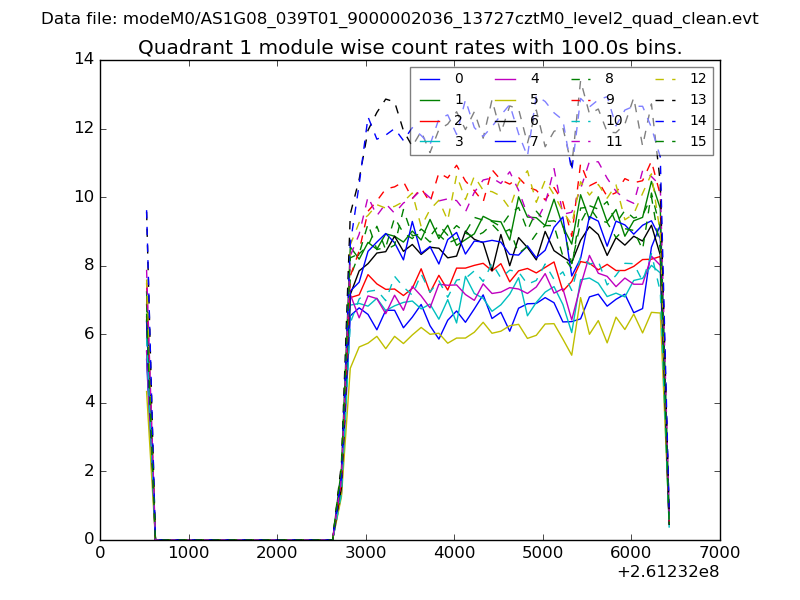
| Module-wise count rates for Quadrant A Data is divided into 100 sec bins |
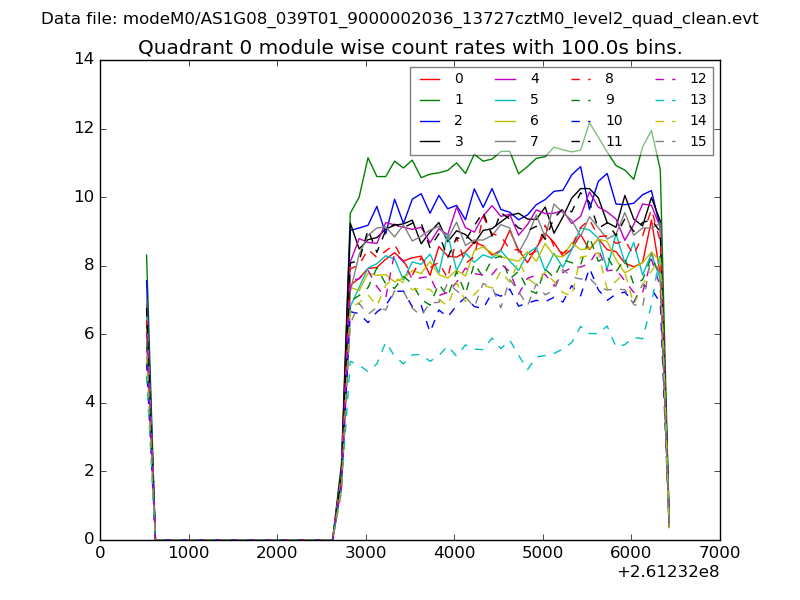 |
 |
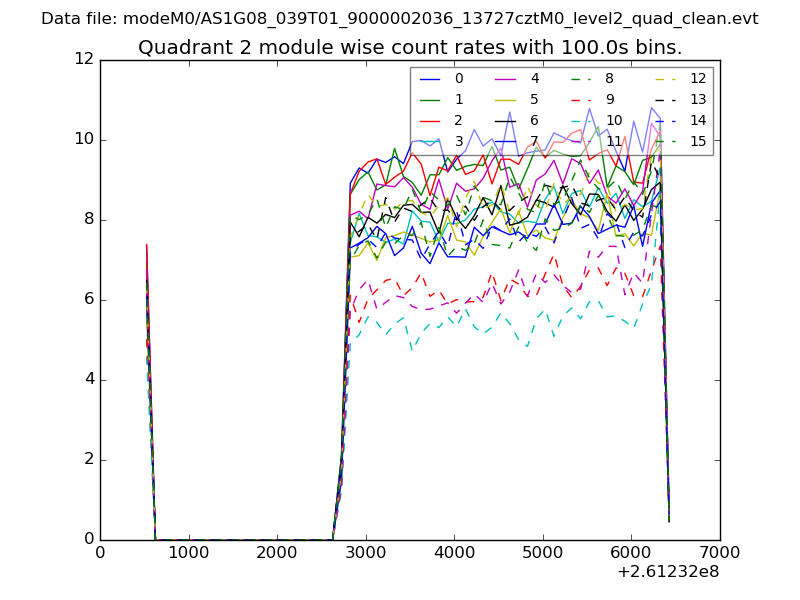
| Module-wise count rates for Quadrant B Data is divided into 100 sec bins |
 |
 |
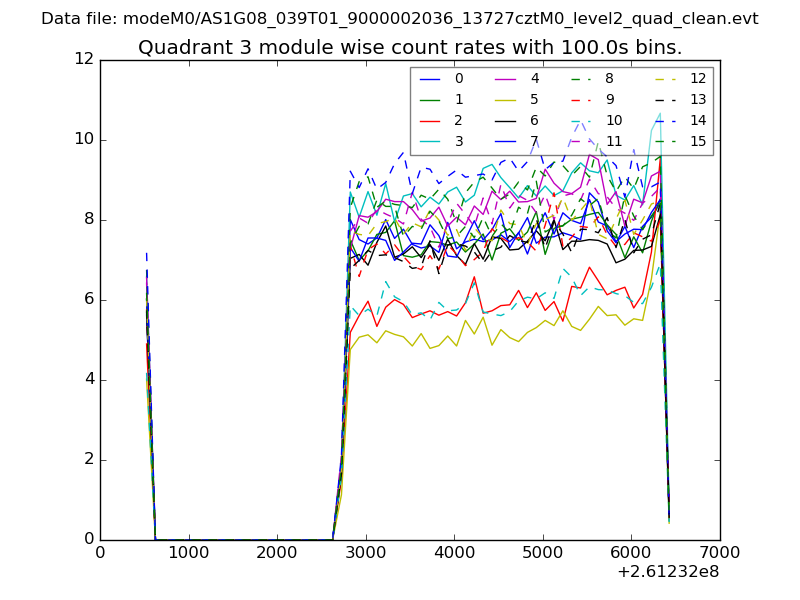
| Module-wise count rates for Quadrant C Data is divided into 100 sec bins |
 |
 |
| Module-wise count rates for Quadrant D Data is divided into 100 sec bins |
 |
 |
| Parameter | Plot |
|---|---|
| CZT HV Monitor | 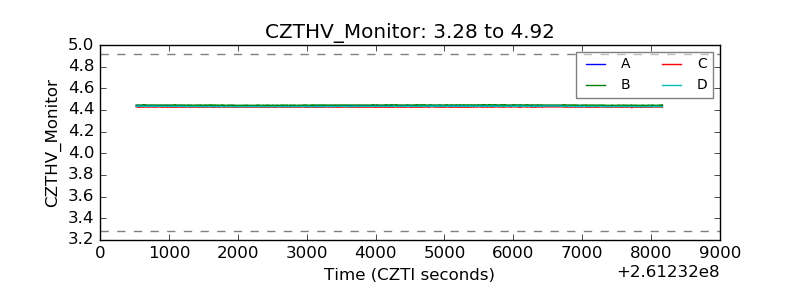 |
| D_VDD | 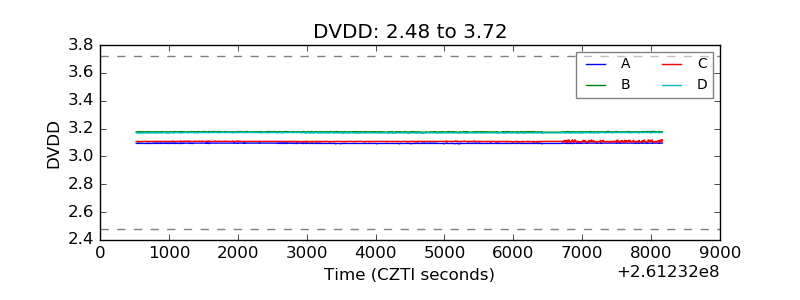 |
| Temperature 1 | 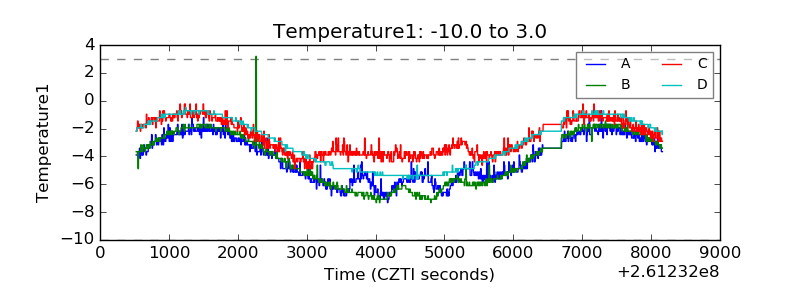 |
| Veto HV Monitor | 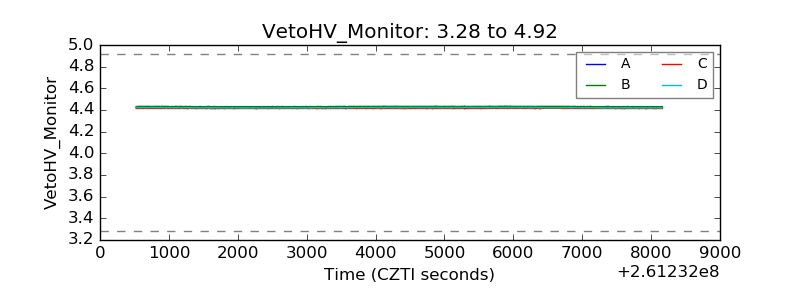 |
| Veto LLD | 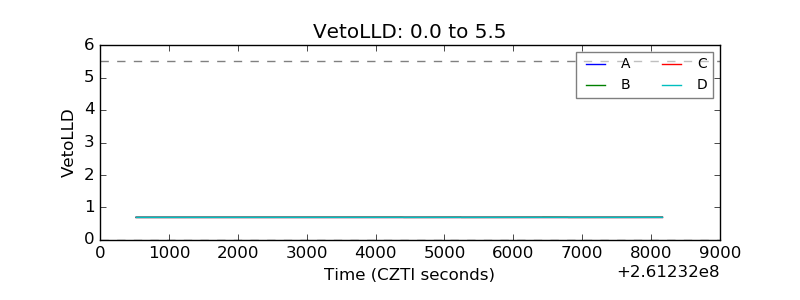 |
| Alpha Counter | 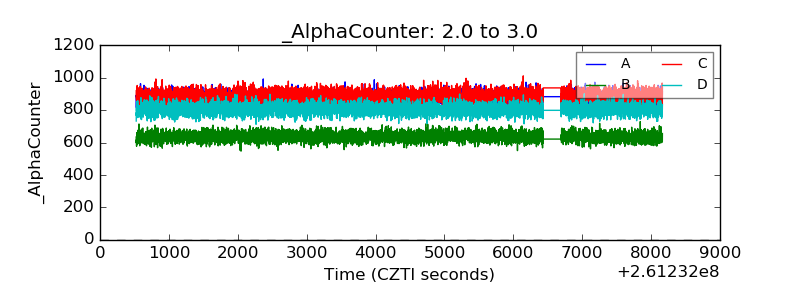 |
| _CPM_Rate |  |
| CZT Counter |  |
| +2.5 Volts monitor |  |
| +5 Volts monitor |  |
| _ROLL_ROT | 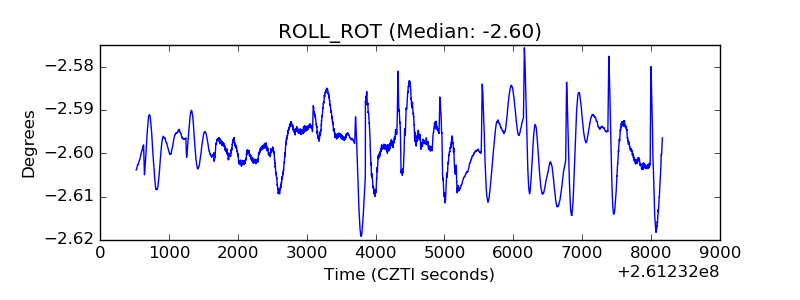 |
| _Roll_DEC | 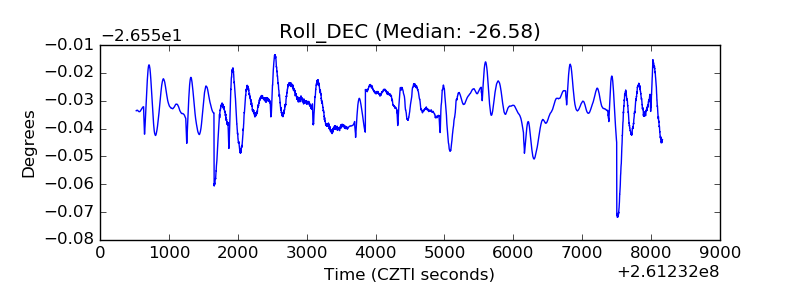 |
| _Roll_RA | 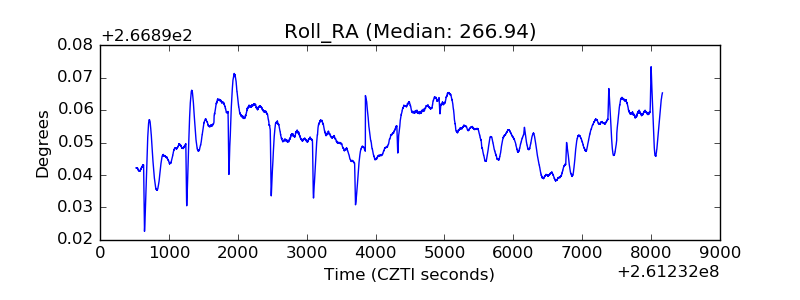 |
| Veto Counter | 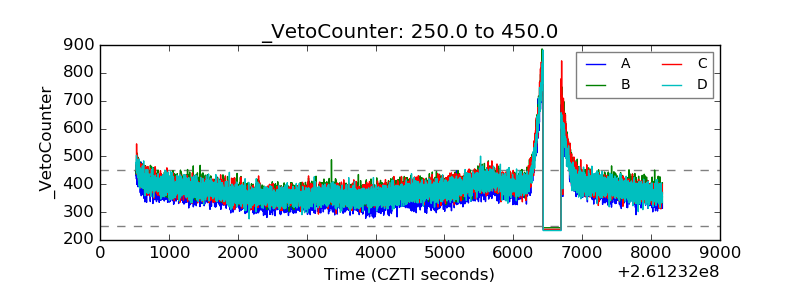 |