| Param | Original file | Final file |
|---|---|---|
| Filename | modeM0/AS1G08_039T01_9000002036_13729cztM0_level2.evt | modeM0/AS1G08_039T01_9000002036_13729cztM0_level2_quad_clean.evt |
| Size (bytes) | 278,576,640 | 44,599,680 |
| Size | 265.7 MB | 42.5 MB |
| Events in quadrant A | 1,984,932 | 268,828 |
| Events in quadrant B | 2,114,403 | 287,639 |
| Events in quadrant C | 1,968,597 | 260,916 |
| Events in quadrant D | 2,092,990 | 248,099 |
| Mode M0 | |||
|---|---|---|---|
| Quadrant | BADHDUFLAG | Total packets | Discarded packets |
| A | 0 | 8576 | 2 |
| B | 0 | 8787 | 2 |
| C | 0 | 8477 | 2 |
| D | 0 | 8777 | 2 |
| Mode SS | |||
|---|---|---|---|
| Quadrant | BADHDUFLAG | Total packets | Discarded packets |
| A | 0 | 84 | 0 |
| B | 0 | 84 | 0 |
| C | 0 | 84 | 0 |
| D | 0 | 84 | 0 |
| Mode M9 | |||
|---|---|---|---|
| Quadrant | BADHDUFLAG | Total packets | Discarded packets |
| A | 0 | 2 | 0 |
| B | 0 | 2 | 0 |
| C | 0 | 2 | 0 |
| D | 0 | 2 | 0 |
| Quadrant | Total seconds | Saturated seconds | Saturation percentage |
|---|---|---|---|
| A | 4031 | 122 | 3.026544% |
| B | 4031 | 133 | 3.299429% |
| C | 4031 | 90 | 2.232697% |
| D | 4031 | 91 | 2.257504% |
Noise dominated data is calculated using 1-second bins in cleaned event files. If a bin has >2000 counts, and if more than 50% of those come from <1% of pixels, then it is considered to be noise-dominated and hence unusable.
| Quadrant | # 1 sec bins | Bins with >0 counts | Bins with >2000 counts | High rate bins dominated by noise | Noise dominated (total time) | Noise dominated (detector-on time) | Marked lightcurve |
|---|---|---|---|---|---|---|---|
| A | 4307 | 4034 | 6 | 6 | 0.14% | 0.15% | 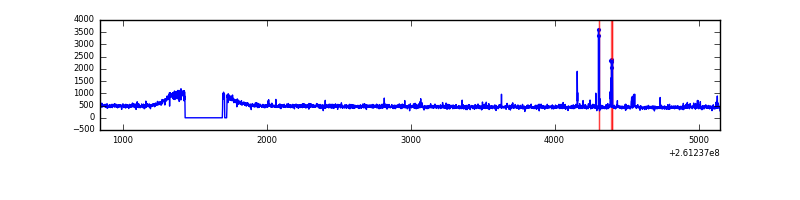 |
| B | 4307 | 4034 | 1 | 1 | 0.02% | 0.02% | 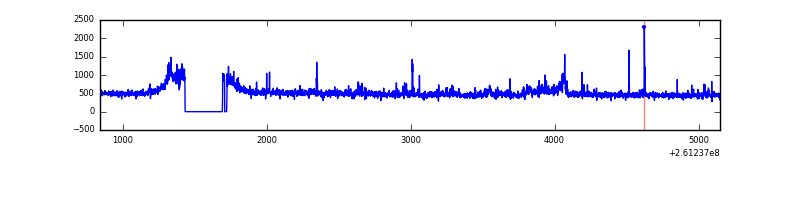 |
| C | 4307 | 4034 | 0 | 0 | 0.00% | 0.00% | 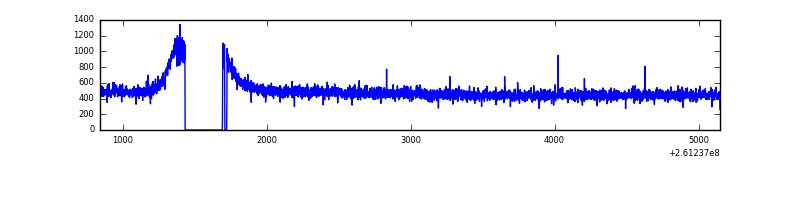 |
| D | 4307 | 4034 | 5 | 5 | 0.12% | 0.12% | 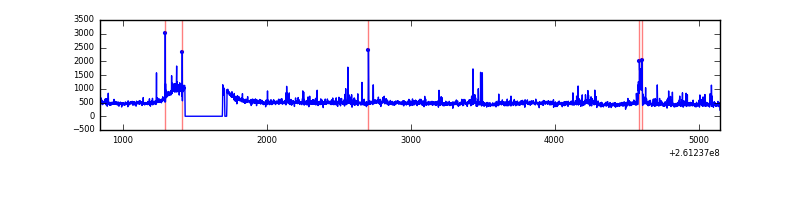 |
Top three noisy pixels from each quadrant. If the there are fewer than three noisy pixels in the level2.evt file, extra rows are filled as -1
| Pixel properties | Quadrant properties | ||||||
|---|---|---|---|---|---|---|---|
| Quadrant | DetID | PixID | Counts | Sigma | Mean | Median | Sigma |
| A | 9 | 143 | 51267 | 485.81 | 499 | 487 | 104.5 |
| A | 1 | 162 | 6598 | 58.46 | 499 | 487 | 104.5 |
| A | 15 | 69 | 4856 | 41.8 | 499 | 487 | 104.5 |
| B | 0 | 219 | 79836 | 802.9 | 503 | 491 | 98.8 |
| B | 4 | 48 | 20539 | 202.87 | 503 | 491 | 98.8 |
| B | 12 | 111 | 11289 | 109.27 | 503 | 491 | 98.8 |
| C | 3 | 233 | 73160 | 632.01 | 484 | 487 | 115.0 |
| C | 8 | 128 | 4488 | 34.8 | 484 | 487 | 115.0 |
| C | 13 | 61 | 3374 | 25.11 | 484 | 487 | 115.0 |
| D | 5 | 222 | 76705 | 634.34 | 482 | 467 | 120.2 |
| D | 8 | 195 | 75434 | 623.77 | 482 | 467 | 120.2 |
| D | 10 | 157 | 42880 | 352.9 | 482 | 467 | 120.2 |
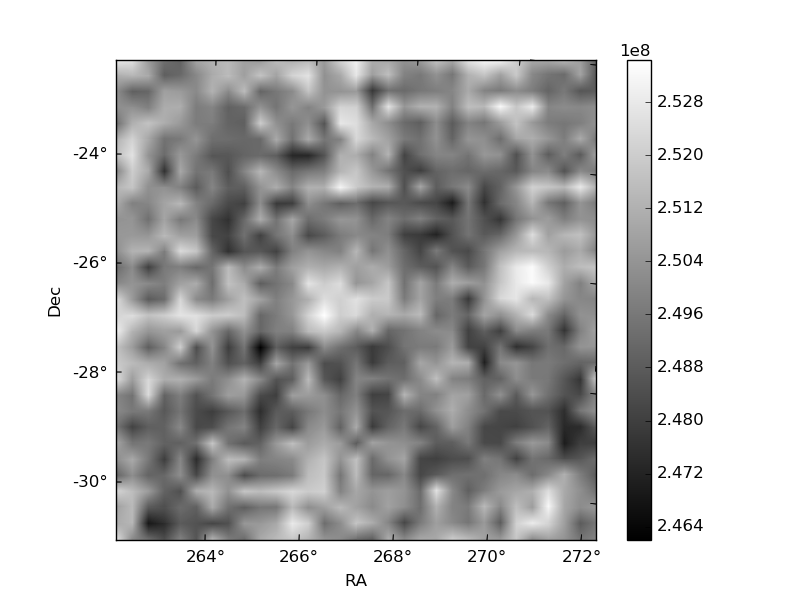
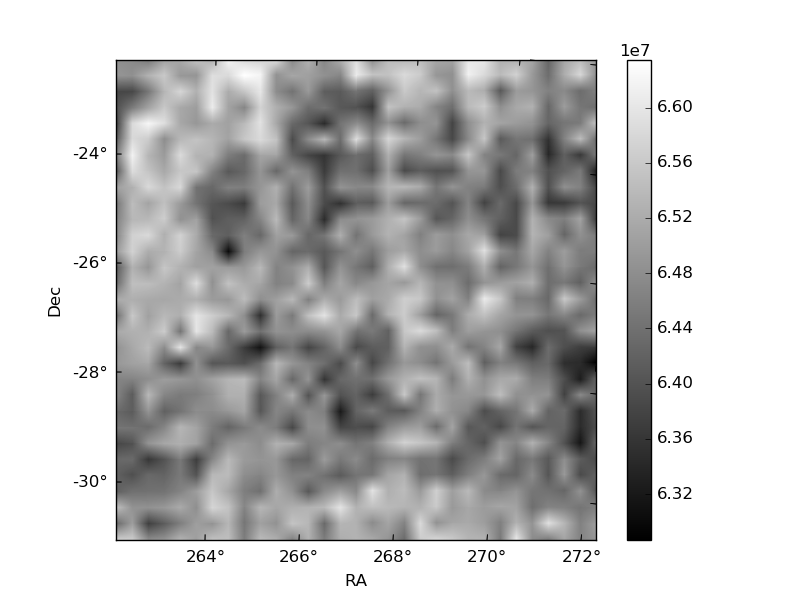
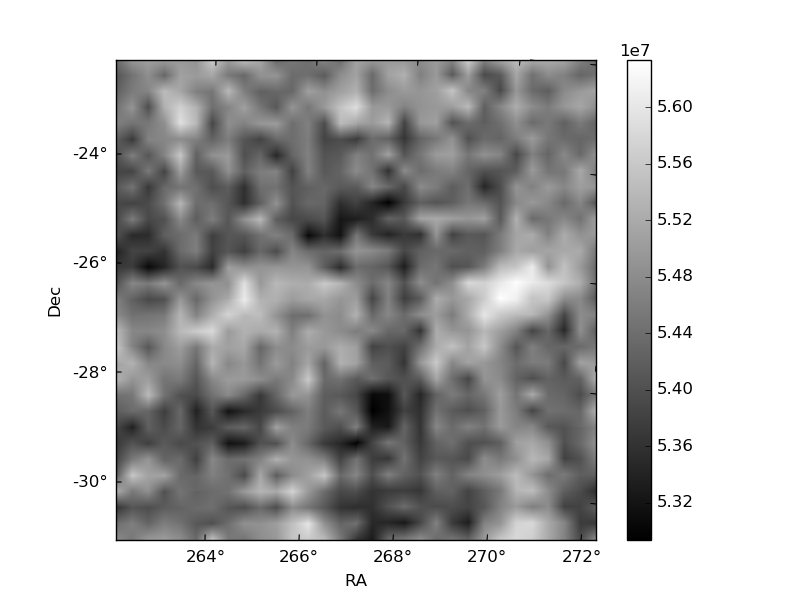
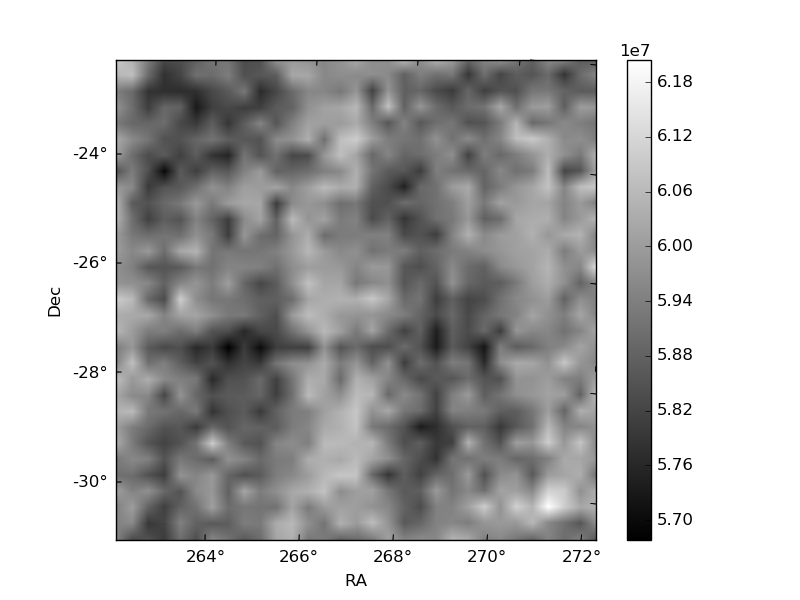
Histogram calculated using DETX and DETY for each event in the final _common_clean file
| Quadrant A | 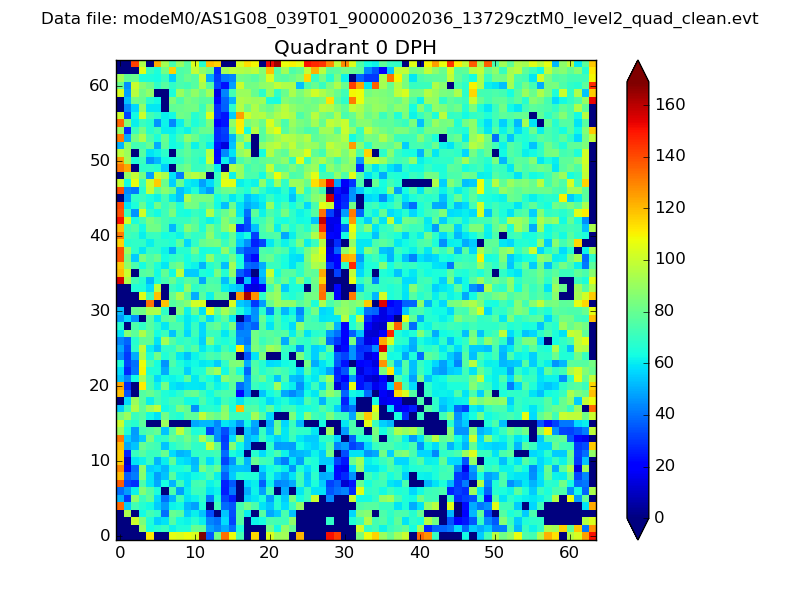 |
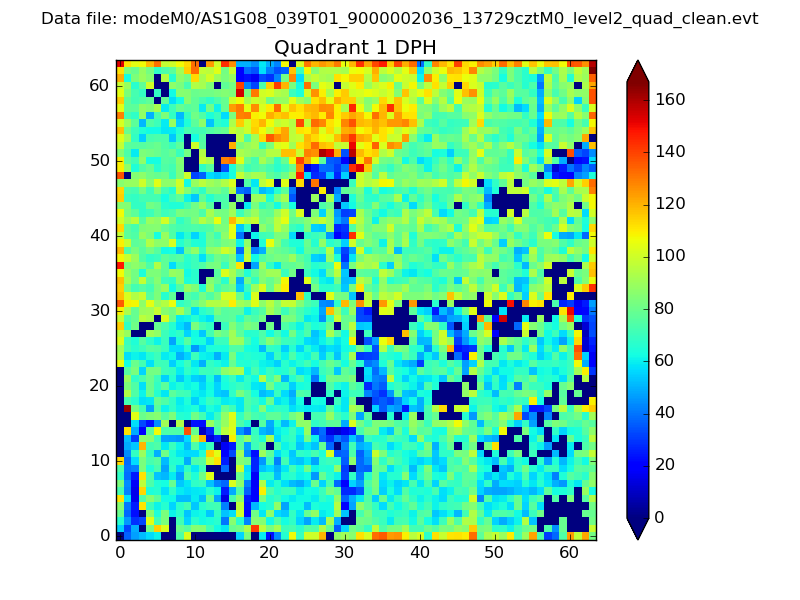 |
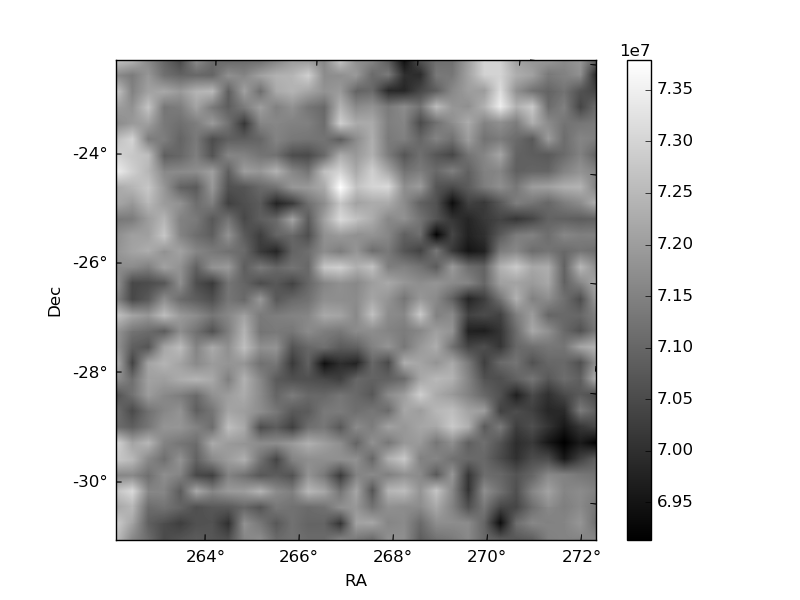
Quadrant B |
|---|---|---|---|
| Quadrant D | 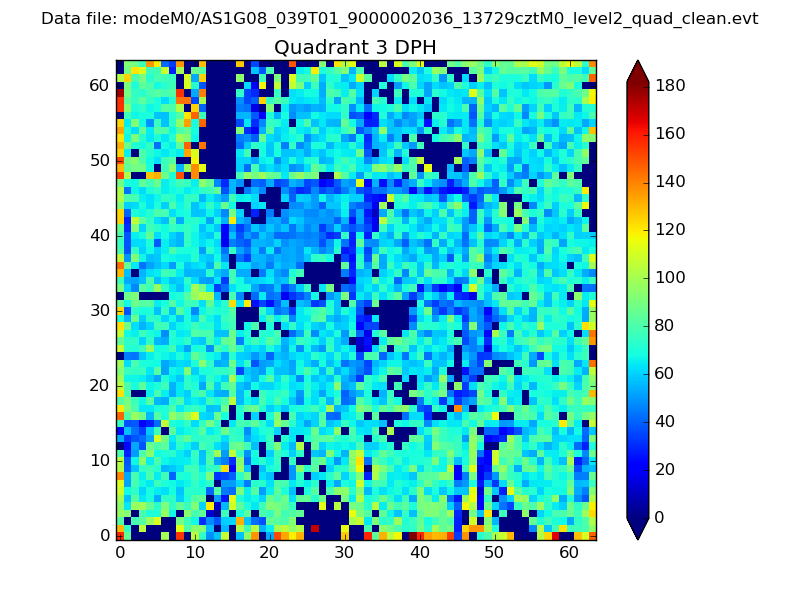 |
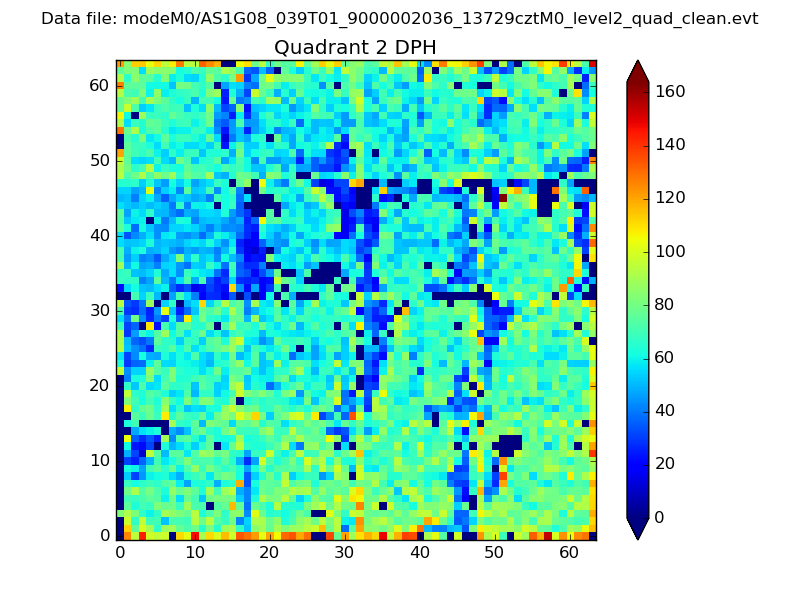 |
Quadrant C |
| Plot type | Count rate plots | Images |
|---|---|---|
| Comparison with Poisson distribution Blue bars denote a histogram of data divided into 1 sec bins. Red curve is a Poisson curve with rate = median count rate of data. |
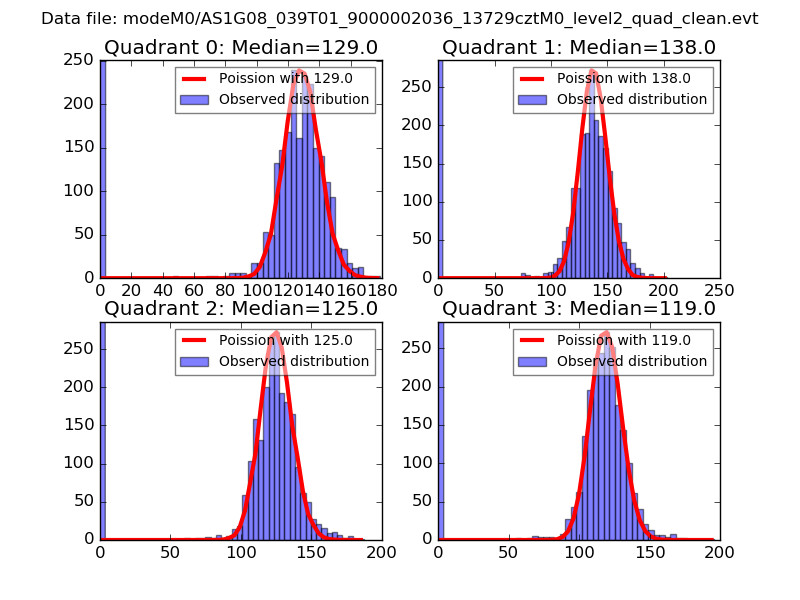 |
 |
| Quadrant-wise count rates Data is divided into 100 sec bins |
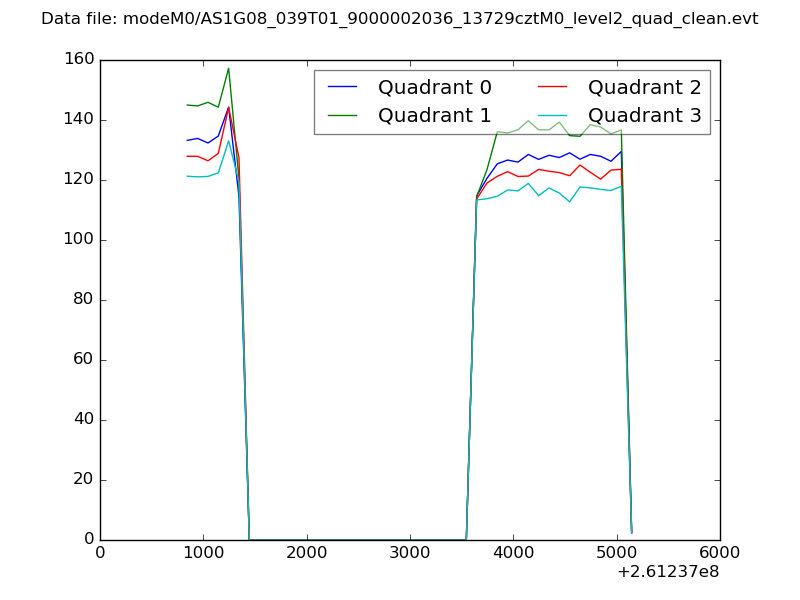 |
|
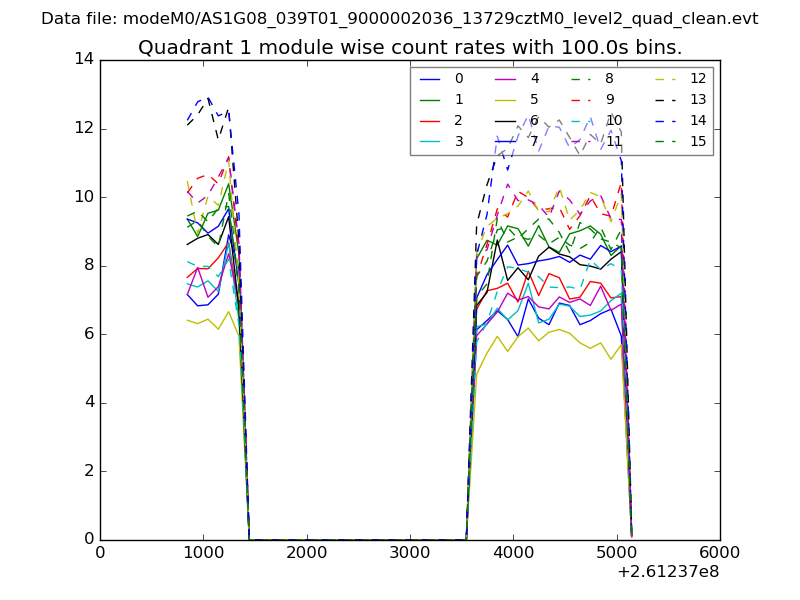
| Module-wise count rates for Quadrant A Data is divided into 100 sec bins |
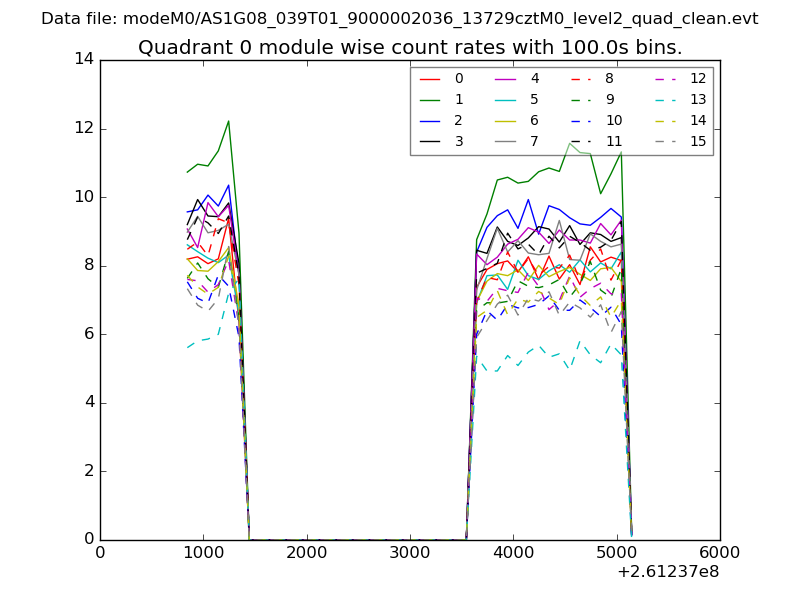 |
 |
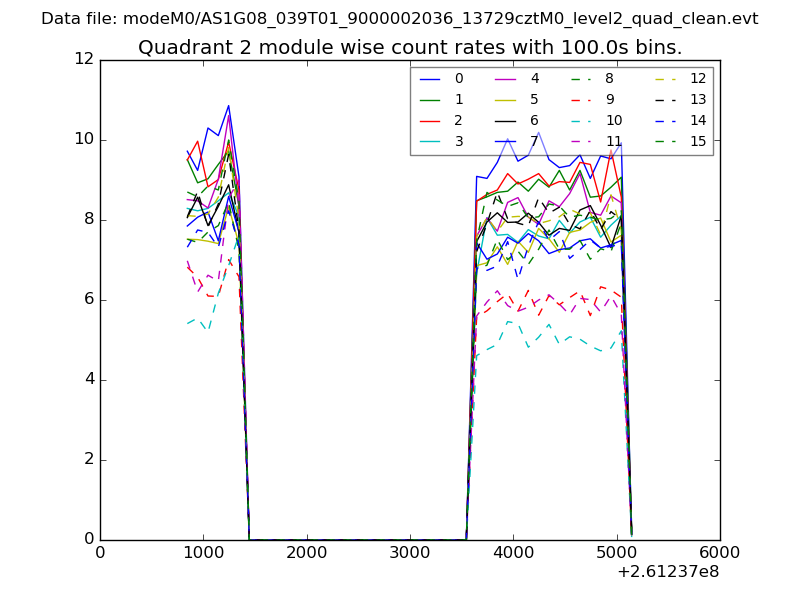
| Module-wise count rates for Quadrant B Data is divided into 100 sec bins |
 |
 |
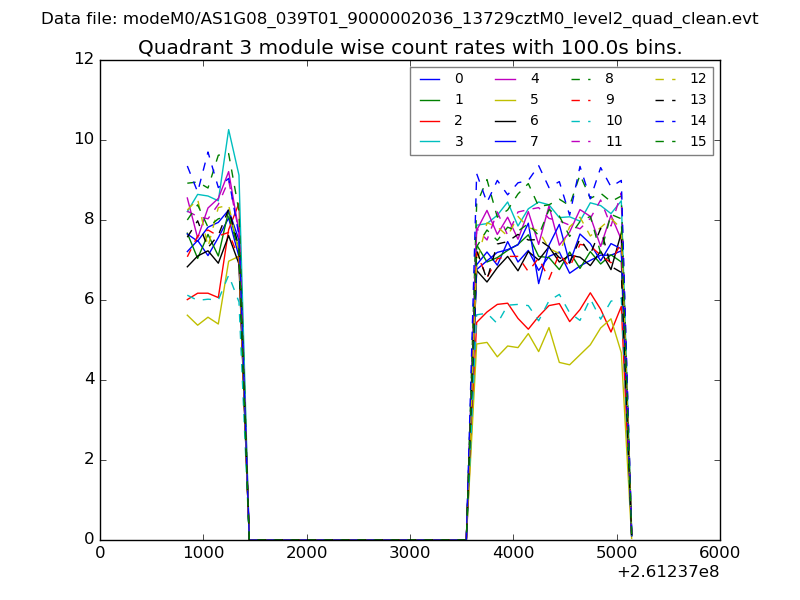
| Module-wise count rates for Quadrant C Data is divided into 100 sec bins |
 |
 |
| Module-wise count rates for Quadrant D Data is divided into 100 sec bins |
 |
 |
| Parameter | Plot |
|---|---|
| CZT HV Monitor | 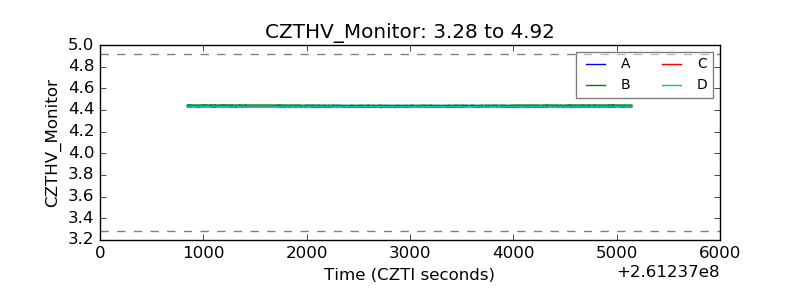 |
| D_VDD | 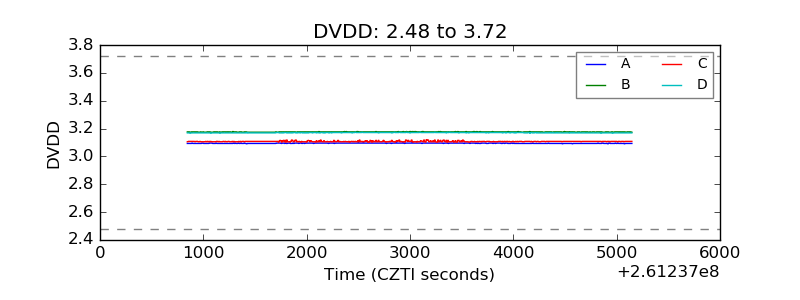 |
| Temperature 1 | 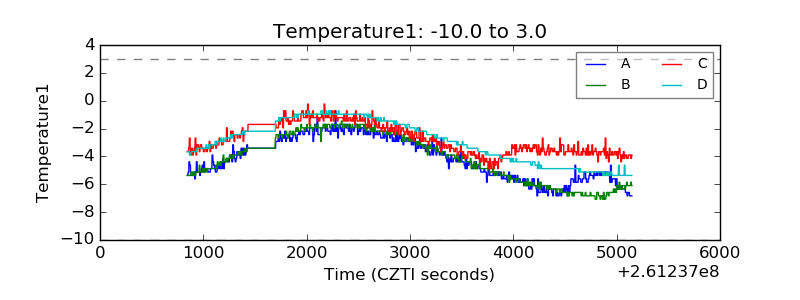 |
| Veto HV Monitor | 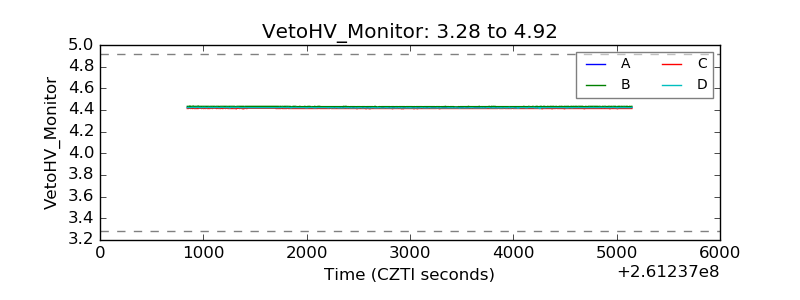 |
| Veto LLD | 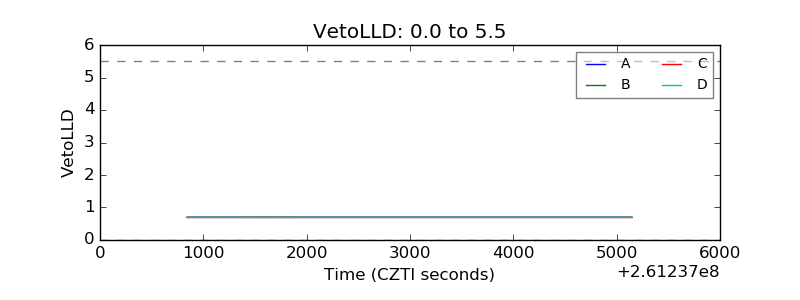 |
| Alpha Counter | 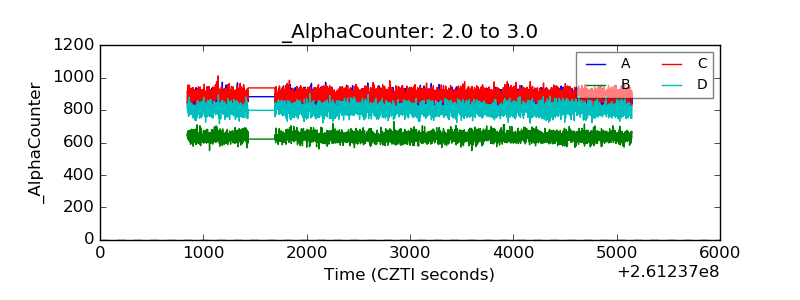 |
| _CPM_Rate | 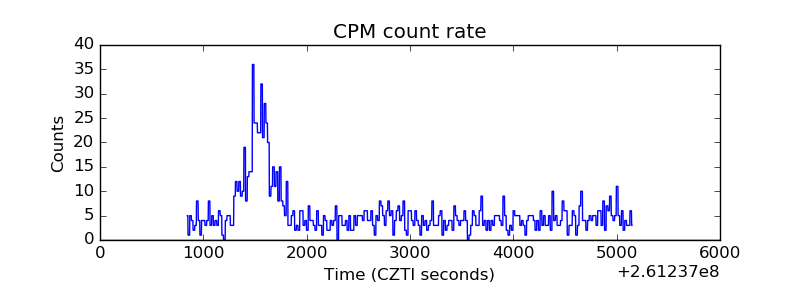 |
| CZT Counter | 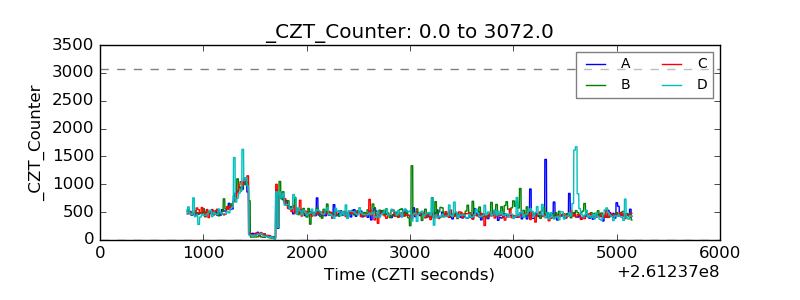 |
| +2.5 Volts monitor | 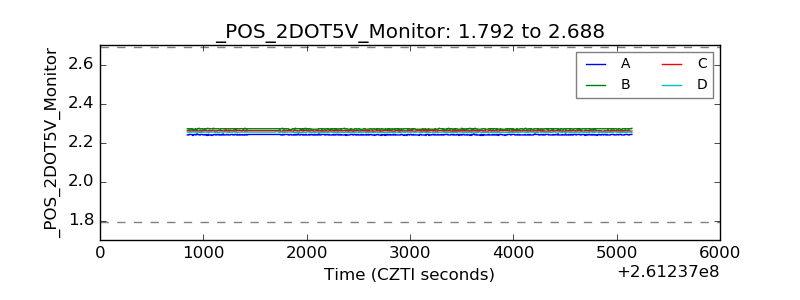 |
| +5 Volts monitor |  |
| _ROLL_ROT | 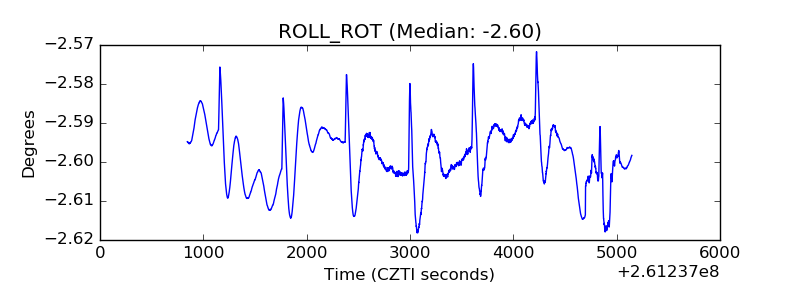 |
| _Roll_DEC | 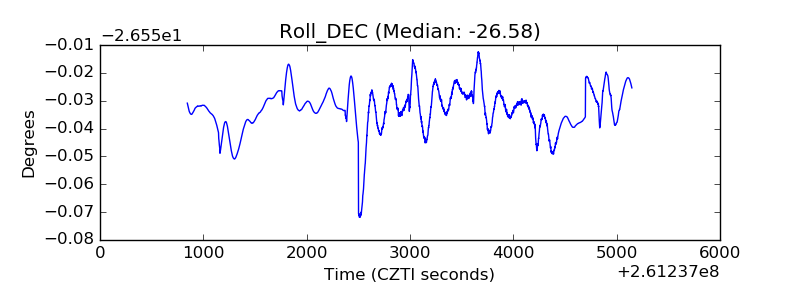 |
| _Roll_RA | 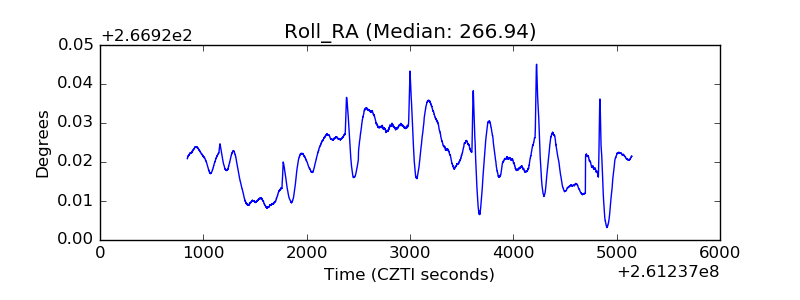 |
| Veto Counter | 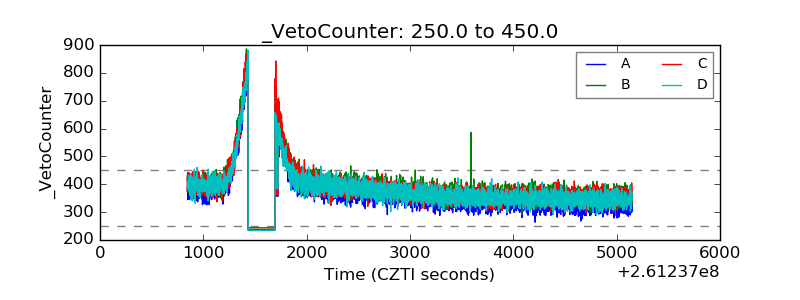 |