| Param | Original file | Final file |
|---|---|---|
| Filename | modeM0/AS1G08_062T01_9000002038cztM0_level2.fits | modeM0/AS1G08_062T01_9000002038cztM0_level2_quad_clean.evt |
| Size (bytes) | 1,970,136,000 | 2,049,448,320 |
| Size | 1.8 GB | 1.9 GB |
| Events in quadrant A | 11,981,434 | 12,353,069 |
| Events in quadrant B | 11,501,318 | 11,993,551 |
| Events in quadrant C | 11,928,910 | 12,359,476 |
| Events in quadrant D | 10,187,792 | 11,304,074 |
| Mode M9 | |||
|---|---|---|---|
| Quadrant | BADHDUFLAG | Total packets | Discarded packets |
| A | 0 | 333 | 0 |
| B | 0 | 333 | 0 |
| C | 0 | 333 | 0 |
| D | 0 | 333 | 0 |
| Mode M0 | |||
|---|---|---|---|
| Quadrant | BADHDUFLAG | Total packets | Discarded packets |
| A | 0 | 440299 | 0 |
| B | 0 | 455080 | 0 |
| C | 0 | 452856 | 0 |
| D | 0 | 546173 | 0 |
| Mode SS | |||
|---|---|---|---|
| Quadrant | BADHDUFLAG | Total packets | Discarded packets |
| A | 0 | 4182 | 0 |
| B | 0 | 4182 | 0 |
| C | 0 | 4182 | 0 |
| D | 0 | 4182 | 0 |
| Quadrant | Total seconds | Saturated seconds | Saturation percentage |
|---|---|---|---|
| A | 205292 | 3276 | 1.595776% |
| B | 205292 | 3669 | 1.787210% |
| C | 205292 | 3998 | 1.947470% |
| D | 205292 | 7330 | 3.570524% |
Noise dominated data is calculated using 1-second bins in cleaned event files. If a bin has >2000 counts, and if more than 50% of those come from <1% of pixels, then it is considered to be noise-dominated and hence unusable.
| Quadrant | # 1 sec bins | Bins with >0 counts | Bins with >2000 counts | High rate bins dominated by noise | Noise dominated (total time) | Noise dominated (detector-on time) | Marked lightcurve |
|---|---|---|---|---|---|---|---|
| A | 238802 | 205277 | 0 | 0 | 0.00% | 0.00% |  |
| B | 238802 | 205270 | 0 | 0 | 0.00% | 0.00% |  |
| C | 238802 | 205272 | 0 | 0 | 0.00% | 0.00% |  |
| D | 238802 | 205209 | 0 | 0 | 0.00% | 0.00% |  |
Top three noisy pixels from each quadrant. If the there are fewer than three noisy pixels in the level2.evt file, extra rows are filled as -1
| Pixel properties | Quadrant properties | ||||||
|---|---|---|---|---|---|---|---|
| Quadrant | DetID | PixID | Counts | Sigma | Mean | Median | Sigma |
| A | 0 | 29 | 11498 | 10.87 | 3120 | 2912 | 790.2 |
| A | 7 | 110 | 9729 | 8.63 | 3120 | 2912 | 790.2 |
| A | 9 | 19 | 9447 | 8.27 | 3120 | 2912 | 790.2 |
| B | 2 | 9 | 9915 | 11.91 | 3035 | 2887 | 590.0 |
| B | 3 | 17 | 7519 | 7.85 | 3035 | 2887 | 590.0 |
| B | 14 | 254 | 7518 | 7.85 | 3035 | 2887 | 590.0 |
| C | 12 | 250 | 8782 | 7.14 | 3152 | 2933 | 818.9 |
| C | 1 | 65 | 8605 | 6.93 | 3152 | 2933 | 818.9 |
| C | 12 | 241 | 8399 | 6.67 | 3152 | 2933 | 818.9 |
| D | 4 | 246 | 8435 | 7.45 | 2908 | 2644 | 776.9 |
| D | 6 | 231 | 7452 | 6.19 | 2908 | 2644 | 776.9 |
| D | 3 | 14 | 7341 | 6.05 | 2908 | 2644 | 776.9 |
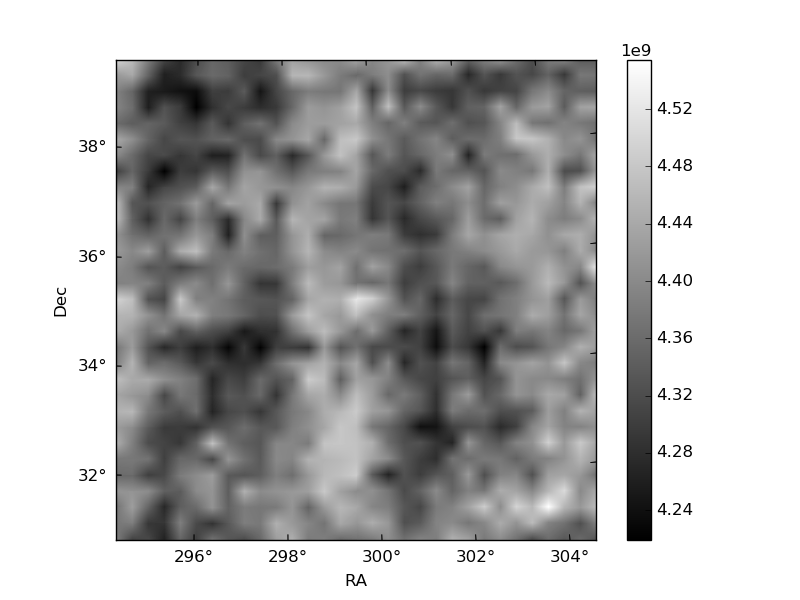
Histogram calculated using DETX and DETY for each event in the final _common_clean file
| Quadrant A | 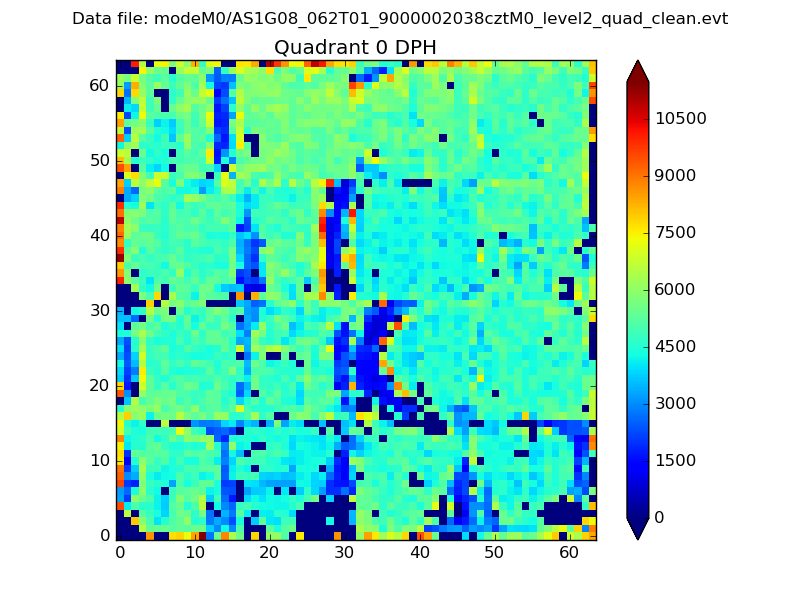 |
 |
Quadrant B |
|---|---|---|---|
| Quadrant D | 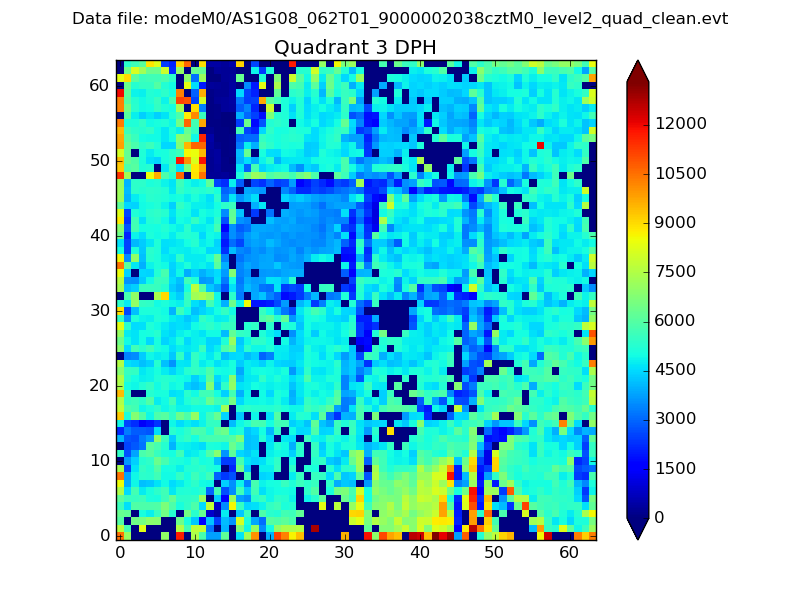 |
 |
Quadrant C |
| Plot type | Count rate plots | Images |
|---|---|---|
| Comparison with Poisson distribution Blue bars denote a histogram of data divided into 1 sec bins. Red curve is a Poisson curve with rate = median count rate of data. |
 |
 |
| Quadrant-wise count rates Data is divided into 100 sec bins |
 |
|
| Module-wise count rates for Quadrant A Data is divided into 100 sec bins |
 |
 |
| Module-wise count rates for Quadrant B Data is divided into 100 sec bins |
 |
 |
| Module-wise count rates for Quadrant C Data is divided into 100 sec bins |
 |
 |
| Module-wise count rates for Quadrant D Data is divided into 100 sec bins |
 |
 |
| Parameter | Plot |
|---|---|
| CZT HV Monitor |  |
| D_VDD |  |
| Temperature 1 | 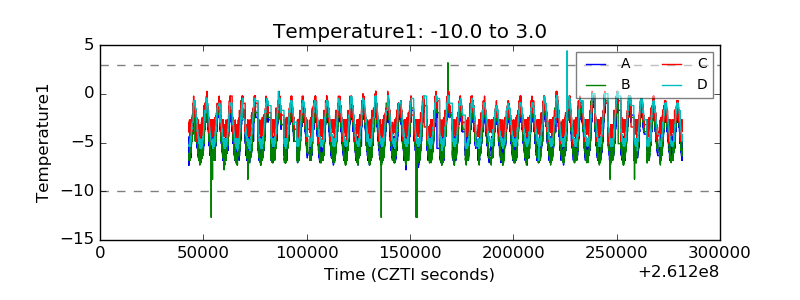 |
| Veto HV Monitor |  |
| Veto LLD |  |
| Alpha Counter |  |
| _CPM_Rate |  |
| CZT Counter |  |
| +2.5 Volts monitor |  |
| +5 Volts monitor |  |
| _ROLL_ROT |  |
| _Roll_DEC |  |
| _Roll_RA |  |
| Veto Counter |  |