| Param | Original file | Final file |
|---|---|---|
| Filename | modeM0/AS1G08_062T01_9000002038_13729cztM0_level2.evt | modeM0/AS1G08_062T01_9000002038_13729cztM0_level2_quad_clean.evt |
| Size (bytes) | 638,040,960 | 110,217,600 |
| Size | 608.5 MB | 105.1 MB |
| Events in quadrant A | 4,189,507 | 679,972 |
| Events in quadrant B | 4,658,385 | 662,277 |
| Events in quadrant C | 4,316,256 | 708,122 |
| Events in quadrant D | 5,568,823 | 683,511 |
| Mode M9 | |||
|---|---|---|---|
| Quadrant | BADHDUFLAG | Total packets | Discarded packets |
| A | 0 | 12 | 0 |
| B | 0 | 12 | 0 |
| C | 0 | 12 | 0 |
| D | 0 | 12 | 0 |
| Mode M0 | |||
|---|---|---|---|
| Quadrant | BADHDUFLAG | Total packets | Discarded packets |
| A | 0 | 17903 | 3 |
| B | 0 | 19297 | 2 |
| C | 0 | 17976 | 2 |
| D | 0 | 22112 | 2 |
| Mode SS | |||
|---|---|---|---|
| Quadrant | BADHDUFLAG | Total packets | Discarded packets |
| A | 0 | 178 | 0 |
| B | 0 | 178 | 0 |
| C | 0 | 178 | 0 |
| D | 0 | 178 | 0 |
| Quadrant | Total seconds | Saturated seconds | Saturation percentage |
|---|---|---|---|
| A | 8702 | 98 | 1.126178% |
| B | 8702 | 157 | 1.804183% |
| C | 8702 | 98 | 1.126178% |
| D | 8702 | 620 | 7.124799% |
Noise dominated data is calculated using 1-second bins in cleaned event files. If a bin has >2000 counts, and if more than 50% of those come from <1% of pixels, then it is considered to be noise-dominated and hence unusable.
| Quadrant | # 1 sec bins | Bins with >0 counts | Bins with >2000 counts | High rate bins dominated by noise | Noise dominated (total time) | Noise dominated (detector-on time) | Marked lightcurve |
|---|---|---|---|---|---|---|---|
| A | 9888 | 8705 | 5 | 5 | 0.05% | 0.06% | 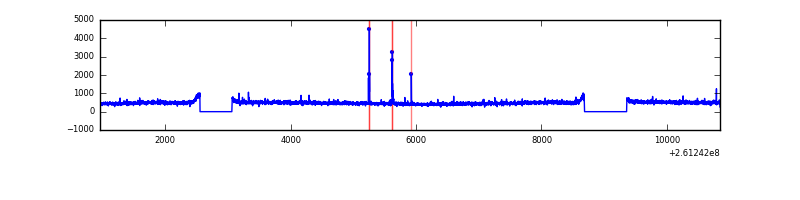 |
| B | 9888 | 8705 | 20 | 20 | 0.20% | 0.23% | 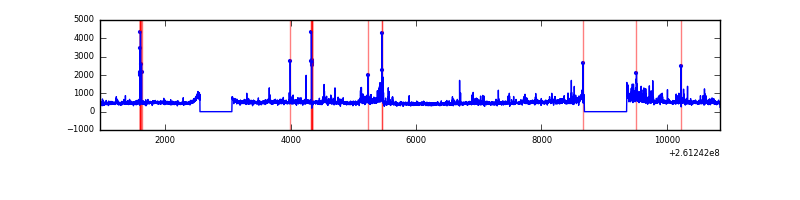 |
| C | 9888 | 8705 | 6 | 6 | 0.06% | 0.07% | 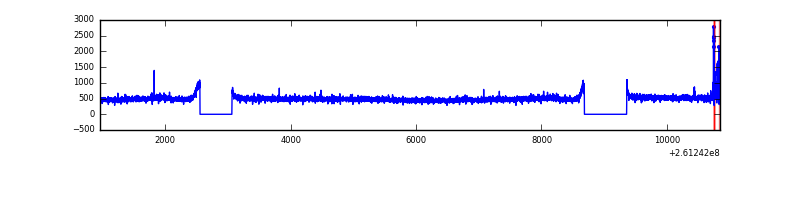 |
| D | 9888 | 8705 | 261 | 261 | 2.64% | 3.00% | 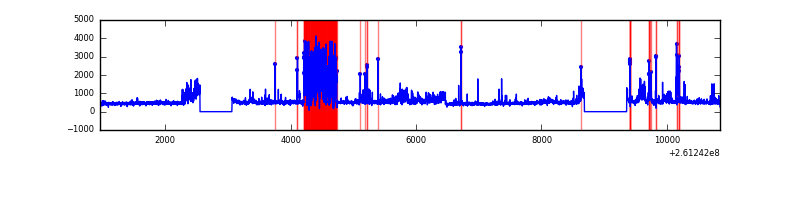 |
Top three noisy pixels from each quadrant. If the there are fewer than three noisy pixels in the level2.evt file, extra rows are filled as -1
| Pixel properties | Quadrant properties | ||||||
|---|---|---|---|---|---|---|---|
| Quadrant | DetID | PixID | Counts | Sigma | Mean | Median | Sigma |
| A | 15 | 69 | 40488 | 178.25 | 1074 | 1051 | 221.2 |
| A | 1 | 162 | 16973 | 71.97 | 1074 | 1051 | 221.2 |
| A | 0 | 226 | 9364 | 37.57 | 1074 | 1051 | 221.2 |
| B | 0 | 219 | 128726 | 628.21 | 1060 | 1035 | 203.3 |
| B | 4 | 173 | 101252 | 493.04 | 1060 | 1035 | 203.3 |
| B | 10 | 246 | 86560 | 420.76 | 1060 | 1035 | 203.3 |
| C | 3 | 233 | 176312 | 715.67 | 1048 | 1055 | 244.9 |
| C | 4 | 254 | 48197 | 192.51 | 1048 | 1055 | 244.9 |
| C | 13 | 61 | 7529 | 26.44 | 1048 | 1055 | 244.9 |
| D | 5 | 222 | 1442143 | 5868.12 | 1009 | 981 | 245.6 |
| D | 8 | 195 | 158163 | 640.01 | 1009 | 981 | 245.6 |
| D | 1 | 52 | 71329 | 286.44 | 1009 | 981 | 245.6 |
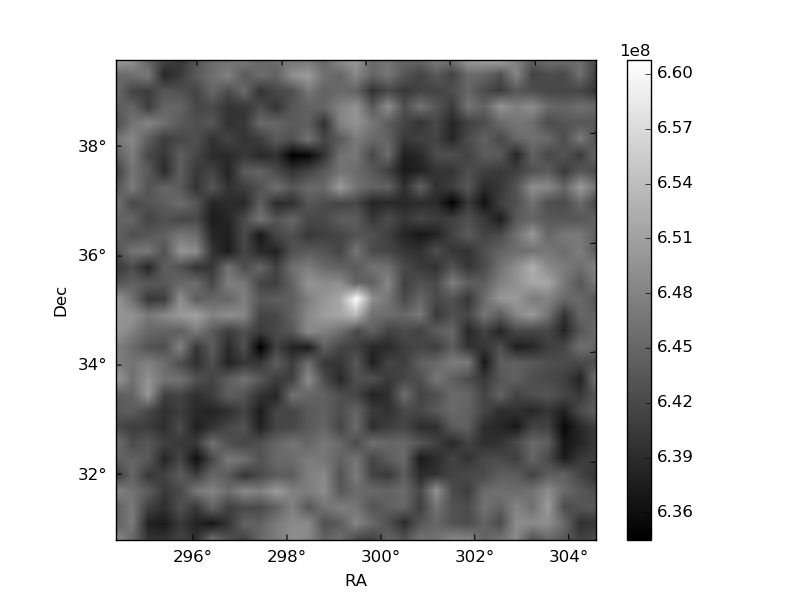
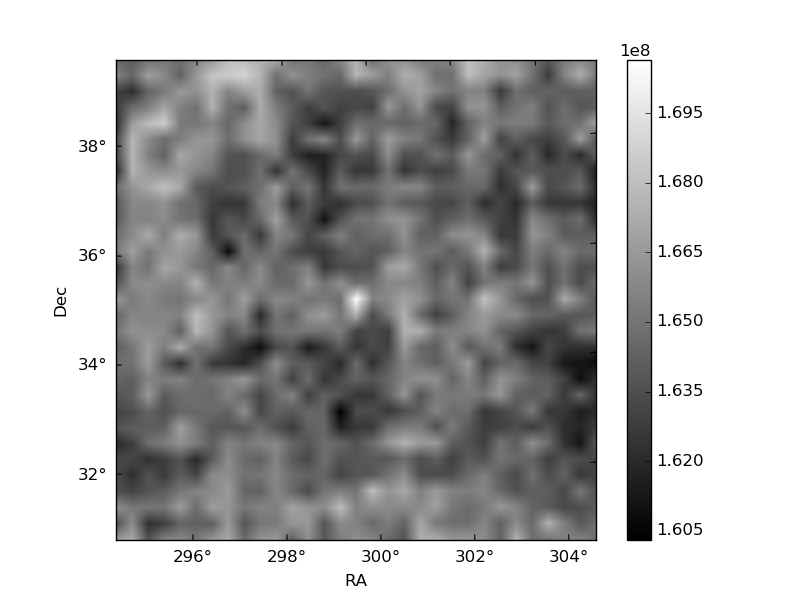
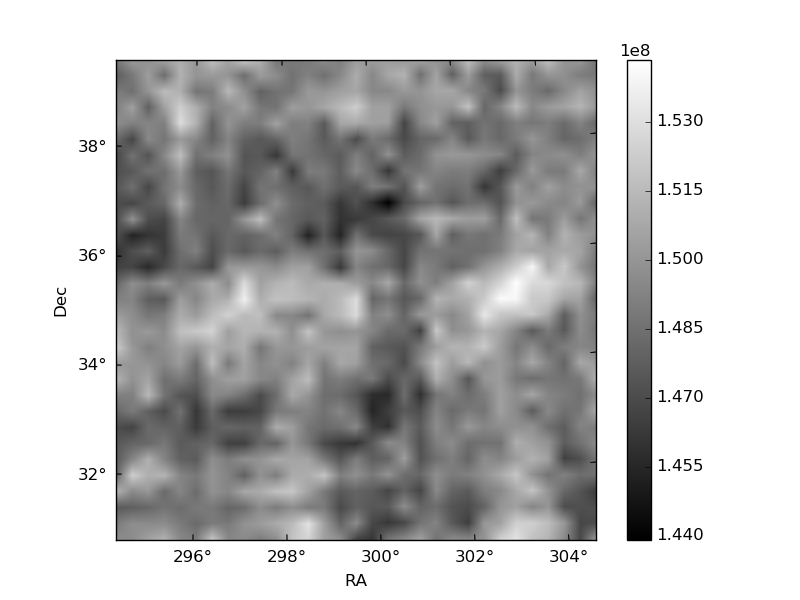
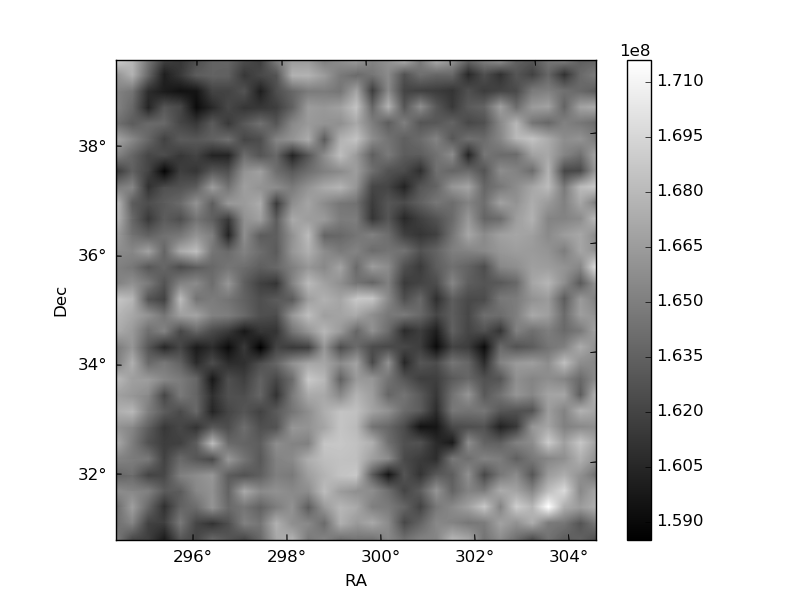
Histogram calculated using DETX and DETY for each event in the final _common_clean file
| Quadrant A | 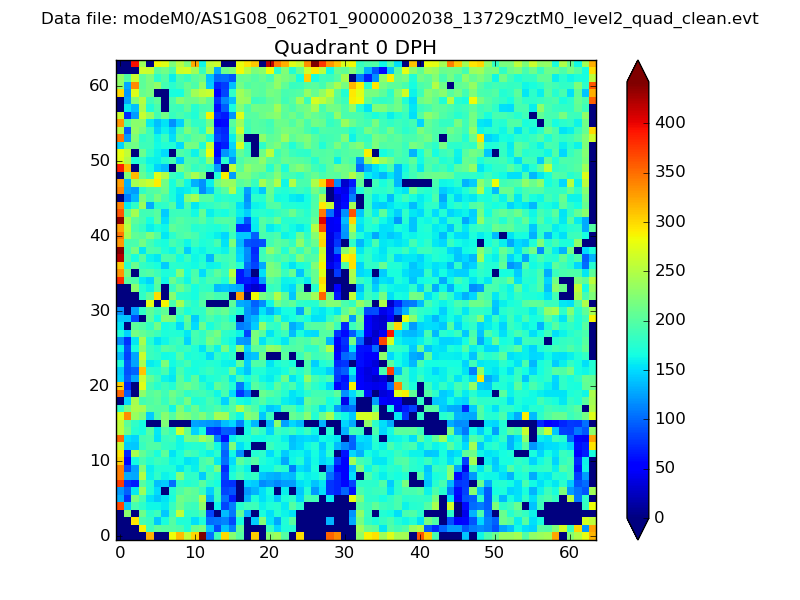 |
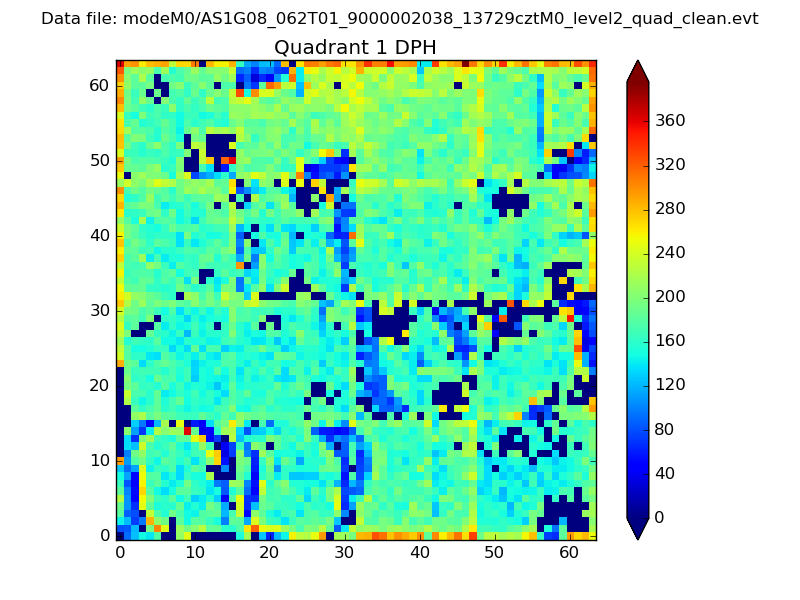 |
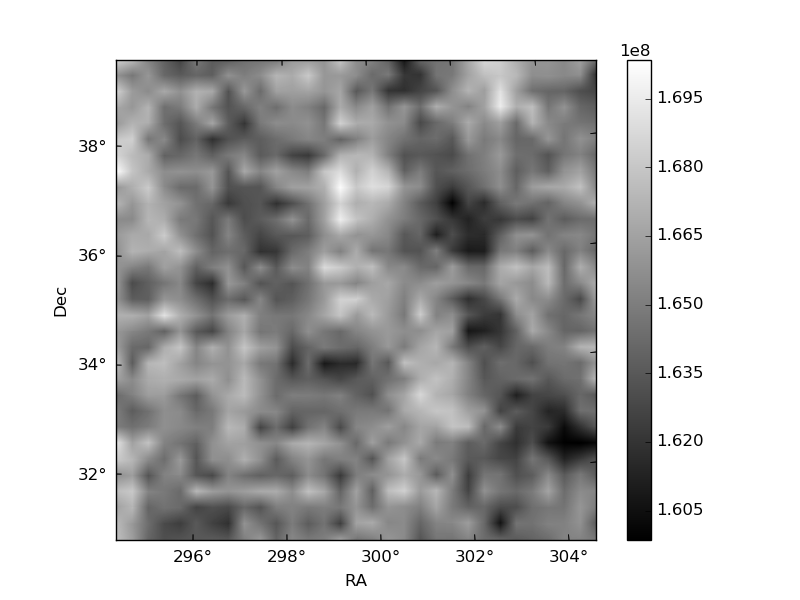
Quadrant B |
|---|---|---|---|
| Quadrant D | 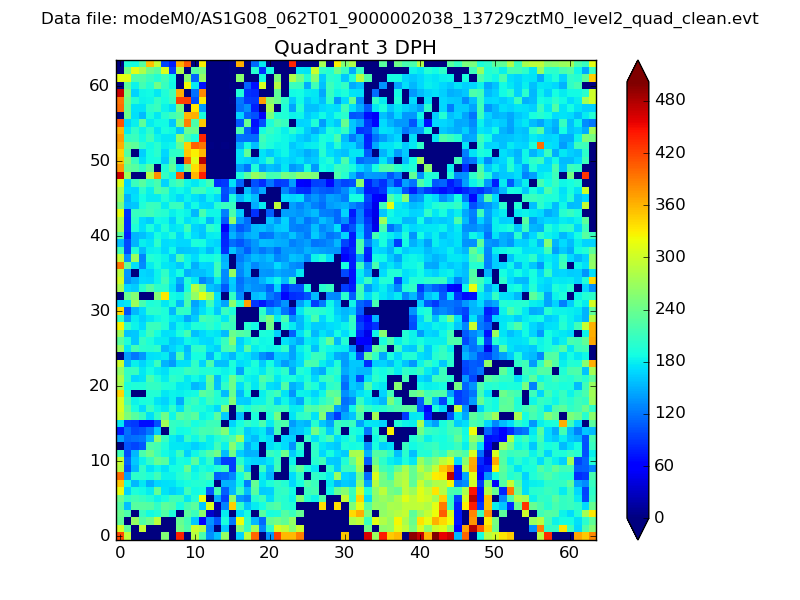 |
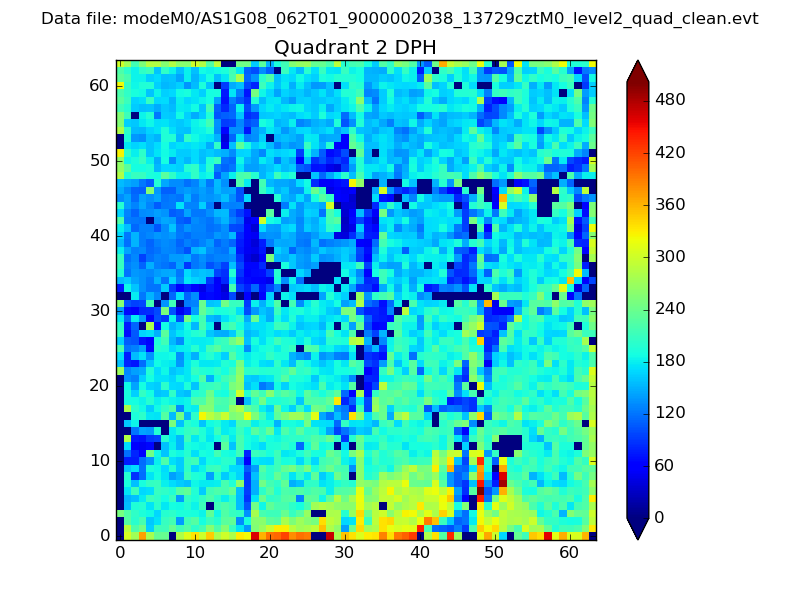 |
Quadrant C |
| Plot type | Count rate plots | Images |
|---|---|---|
| Comparison with Poisson distribution Blue bars denote a histogram of data divided into 1 sec bins. Red curve is a Poisson curve with rate = median count rate of data. |
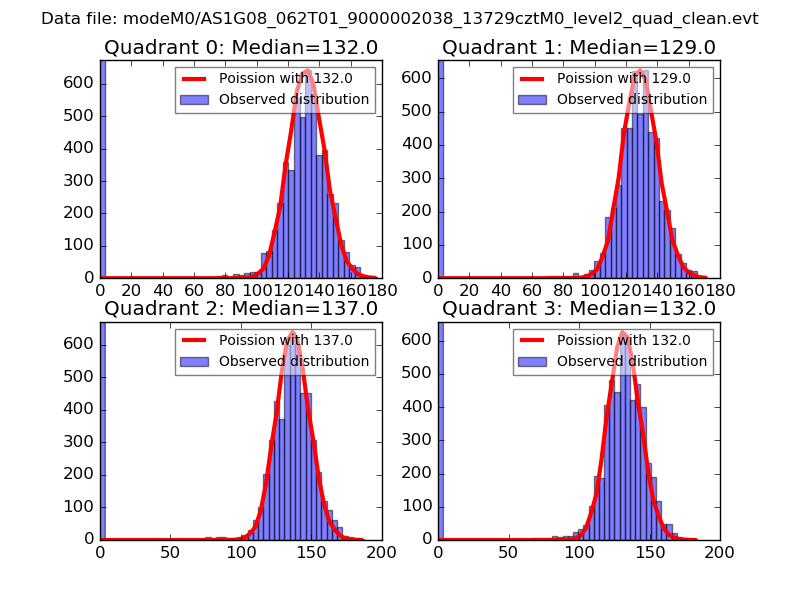 |
 |
| Quadrant-wise count rates Data is divided into 100 sec bins |
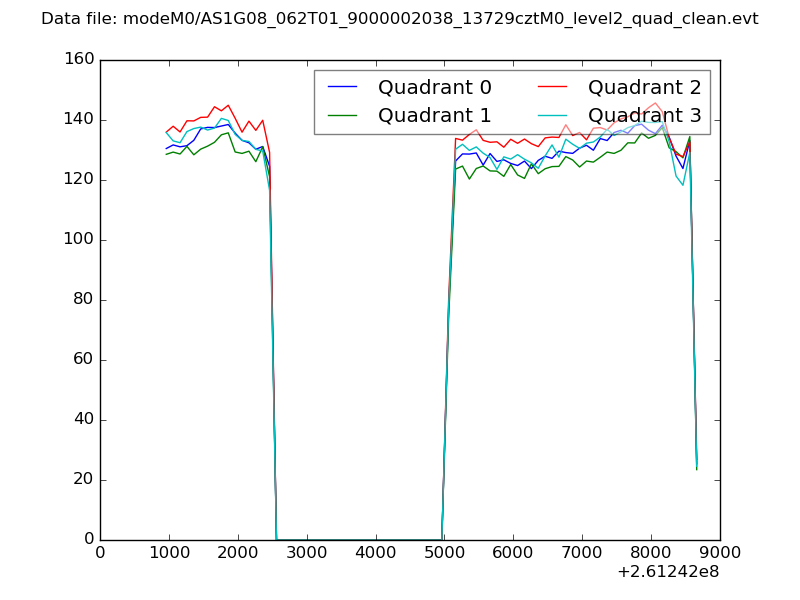 |
|
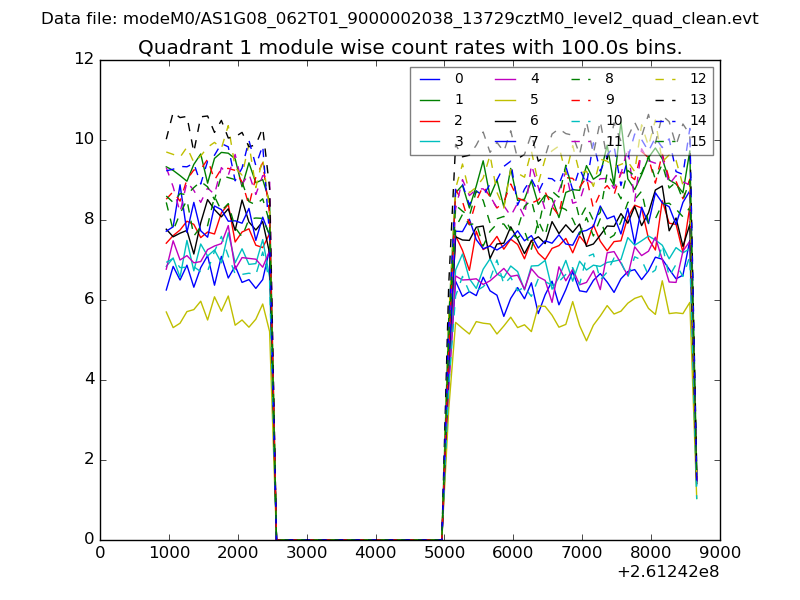
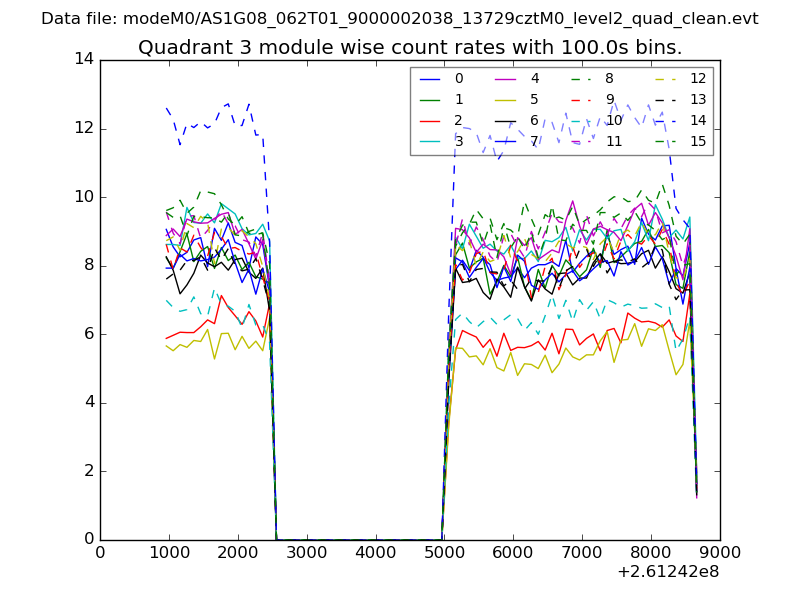
| Module-wise count rates for Quadrant A Data is divided into 100 sec bins |
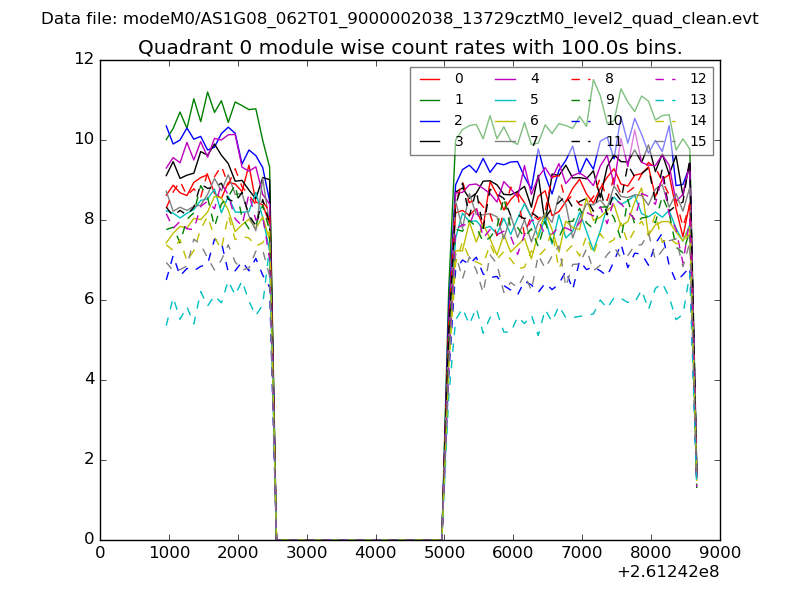 |
 |
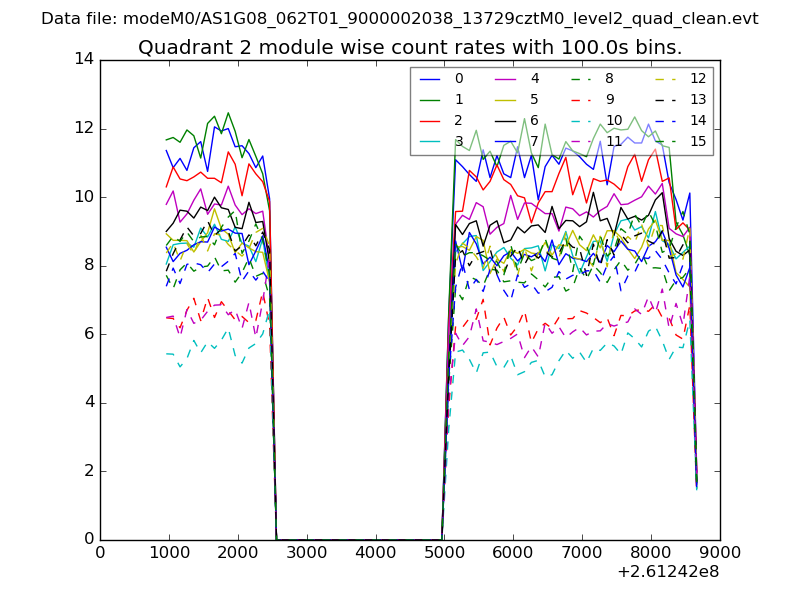
| Module-wise count rates for Quadrant B Data is divided into 100 sec bins |
 |
 |
| Module-wise count rates for Quadrant C Data is divided into 100 sec bins |
 |
 |
| Module-wise count rates for Quadrant D Data is divided into 100 sec bins |
 |
 |
| Parameter | Plot |
|---|---|
| CZT HV Monitor | 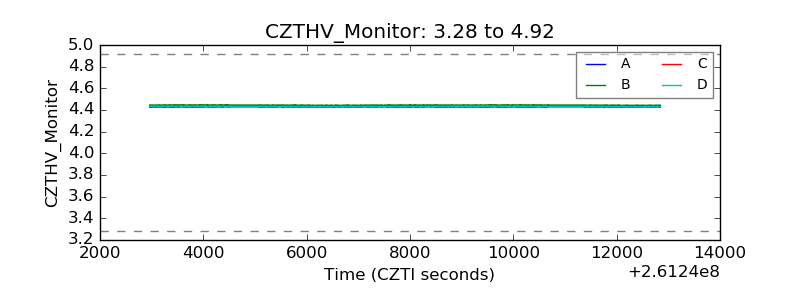 |
| D_VDD | 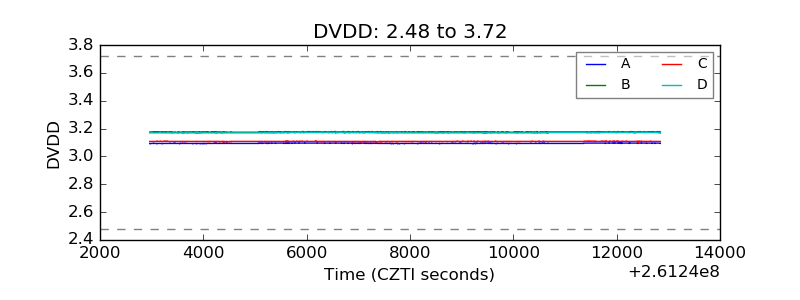 |
| Temperature 1 | 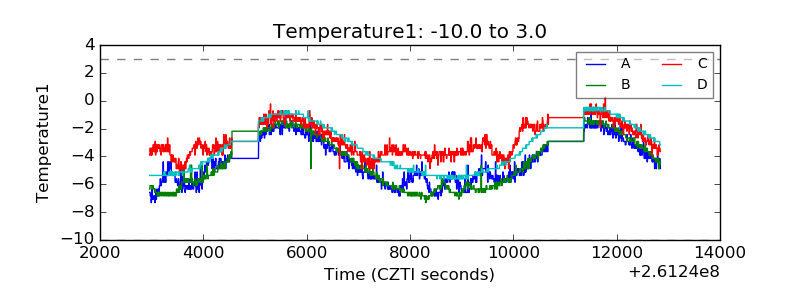 |
| Veto HV Monitor | 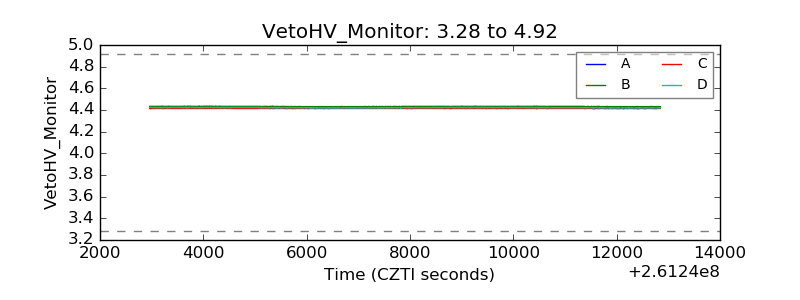 |
| Veto LLD | 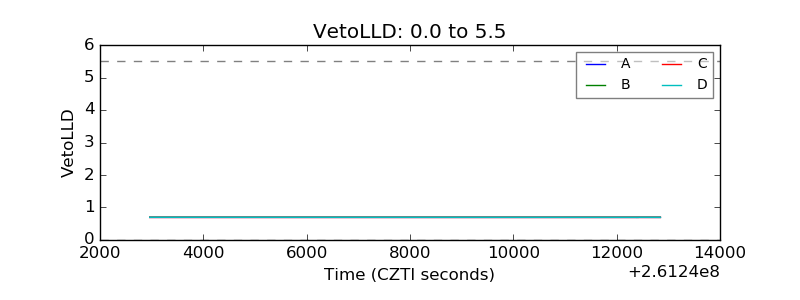 |
| Alpha Counter | 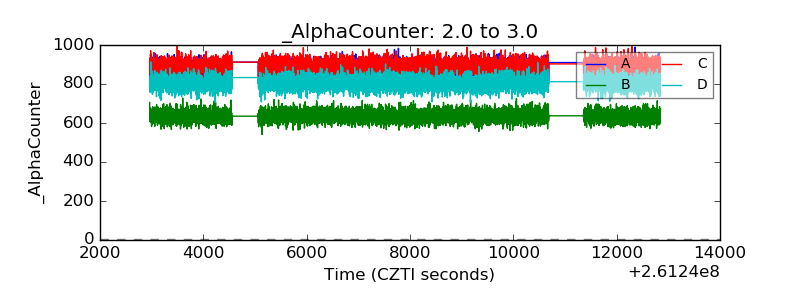 |
| _CPM_Rate | 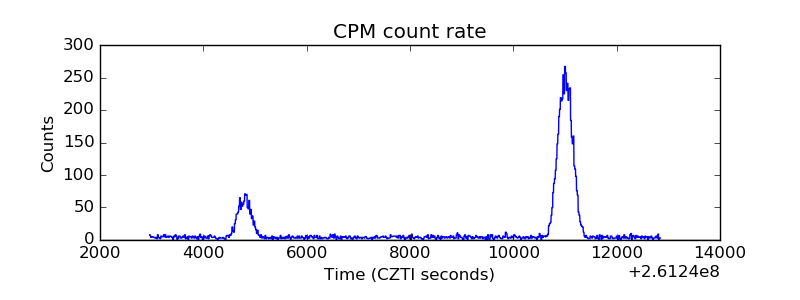 |
| CZT Counter | 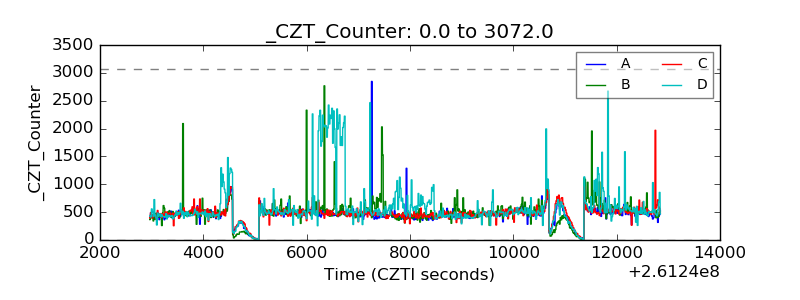 |
| +2.5 Volts monitor |  |
| +5 Volts monitor | 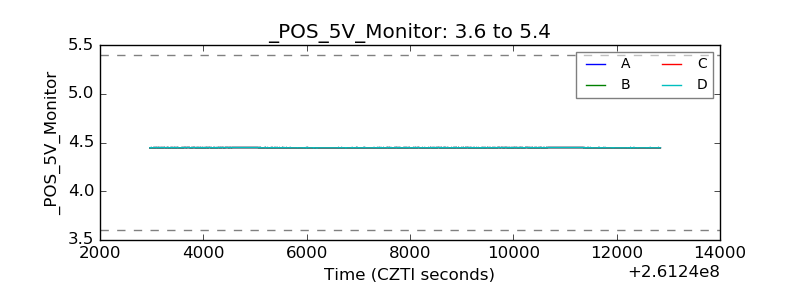 |
| _ROLL_ROT | 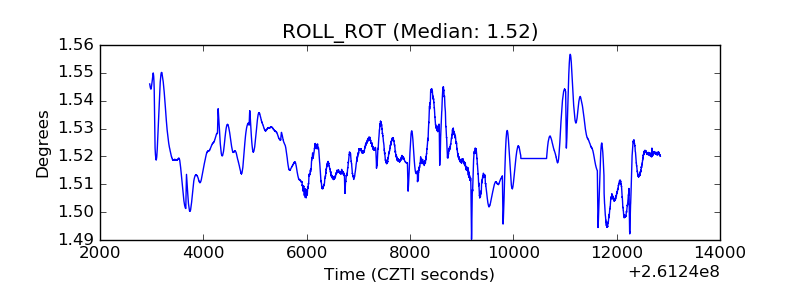 |
| _Roll_DEC | 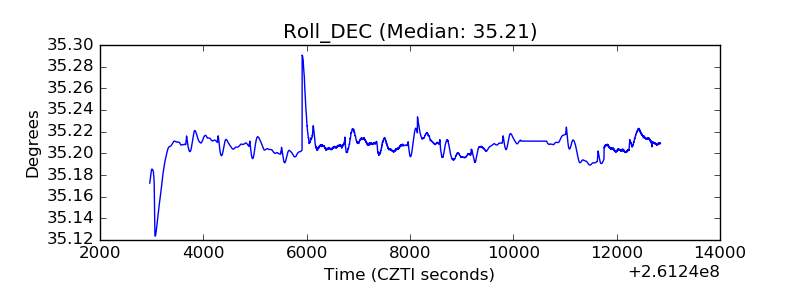 |
| _Roll_RA | 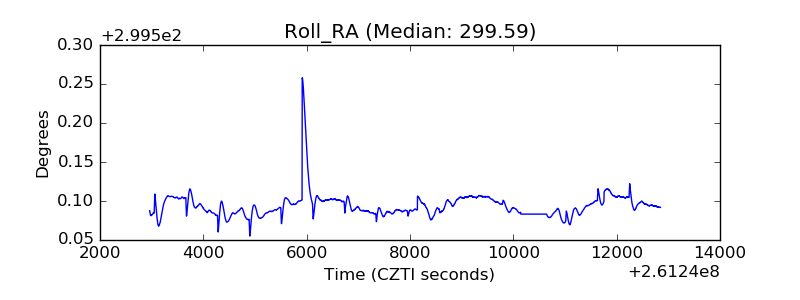 |
| Veto Counter | 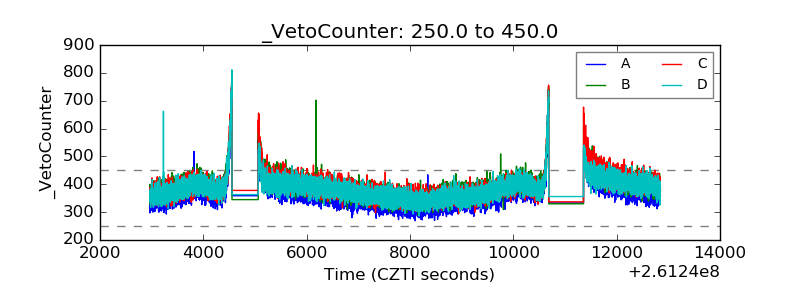 |