| Param | Original file | Final file |
|---|---|---|
| Filename | modeM0/AS1G08_062T01_9000002038_13730cztM0_level2.evt | modeM0/AS1G08_062T01_9000002038_13730cztM0_level2_quad_clean.evt |
| Size (bytes) | 526,017,600 | 85,800,960 |
| Size | 501.6 MB | 81.8 MB |
| Events in quadrant A | 3,436,957 | 526,785 |
| Events in quadrant B | 3,902,570 | 515,243 |
| Events in quadrant C | 4,311,525 | 537,023 |
| Events in quadrant D | 3,806,409 | 533,475 |
| Mode M9 | |||
|---|---|---|---|
| Quadrant | BADHDUFLAG | Total packets | Discarded packets |
| A | 0 | 15 | 0 |
| B | 0 | 15 | 0 |
| C | 0 | 15 | 0 |
| D | 0 | 15 | 0 |
| Mode M0 | |||
|---|---|---|---|
| Quadrant | BADHDUFLAG | Total packets | Discarded packets |
| A | 0 | 14712 | 3 |
| B | 0 | 16086 | 2 |
| C | 0 | 16954 | 2 |
| D | 0 | 15858 | 2 |
| Mode SS | |||
|---|---|---|---|
| Quadrant | BADHDUFLAG | Total packets | Discarded packets |
| A | 0 | 144 | 0 |
| B | 0 | 144 | 0 |
| C | 0 | 144 | 0 |
| D | 0 | 144 | 0 |
| Quadrant | Total seconds | Saturated seconds | Saturation percentage |
|---|---|---|---|
| A | 6969 | 77 | 1.104893% |
| B | 6969 | 168 | 2.410676% |
| C | 6969 | 265 | 3.802554% |
| D | 6969 | 133 | 1.908452% |
Noise dominated data is calculated using 1-second bins in cleaned event files. If a bin has >2000 counts, and if more than 50% of those come from <1% of pixels, then it is considered to be noise-dominated and hence unusable.
| Quadrant | # 1 sec bins | Bins with >0 counts | Bins with >2000 counts | High rate bins dominated by noise | Noise dominated (total time) | Noise dominated (detector-on time) | Marked lightcurve |
|---|---|---|---|---|---|---|---|
| A | 8500 | 6972 | 5 | 5 | 0.06% | 0.07% | 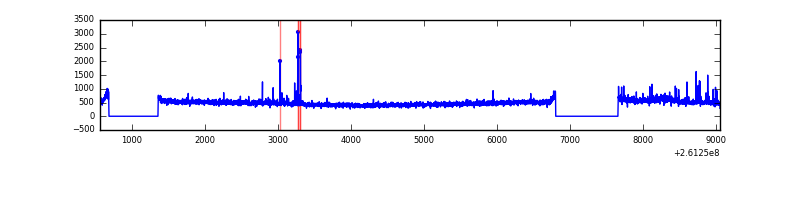 |
| B | 8500 | 6972 | 26 | 26 | 0.31% | 0.37% | 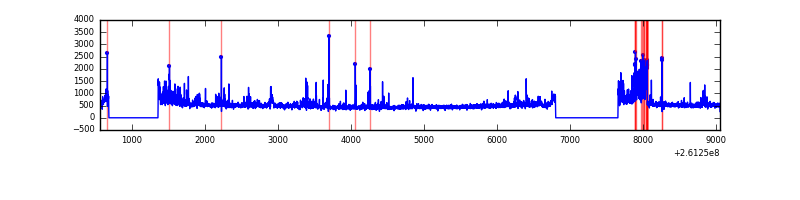 |
| C | 8500 | 6972 | 179 | 179 | 2.11% | 2.57% | 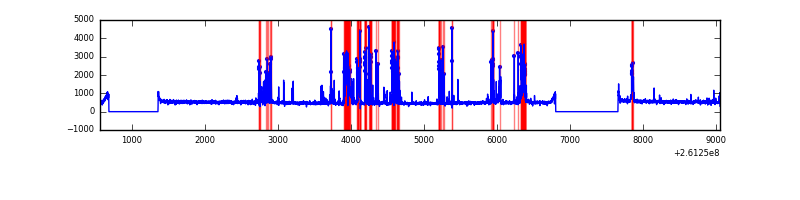 |
| D | 8500 | 6972 | 39 | 39 | 0.46% | 0.56% | 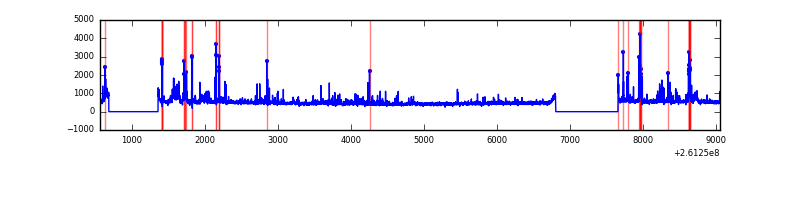 |
Top three noisy pixels from each quadrant. If the there are fewer than three noisy pixels in the level2.evt file, extra rows are filled as -1
| Pixel properties | Quadrant properties | ||||||
|---|---|---|---|---|---|---|---|
| Quadrant | DetID | PixID | Counts | Sigma | Mean | Median | Sigma |
| A | 15 | 69 | 47116 | 258.18 | 865 | 846 | 179.2 |
| A | 15 | 157 | 39592 | 216.2 | 865 | 846 | 179.2 |
| A | 1 | 162 | 17361 | 92.15 | 865 | 846 | 179.2 |
| B | 15 | 33 | 165825 | 1000.94 | 854 | 833 | 164.8 |
| B | 0 | 219 | 107141 | 644.93 | 854 | 833 | 164.8 |
| B | 10 | 246 | 81527 | 489.54 | 854 | 833 | 164.8 |
| C | 4 | 254 | 871771 | 4391.32 | 842 | 847 | 198.3 |
| C | 3 | 233 | 148276 | 743.36 | 842 | 847 | 198.3 |
| C | 14 | 234 | 6315 | 27.57 | 842 | 847 | 198.3 |
| D | 5 | 222 | 274909 | 1334.59 | 847 | 824 | 205.4 |
| D | 1 | 52 | 132490 | 641.12 | 847 | 824 | 205.4 |
| D | 8 | 195 | 119737 | 579.02 | 847 | 824 | 205.4 |
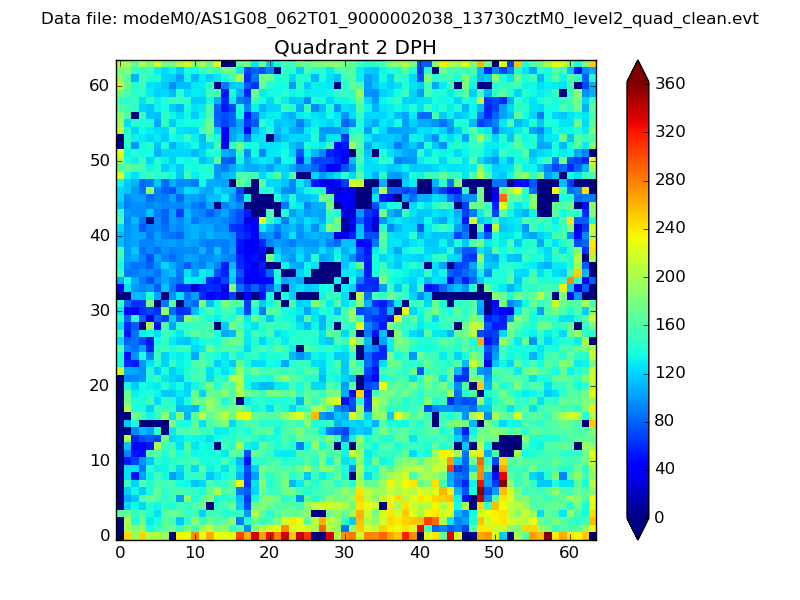
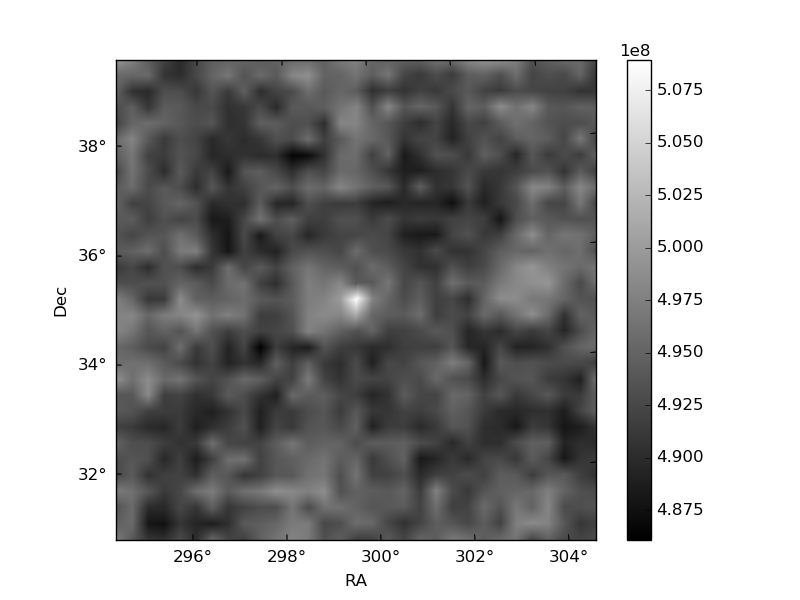
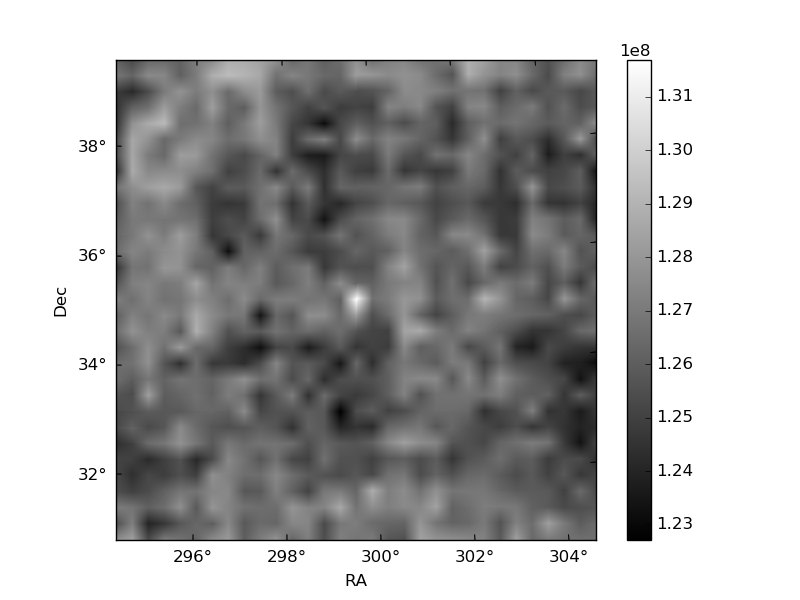
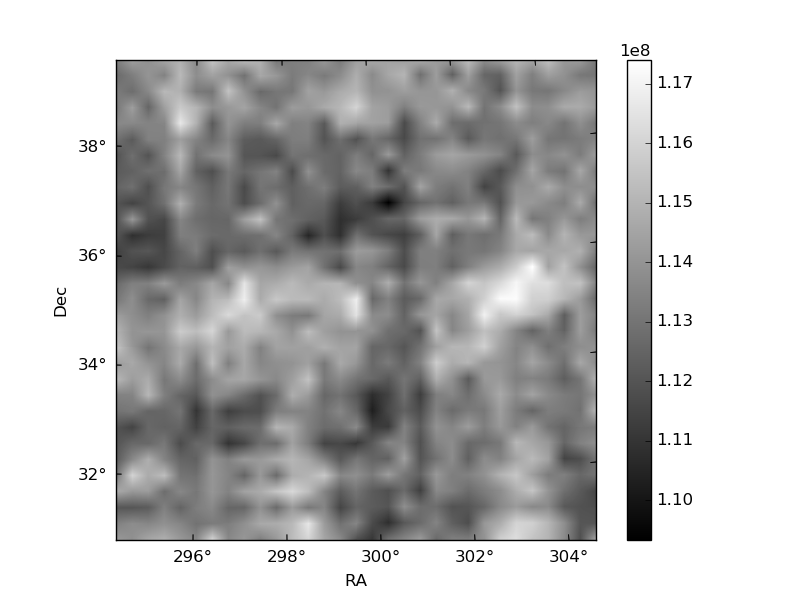
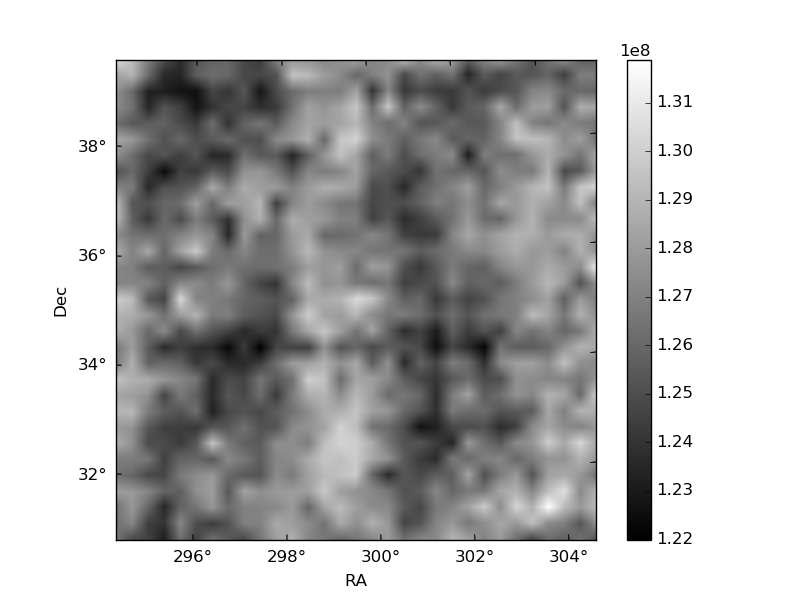
Histogram calculated using DETX and DETY for each event in the final _common_clean file
| Quadrant A | 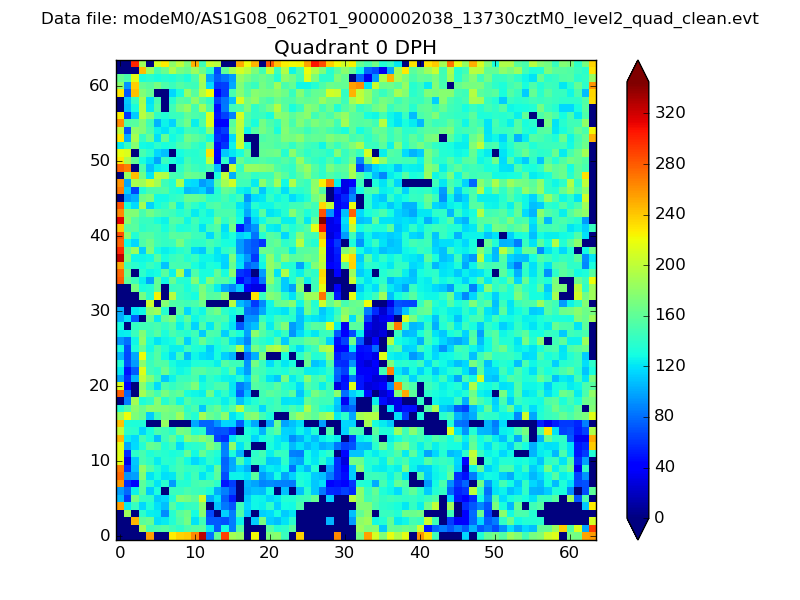 |
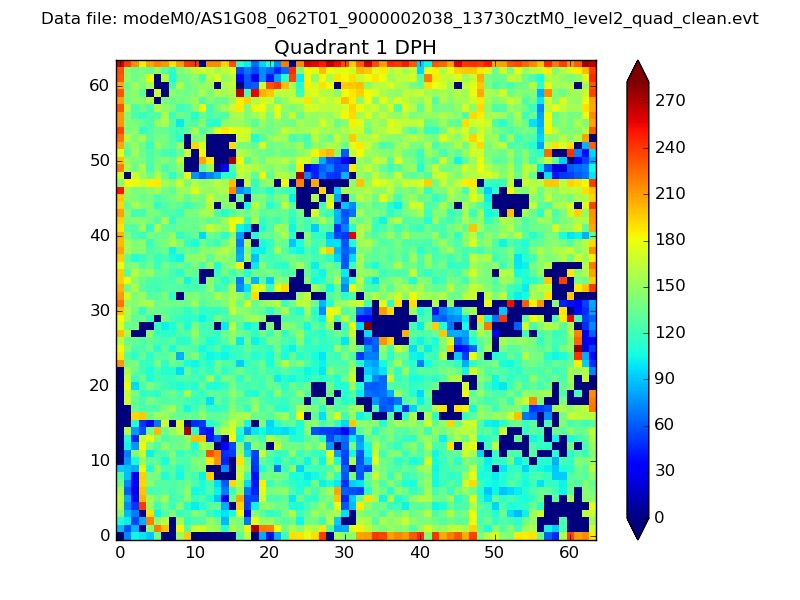 |
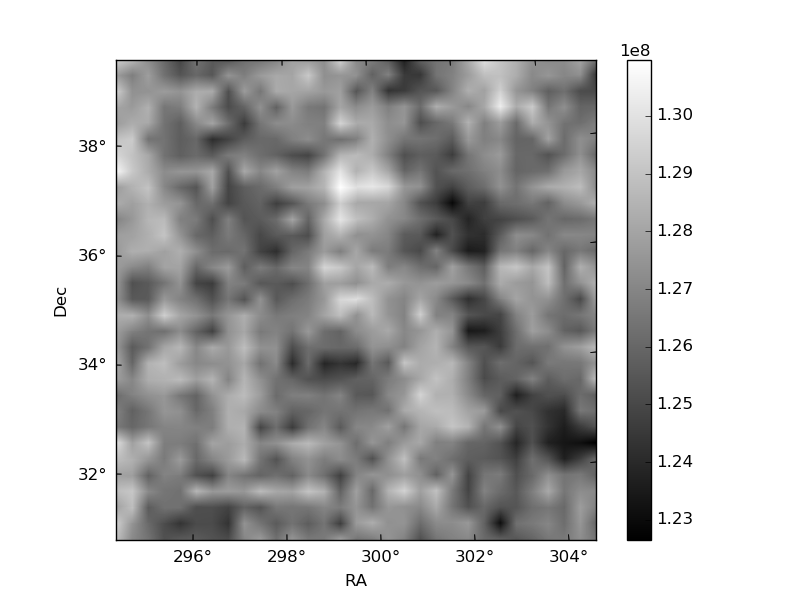
Quadrant B |
|---|---|---|---|
| Quadrant D | 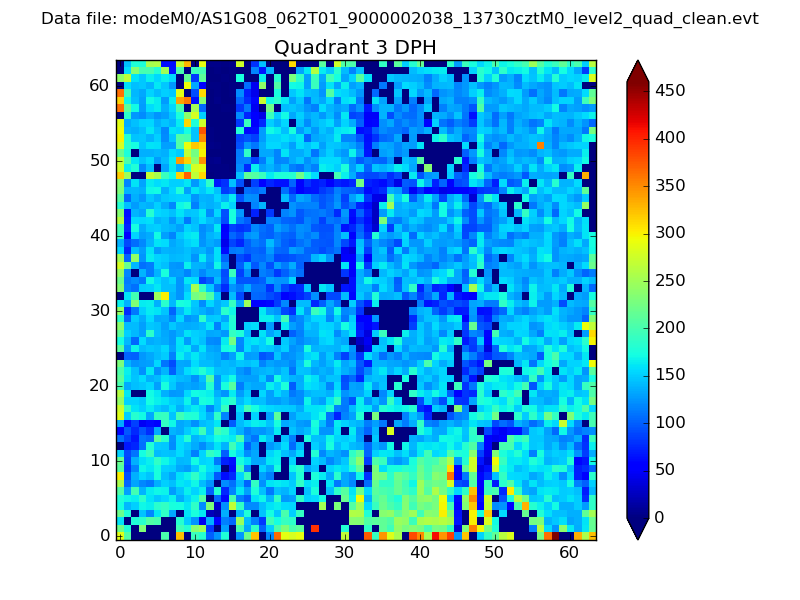 |
 |
Quadrant C |
| Plot type | Count rate plots | Images |
|---|---|---|
| Comparison with Poisson distribution Blue bars denote a histogram of data divided into 1 sec bins. Red curve is a Poisson curve with rate = median count rate of data. |
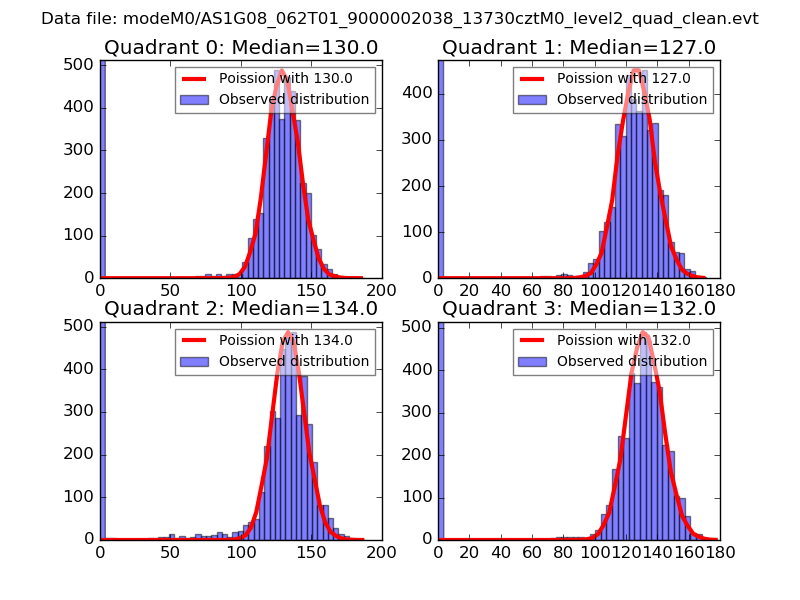 |
 |
| Quadrant-wise count rates Data is divided into 100 sec bins |
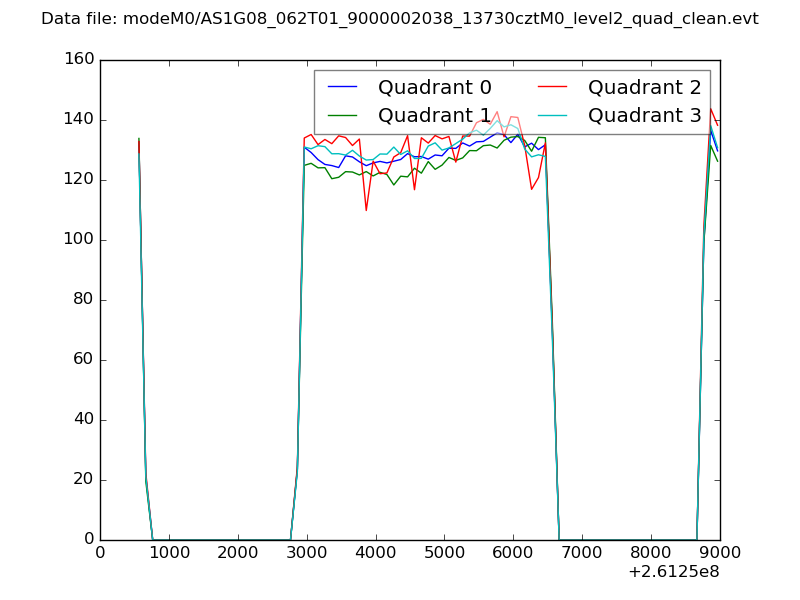 |
|
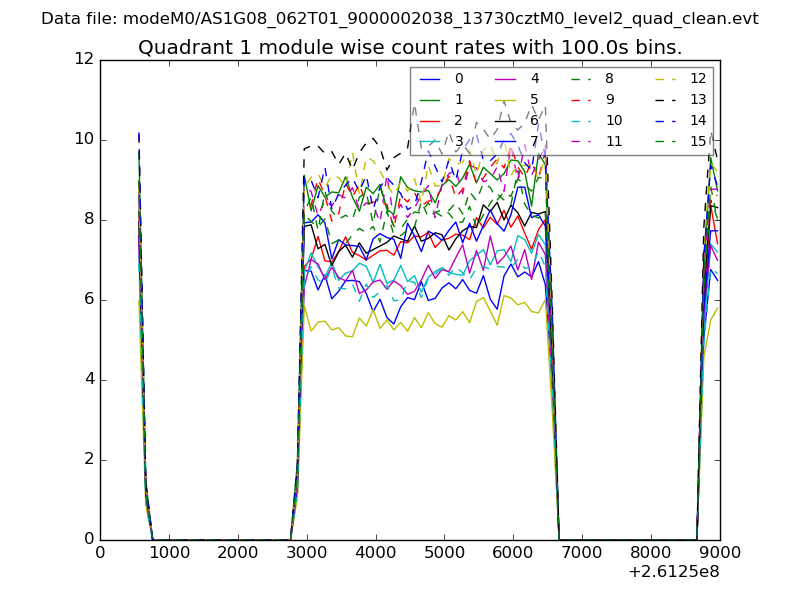
| Module-wise count rates for Quadrant A Data is divided into 100 sec bins |
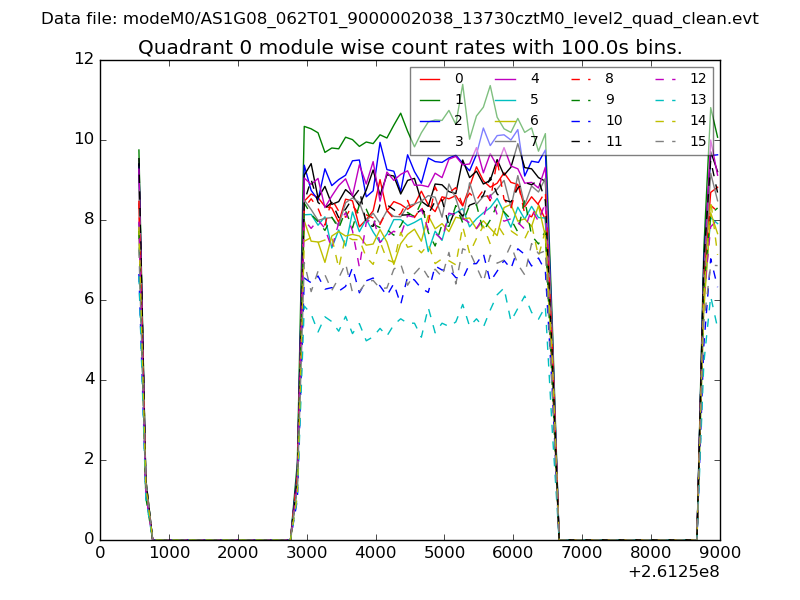 |
 |
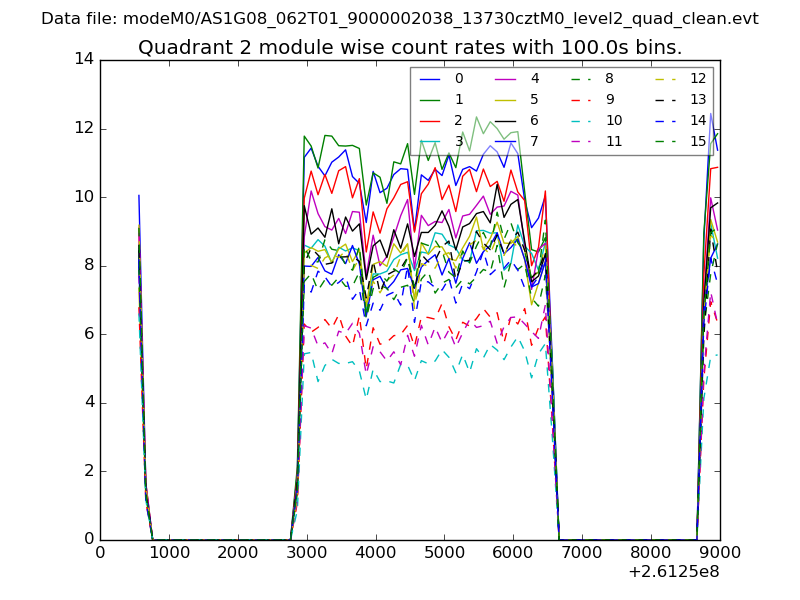
| Module-wise count rates for Quadrant B Data is divided into 100 sec bins |
 |
 |
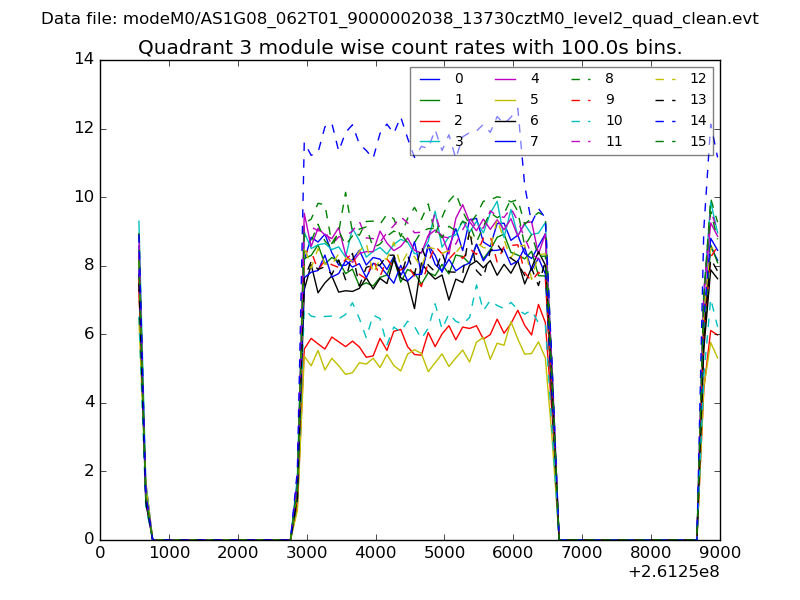
| Module-wise count rates for Quadrant C Data is divided into 100 sec bins |
 |
 |
| Module-wise count rates for Quadrant D Data is divided into 100 sec bins |
 |
 |
| Parameter | Plot |
|---|---|
| CZT HV Monitor | 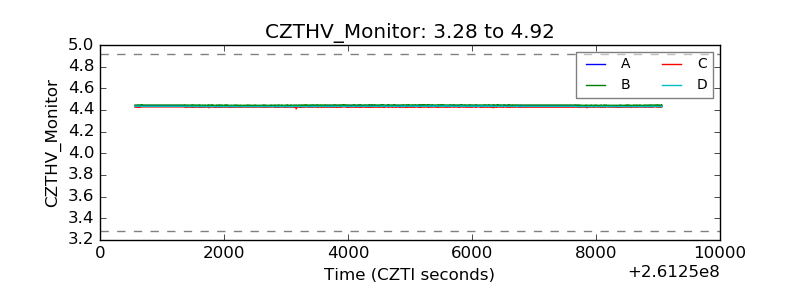 |
| D_VDD | 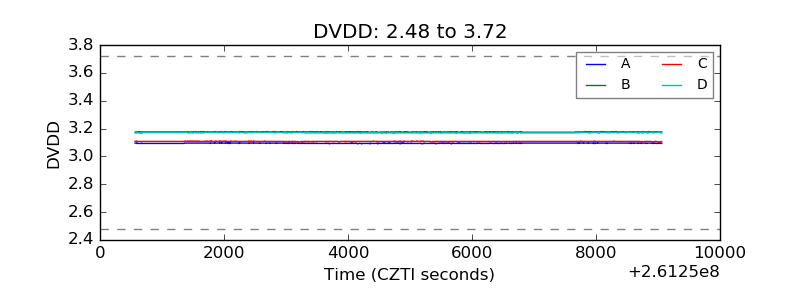 |
| Temperature 1 | 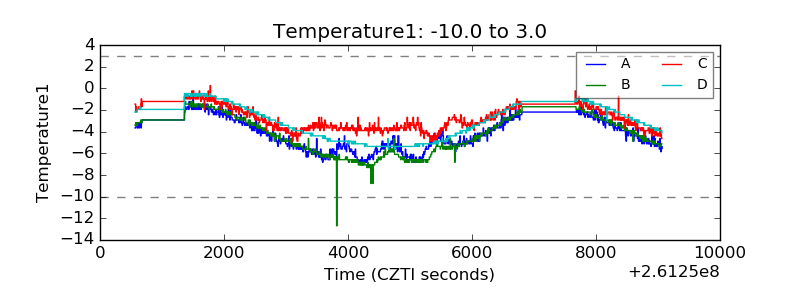 |
| Veto HV Monitor | 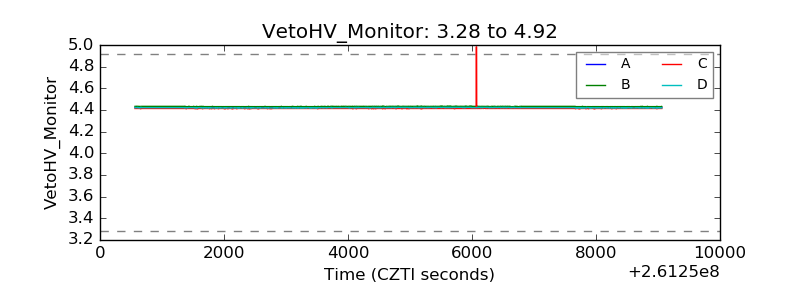 |
| Veto LLD | 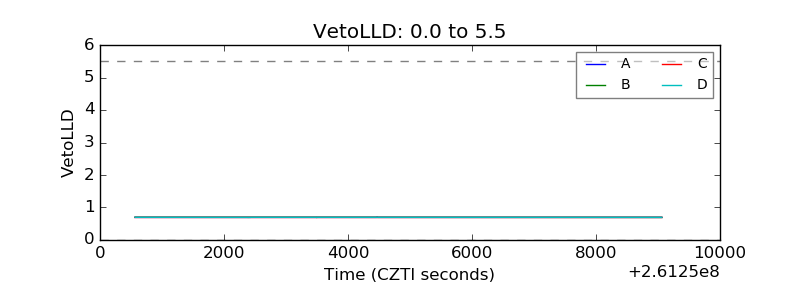 |
| Alpha Counter | 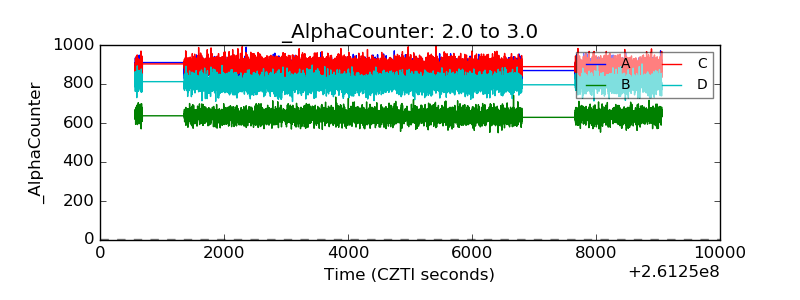 |
| _CPM_Rate | 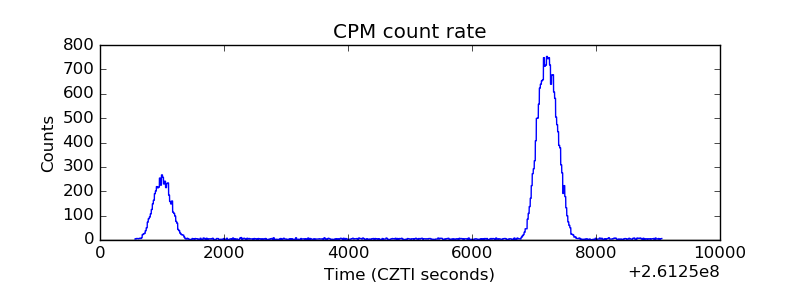 |
| CZT Counter | 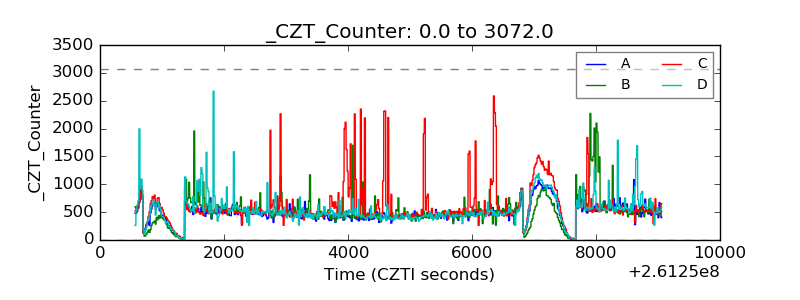 |
| +2.5 Volts monitor |  |
| +5 Volts monitor | 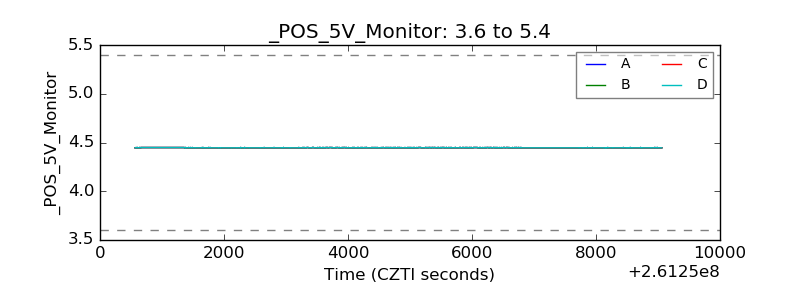 |
| _ROLL_ROT | 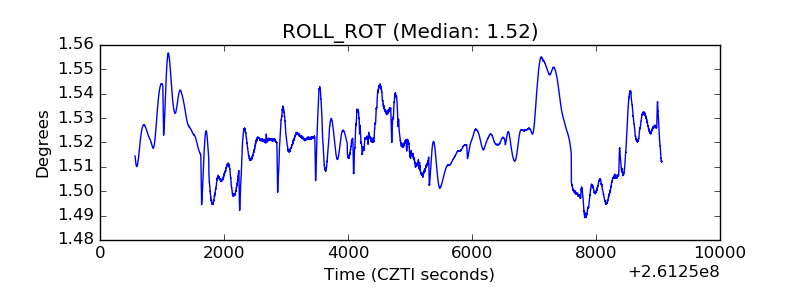 |
| _Roll_DEC | 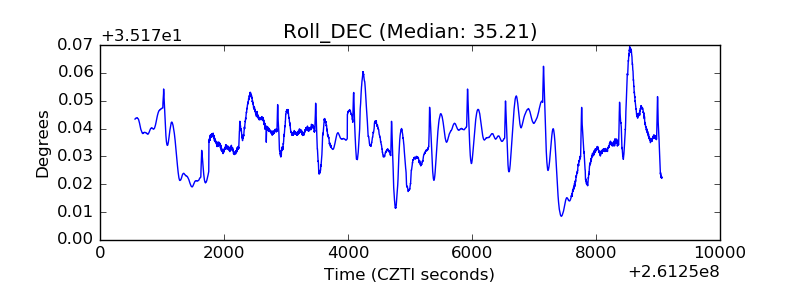 |
| _Roll_RA | 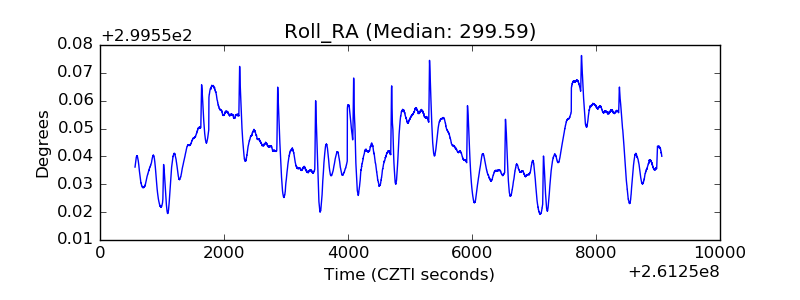 |
| Veto Counter | 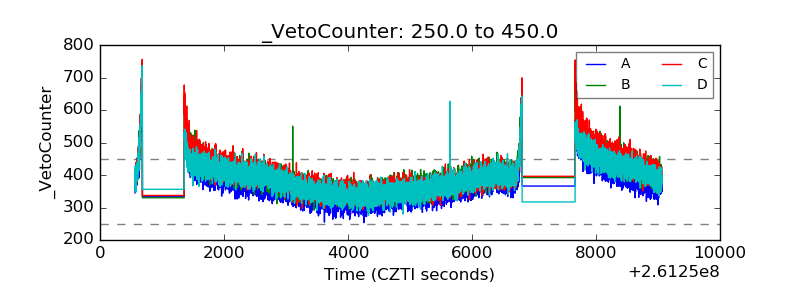 |