| Param | Original file | Final file |
|---|---|---|
| Filename | modeM0/AS1G08_062T01_9000002038_13733cztM0_level2.evt | modeM0/AS1G08_062T01_9000002038_13733cztM0_level2_quad_clean.evt |
| Size (bytes) | 537,563,520 | 100,987,200 |
| Size | 512.7 MB | 96.3 MB |
| Events in quadrant A | 3,161,358 | 653,345 |
| Events in quadrant B | 3,593,197 | 646,595 |
| Events in quadrant C | 4,740,297 | 653,311 |
| Events in quadrant D | 4,346,703 | 653,875 |
| Mode M9 | |||
|---|---|---|---|
| Quadrant | BADHDUFLAG | Total packets | Discarded packets |
| A | 0 | 13 | 0 |
| B | 0 | 13 | 0 |
| C | 0 | 13 | 0 |
| D | 0 | 14 | 0 |
| Mode M0 | |||
|---|---|---|---|
| Quadrant | BADHDUFLAG | Total packets | Discarded packets |
| A | 0 | 13676 | 3 |
| B | 0 | 15091 | 2 |
| C | 0 | 18447 | 2 |
| D | 0 | 17169 | 2 |
| Mode SS | |||
|---|---|---|---|
| Quadrant | BADHDUFLAG | Total packets | Discarded packets |
| A | 0 | 130 | 0 |
| B | 0 | 130 | 0 |
| C | 0 | 130 | 0 |
| D | 0 | 130 | 0 |
| Quadrant | Total seconds | Saturated seconds | Saturation percentage |
|---|---|---|---|
| A | 6472 | 38 | 0.587145% |
| B | 6472 | 97 | 1.498764% |
| C | 6472 | 487 | 7.524722% |
| D | 6472 | 292 | 4.511743% |
Noise dominated data is calculated using 1-second bins in cleaned event files. If a bin has >2000 counts, and if more than 50% of those come from <1% of pixels, then it is considered to be noise-dominated and hence unusable.
| Quadrant | # 1 sec bins | Bins with >0 counts | Bins with >2000 counts | High rate bins dominated by noise | Noise dominated (total time) | Noise dominated (detector-on time) | Marked lightcurve |
|---|---|---|---|---|---|---|---|
| A | 7633 | 6475 | 7 | 7 | 0.09% | 0.11% | 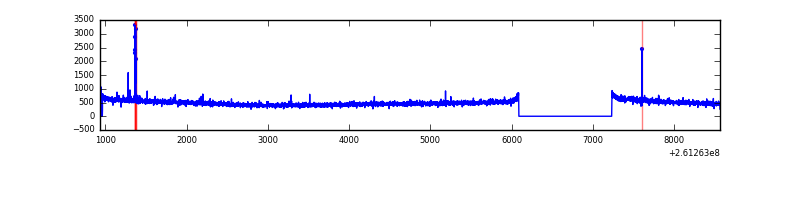 |
| B | 7633 | 6475 | 27 | 27 | 0.35% | 0.42% | 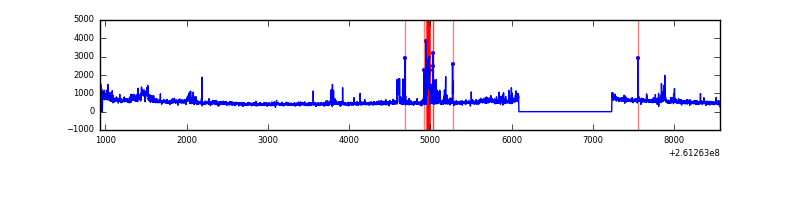 |
| C | 7633 | 6475 | 329 | 329 | 4.31% | 5.08% | 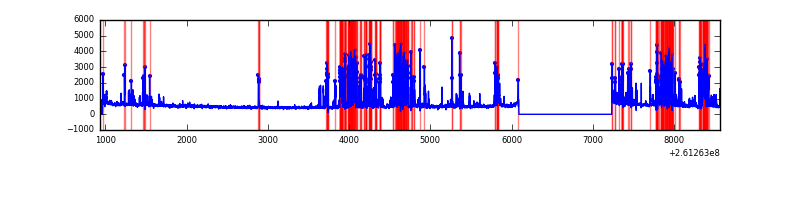 |
| D | 7633 | 6475 | 174 | 174 | 2.28% | 2.69% | 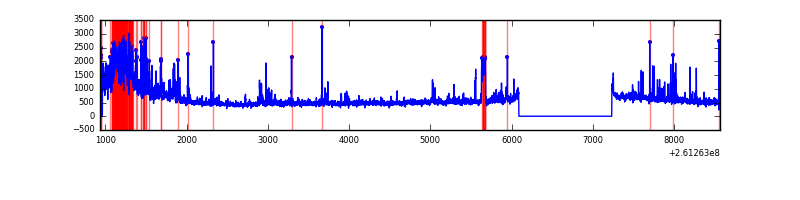 |
Top three noisy pixels from each quadrant. If the there are fewer than three noisy pixels in the level2.evt file, extra rows are filled as -1
| Pixel properties | Quadrant properties | ||||||
|---|---|---|---|---|---|---|---|
| Quadrant | DetID | PixID | Counts | Sigma | Mean | Median | Sigma |
| A | 15 | 69 | 30805 | 182.29 | 811 | 794 | 164.6 |
| A | 1 | 162 | 9294 | 51.63 | 811 | 794 | 164.6 |
| A | 0 | 226 | 7247 | 39.2 | 811 | 794 | 164.6 |
| B | 0 | 219 | 147565 | 962.71 | 810 | 792 | 152.5 |
| B | 3 | 64 | 104844 | 682.49 | 810 | 792 | 152.5 |
| B | 8 | 250 | 74349 | 482.47 | 810 | 792 | 152.5 |
| C | 4 | 254 | 1583055 | 8676.94 | 782 | 785 | 182.4 |
| C | 3 | 233 | 96334 | 523.98 | 782 | 785 | 182.4 |
| C | 4 | 238 | 7864 | 38.82 | 782 | 785 | 182.4 |
| D | 1 | 52 | 790203 | 3768.8 | 783 | 768 | 209.5 |
| D | 8 | 195 | 257641 | 1226.32 | 783 | 768 | 209.5 |
| D | 10 | 157 | 229599 | 1092.45 | 783 | 768 | 209.5 |
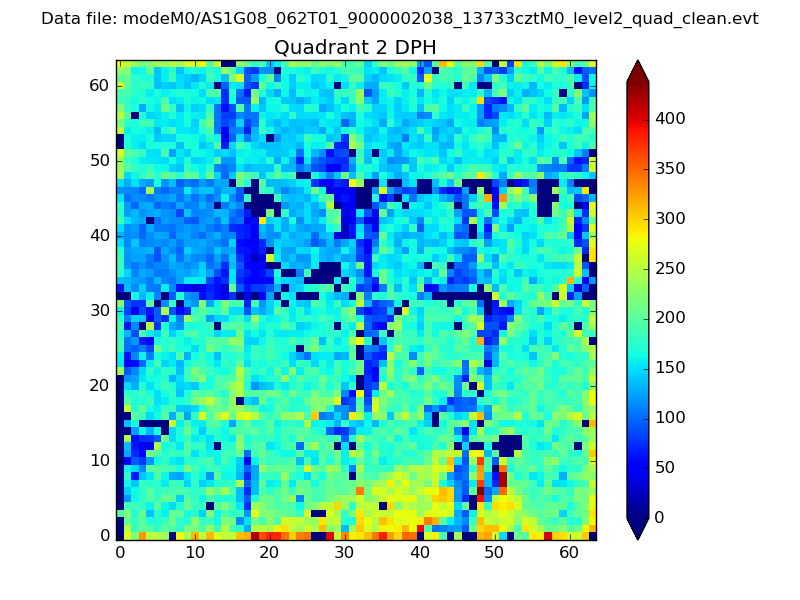
Histogram calculated using DETX and DETY for each event in the final _common_clean file
| Quadrant A | 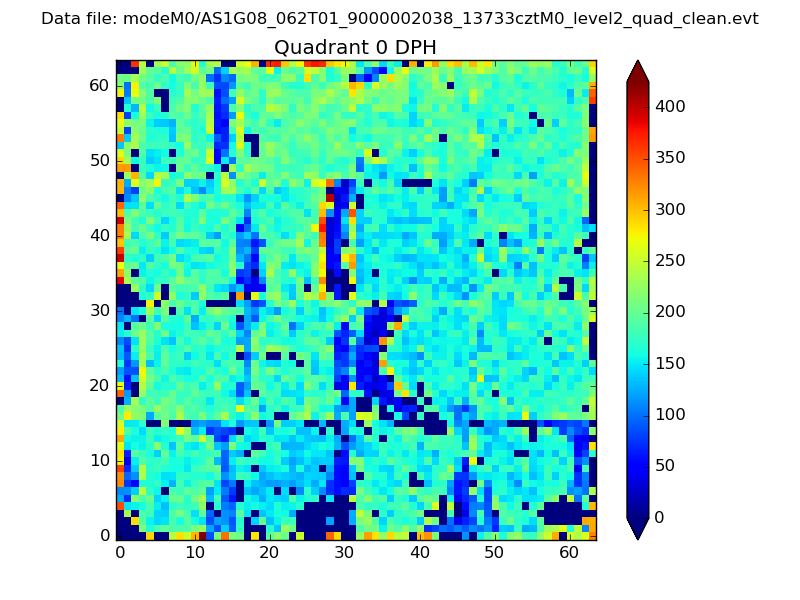 |
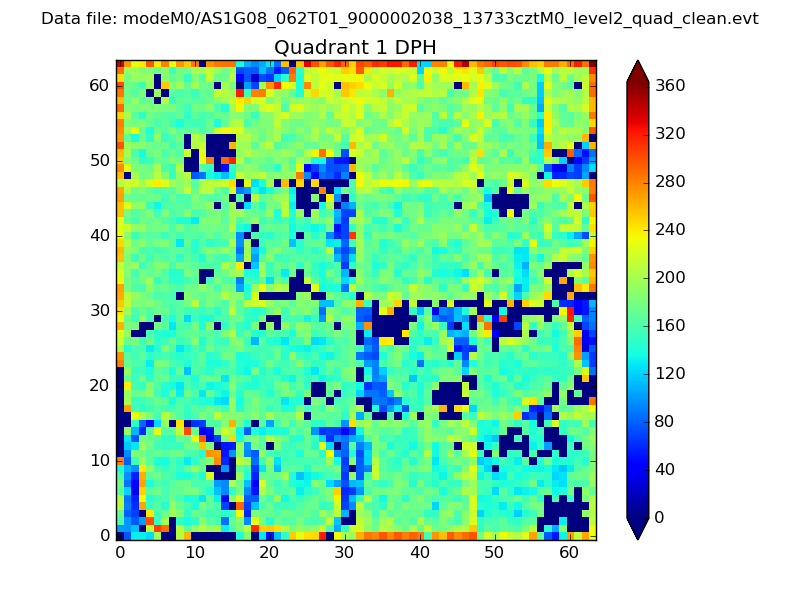 |
Quadrant B |
|---|---|---|---|
| Quadrant D | 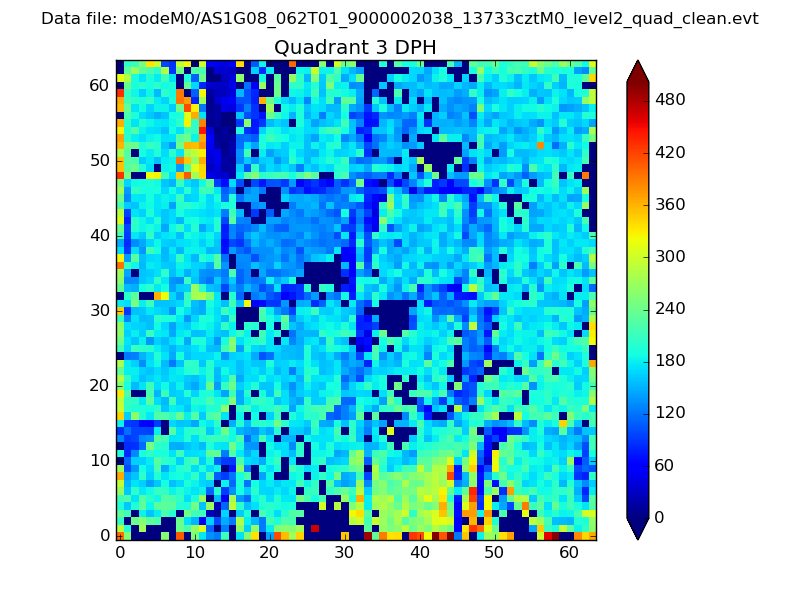 |
 |
Quadrant C |
| Plot type | Count rate plots | Images |
|---|---|---|
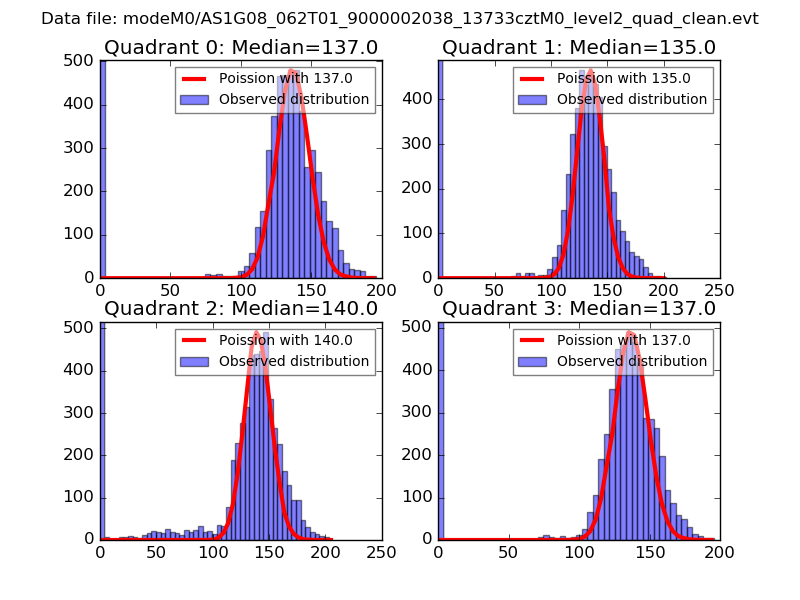
| Comparison with Poisson distribution Blue bars denote a histogram of data divided into 1 sec bins. Red curve is a Poisson curve with rate = median count rate of data. |
 |
 |
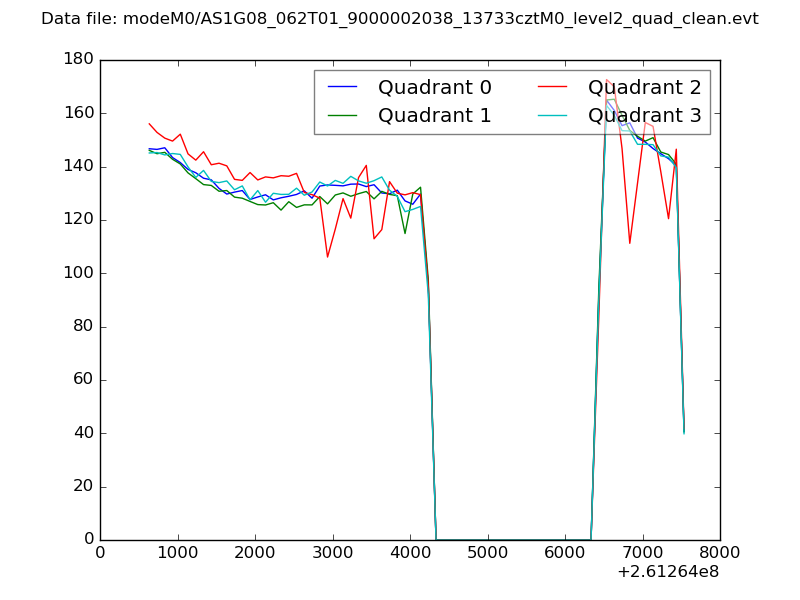
| Quadrant-wise count rates Data is divided into 100 sec bins |
 |
|
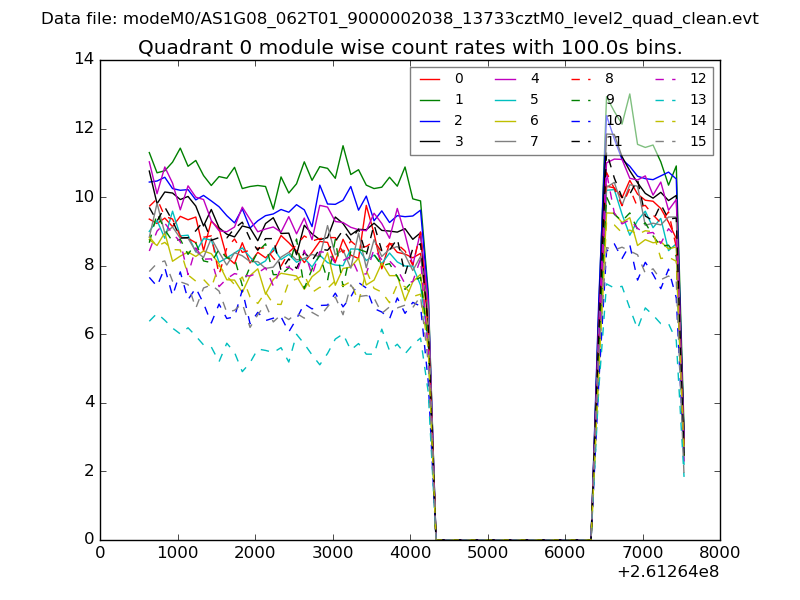
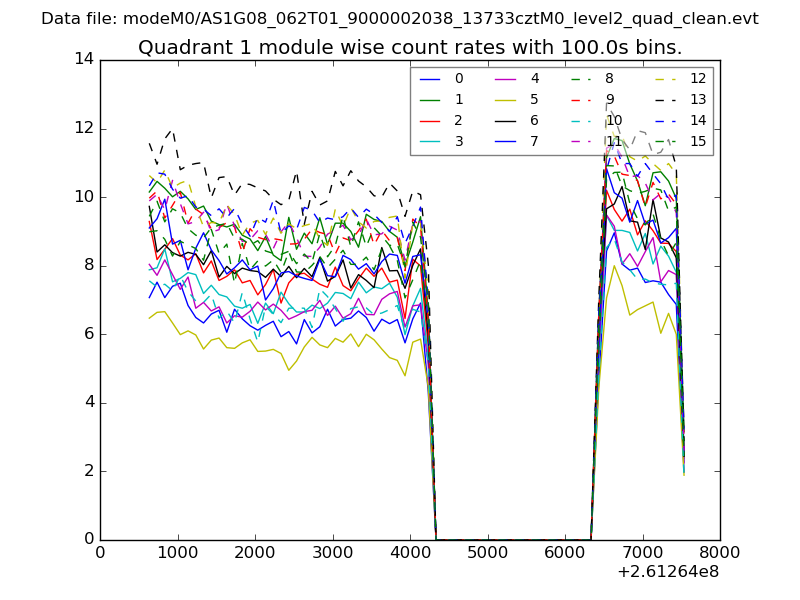
| Module-wise count rates for Quadrant A Data is divided into 100 sec bins |
 |
 |
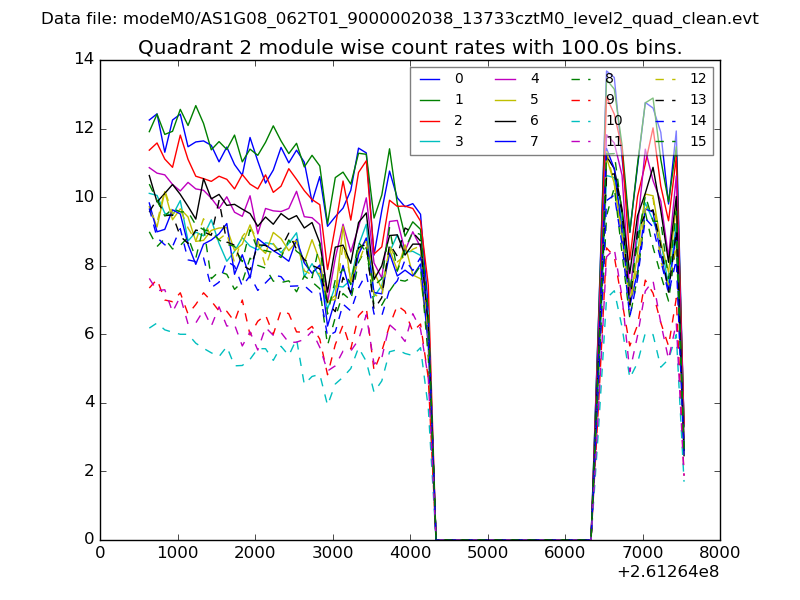
| Module-wise count rates for Quadrant B Data is divided into 100 sec bins |
 |
 |
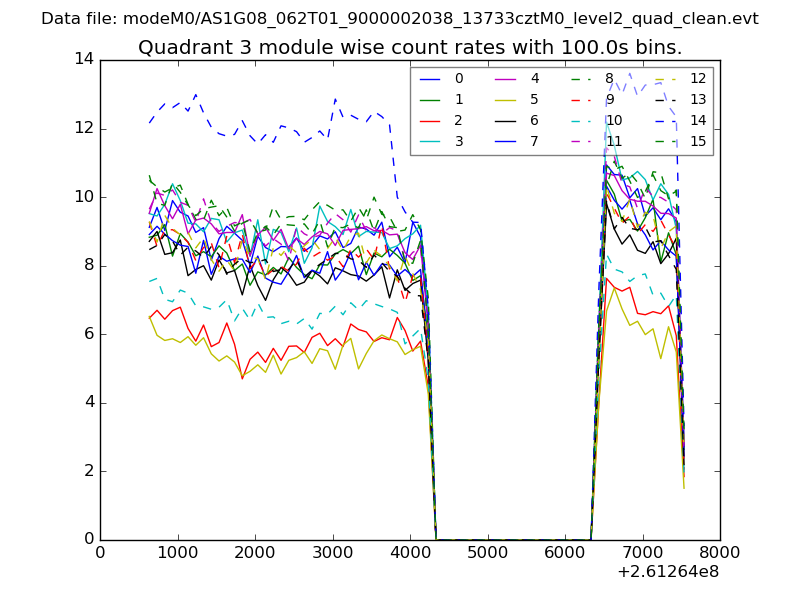
| Module-wise count rates for Quadrant C Data is divided into 100 sec bins |
 |
 |
| Module-wise count rates for Quadrant D Data is divided into 100 sec bins |
 |
 |
| Parameter | Plot |
|---|---|
| CZT HV Monitor |  |
| D_VDD | 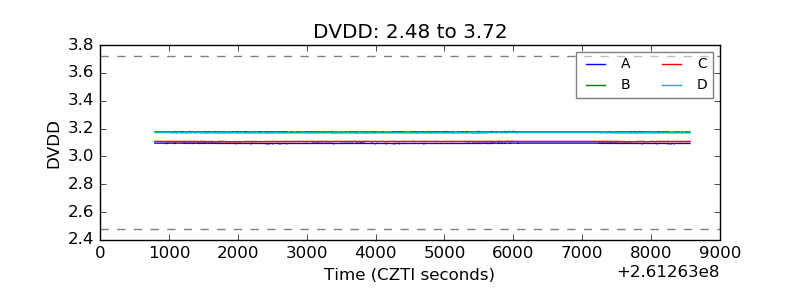 |
| Temperature 1 | 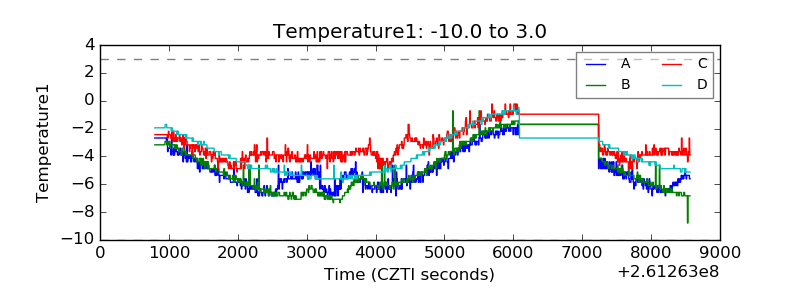 |
| Veto HV Monitor | 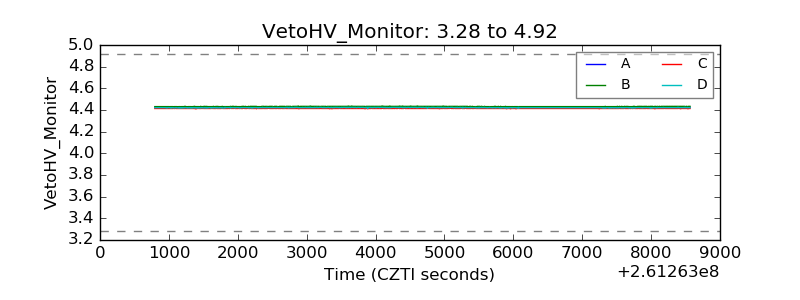 |
| Veto LLD | 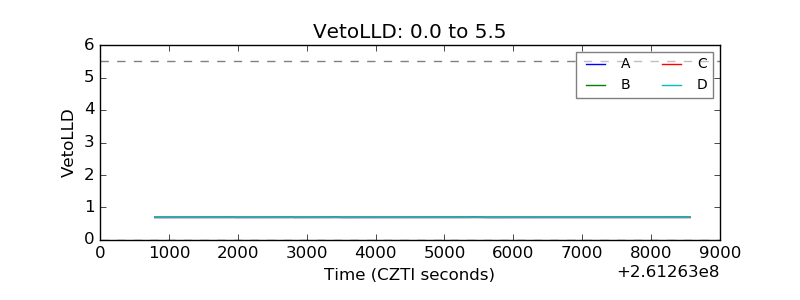 |
| Alpha Counter | 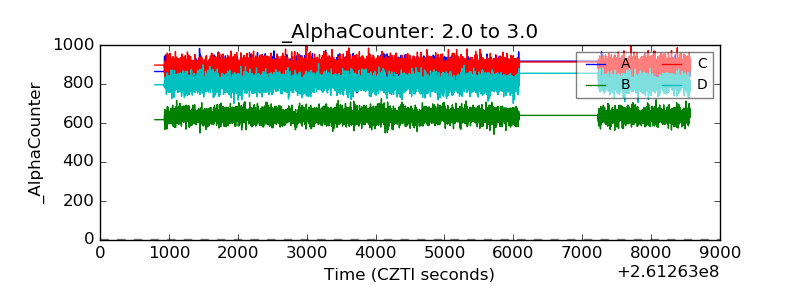 |
| _CPM_Rate | 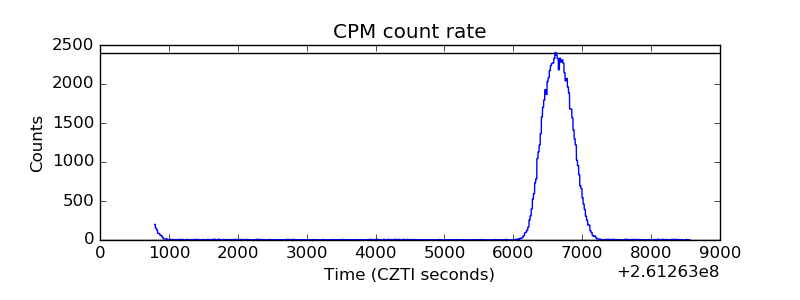 |
| CZT Counter | 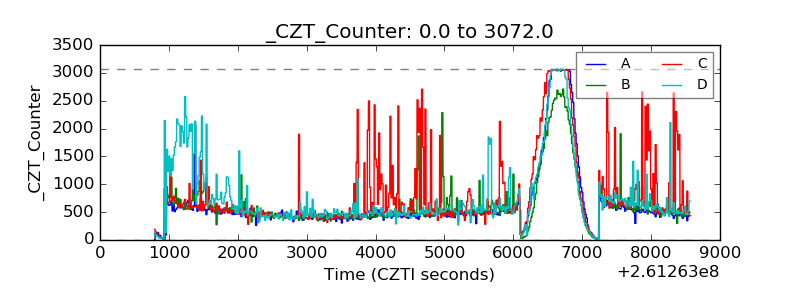 |
| +2.5 Volts monitor |  |
| +5 Volts monitor | 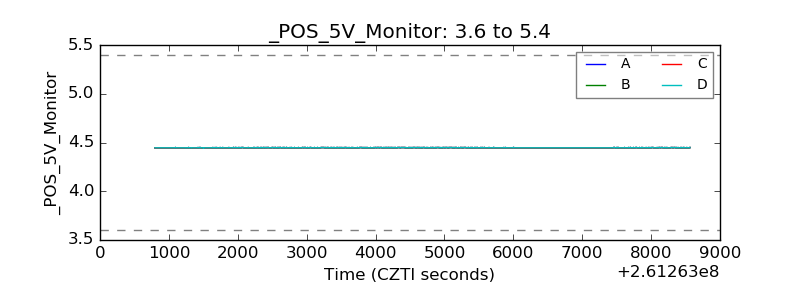 |
| _ROLL_ROT | 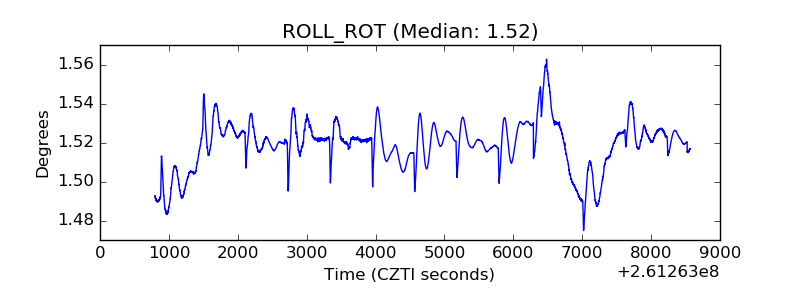 |
| _Roll_DEC | 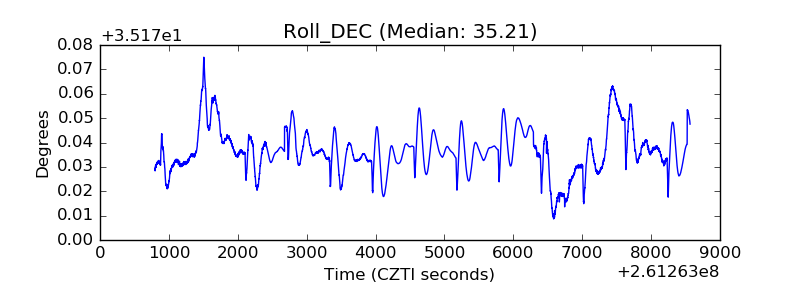 |
| _Roll_RA | 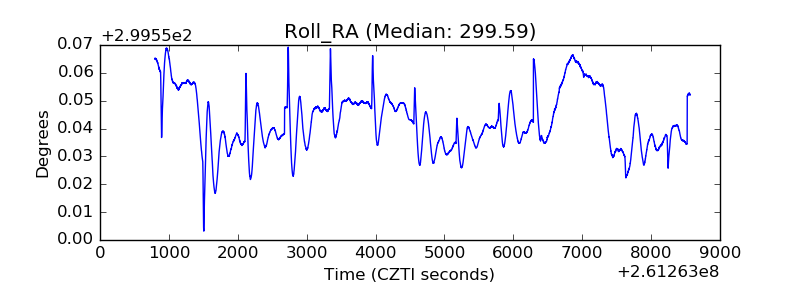 |
| Veto Counter | 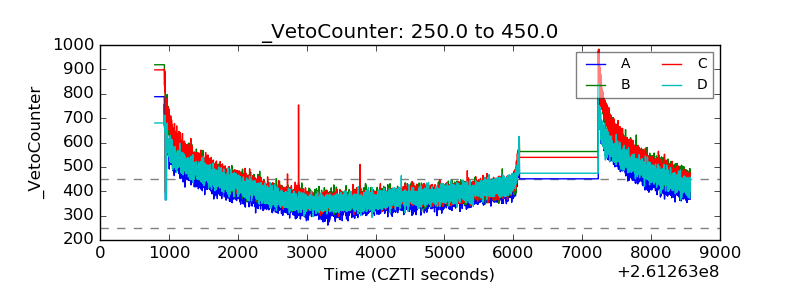 |