| Param | Original file | Final file |
|---|---|---|
| Filename | modeM0/AS1G08_062T01_9000002038_13734cztM0_level2.evt | modeM0/AS1G08_062T01_9000002038_13734cztM0_level2_quad_clean.evt |
| Size (bytes) | 506,669,760 | 108,823,680 |
| Size | 483.2 MB | 103.8 MB |
| Events in quadrant A | 3,111,061 | 715,065 |
| Events in quadrant B | 3,414,795 | 715,594 |
| Events in quadrant C | 4,528,595 | 723,383 |
| Events in quadrant D | 3,863,119 | 702,478 |
| Mode M9 | |||
|---|---|---|---|
| Quadrant | BADHDUFLAG | Total packets | Discarded packets |
| A | 0 | 21 | 0 |
| B | 0 | 21 | 0 |
| C | 0 | 21 | 0 |
| D | 0 | 22 | 0 |
| Mode M0 | |||
|---|---|---|---|
| Quadrant | BADHDUFLAG | Total packets | Discarded packets |
| A | 0 | 13347 | 3 |
| B | 0 | 14214 | 2 |
| C | 0 | 17530 | 2 |
| D | 0 | 15793 | 2 |
| Mode SS | |||
|---|---|---|---|
| Quadrant | BADHDUFLAG | Total packets | Discarded packets |
| A | 0 | 126 | 0 |
| B | 0 | 126 | 0 |
| C | 0 | 126 | 0 |
| D | 0 | 126 | 0 |
| Quadrant | Total seconds | Saturated seconds | Saturation percentage |
|---|---|---|---|
| A | 6303 | 40 | 0.634618% |
| B | 6303 | 80 | 1.269237% |
| C | 6303 | 409 | 6.488974% |
| D | 6303 | 72 | 1.142313% |
Noise dominated data is calculated using 1-second bins in cleaned event files. If a bin has >2000 counts, and if more than 50% of those come from <1% of pixels, then it is considered to be noise-dominated and hence unusable.
| Quadrant | # 1 sec bins | Bins with >0 counts | Bins with >2000 counts | High rate bins dominated by noise | Noise dominated (total time) | Noise dominated (detector-on time) | Marked lightcurve |
|---|---|---|---|---|---|---|---|
| A | 7534 | 6305 | 2 | 2 | 0.03% | 0.03% | 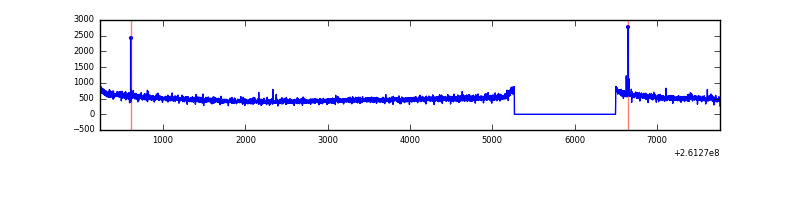 |
| B | 7534 | 6305 | 10 | 10 | 0.13% | 0.16% | 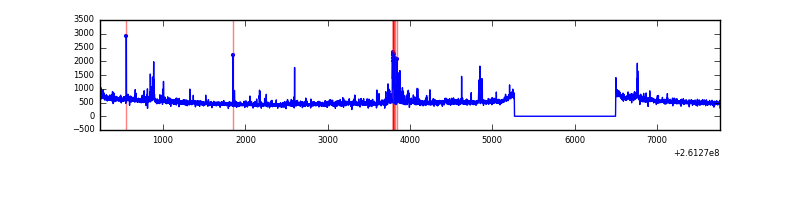 |
| C | 7534 | 6305 | 269 | 269 | 3.57% | 4.27% | 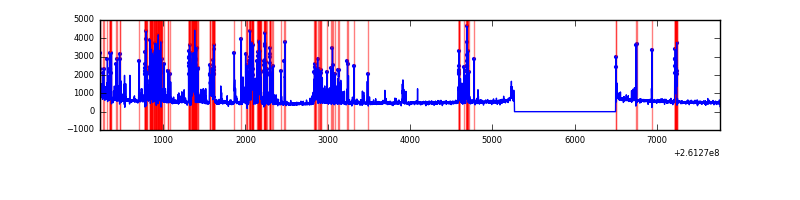 |
| D | 7534 | 6305 | 19 | 19 | 0.25% | 0.30% | 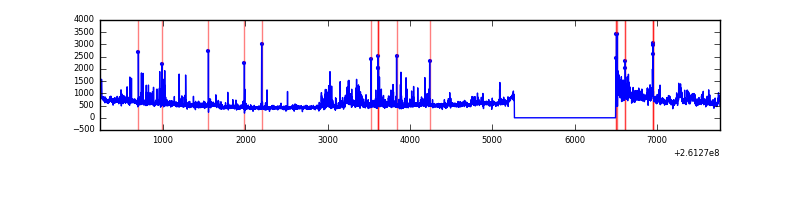 |
Top three noisy pixels from each quadrant. If the there are fewer than three noisy pixels in the level2.evt file, extra rows are filled as -1
| Pixel properties | Quadrant properties | ||||||
|---|---|---|---|---|---|---|---|
| Quadrant | DetID | PixID | Counts | Sigma | Mean | Median | Sigma |
| A | 15 | 69 | 12835 | 74.88 | 801 | 788 | 160.9 |
| A | 0 | 23 | 11145 | 64.38 | 801 | 788 | 160.9 |
| A | 0 | 226 | 7862 | 43.97 | 801 | 788 | 160.9 |
| B | 8 | 250 | 153623 | 1011.87 | 804 | 787 | 151.0 |
| B | 0 | 219 | 63870 | 417.65 | 804 | 787 | 151.0 |
| B | 4 | 173 | 20471 | 130.32 | 804 | 787 | 151.0 |
| C | 4 | 254 | 1397827 | 7767.64 | 776 | 781 | 179.9 |
| C | 3 | 233 | 97258 | 536.42 | 776 | 781 | 179.9 |
| C | 14 | 234 | 5677 | 27.22 | 776 | 781 | 179.9 |
| D | 5 | 222 | 396355 | 2089.68 | 783 | 762 | 189.3 |
| D | 8 | 195 | 287487 | 1514.6 | 783 | 762 | 189.3 |
| D | 10 | 157 | 93765 | 491.28 | 783 | 762 | 189.3 |
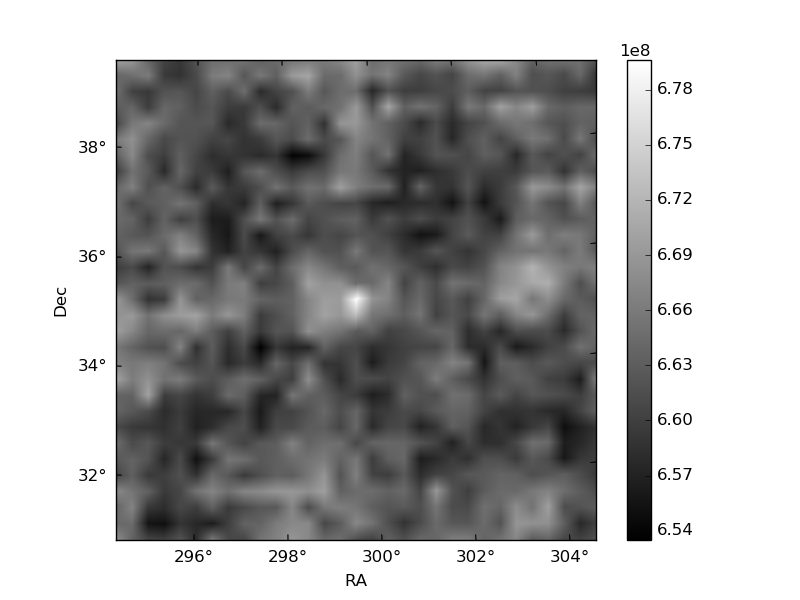
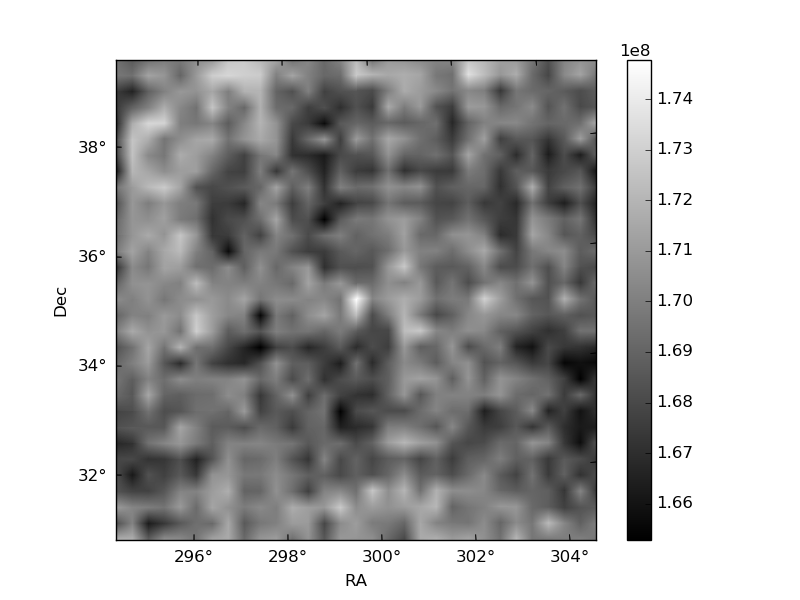
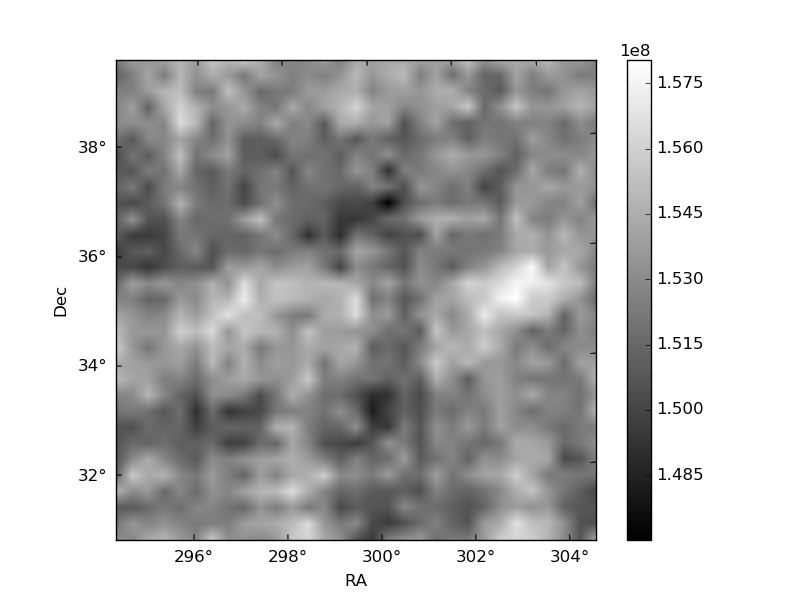
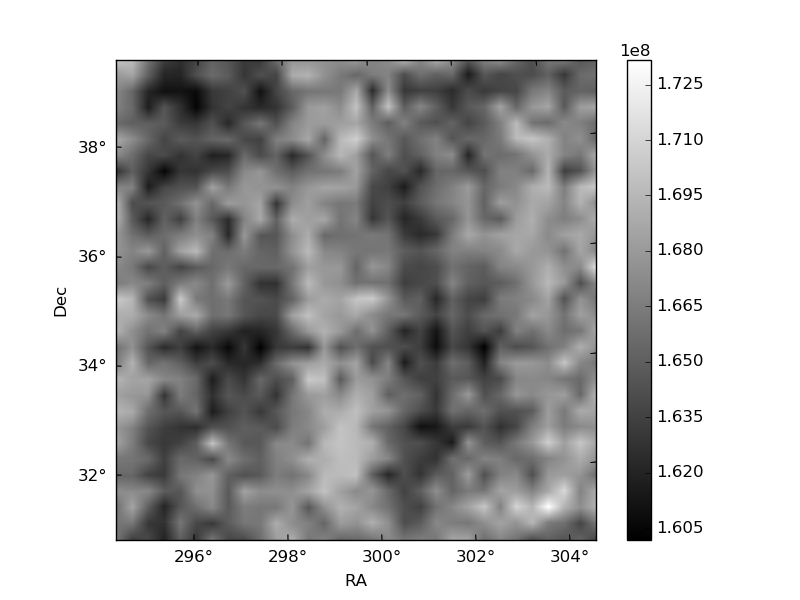
Histogram calculated using DETX and DETY for each event in the final _common_clean file
| Quadrant A | 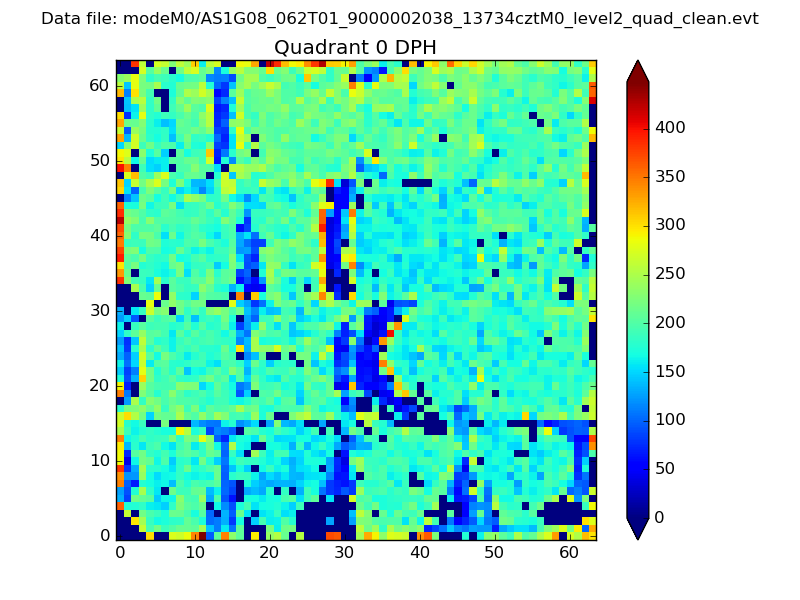 |
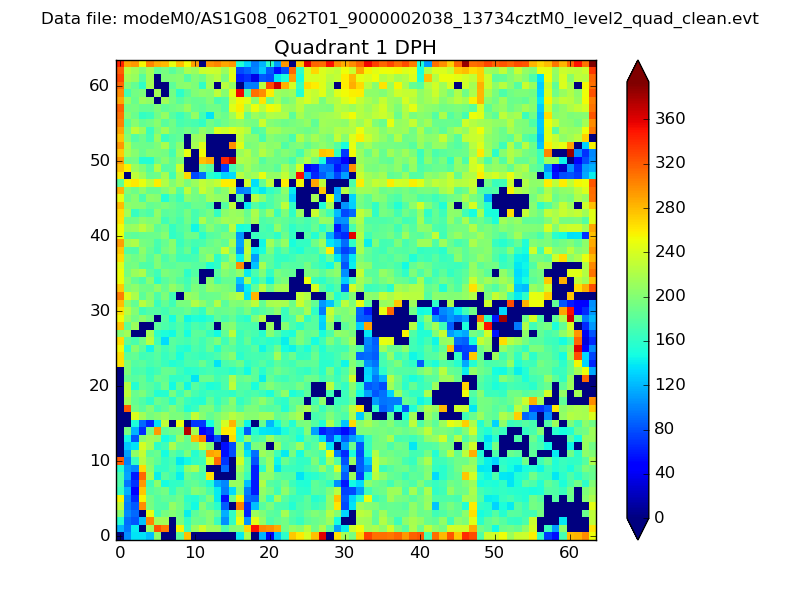 |
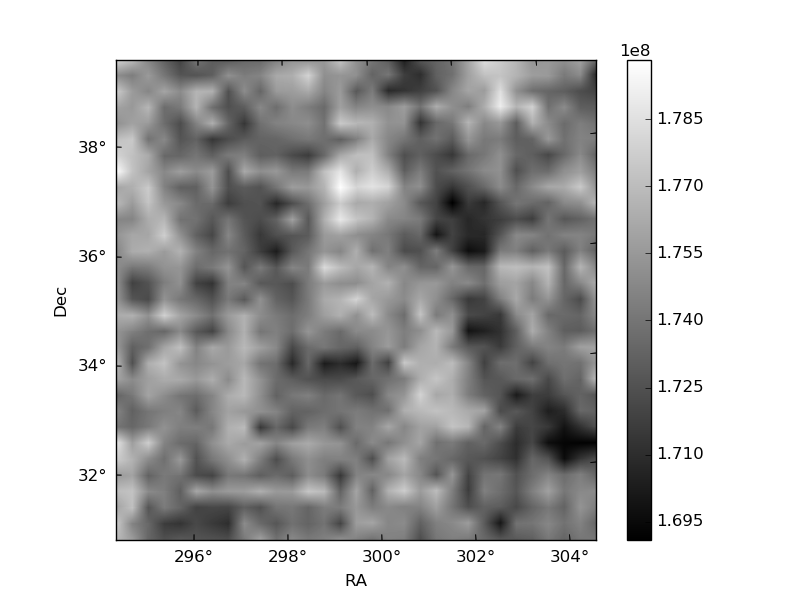
Quadrant B |
|---|---|---|---|
| Quadrant D | 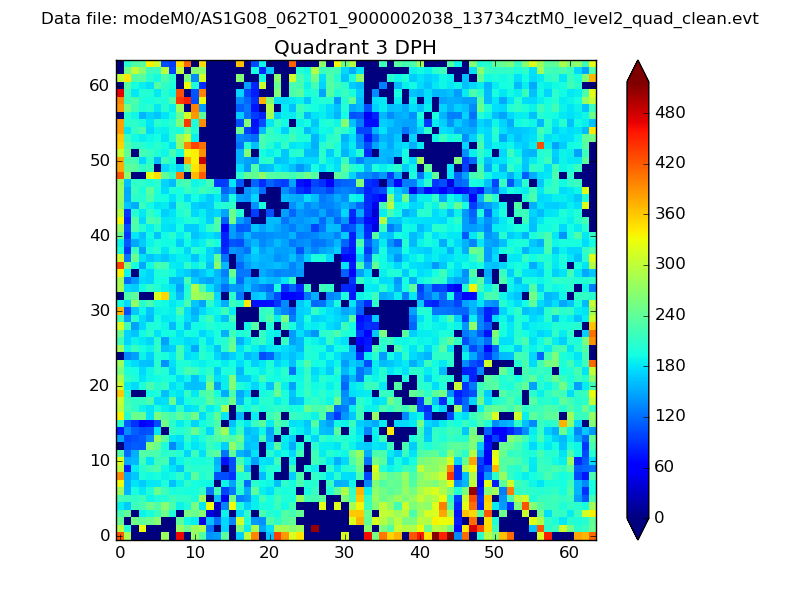 |
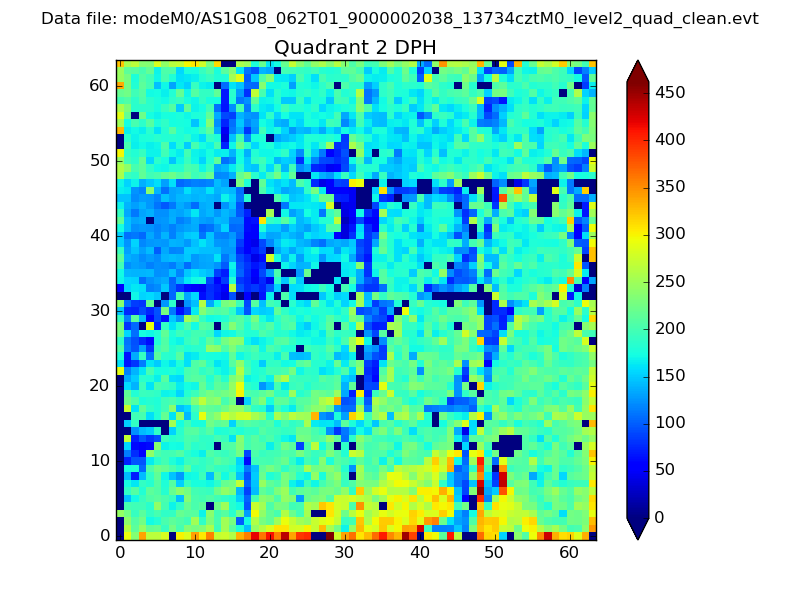 |
Quadrant C |
| Plot type | Count rate plots | Images |
|---|---|---|
| Comparison with Poisson distribution Blue bars denote a histogram of data divided into 1 sec bins. Red curve is a Poisson curve with rate = median count rate of data. |
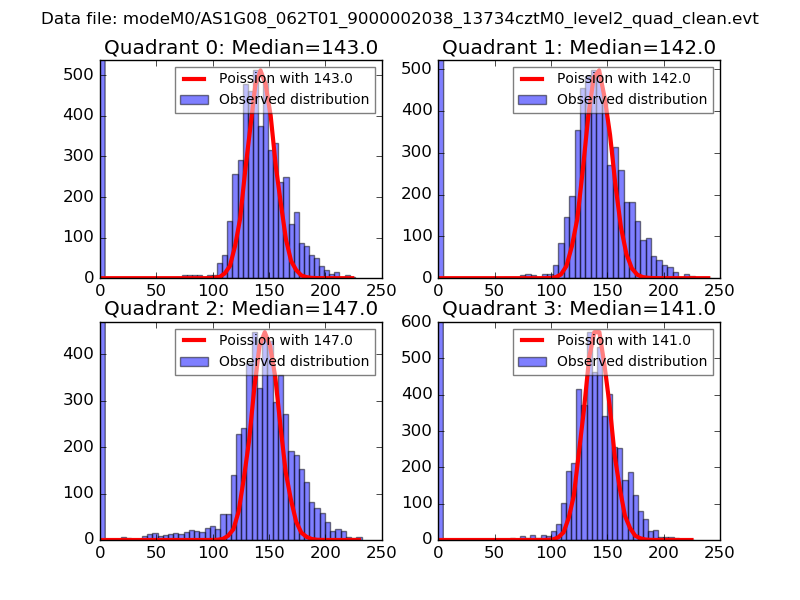 |
 |
| Quadrant-wise count rates Data is divided into 100 sec bins |
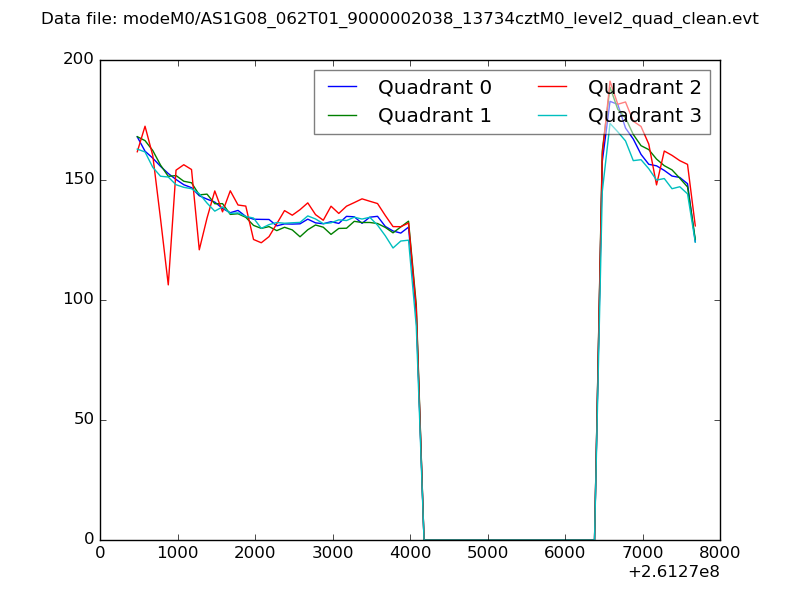 |
|
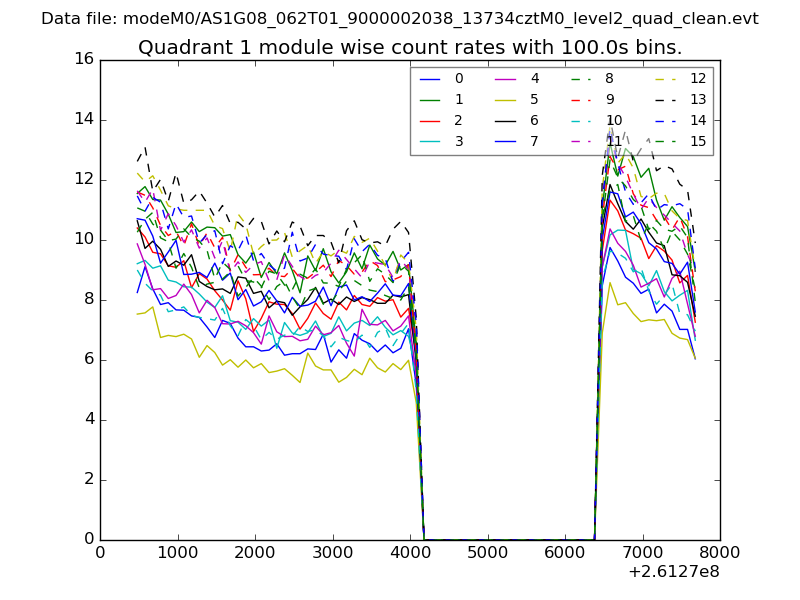
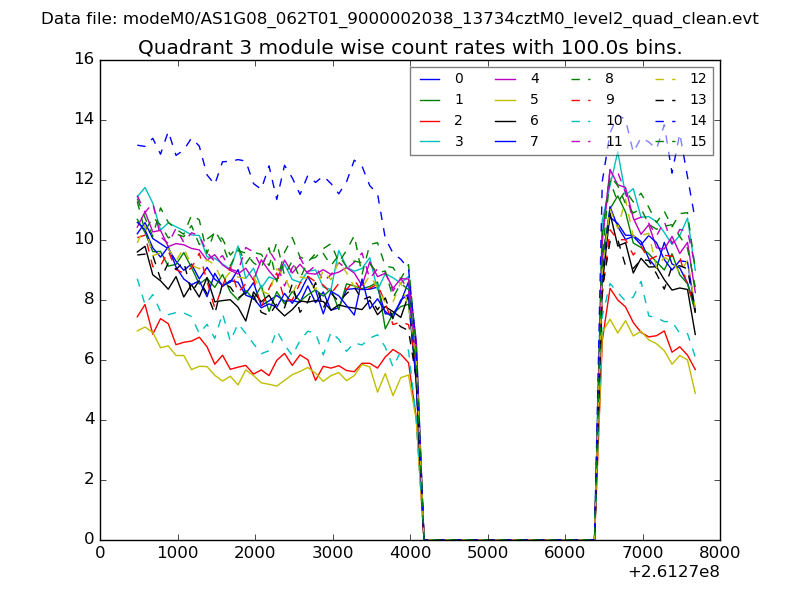
| Module-wise count rates for Quadrant A Data is divided into 100 sec bins |
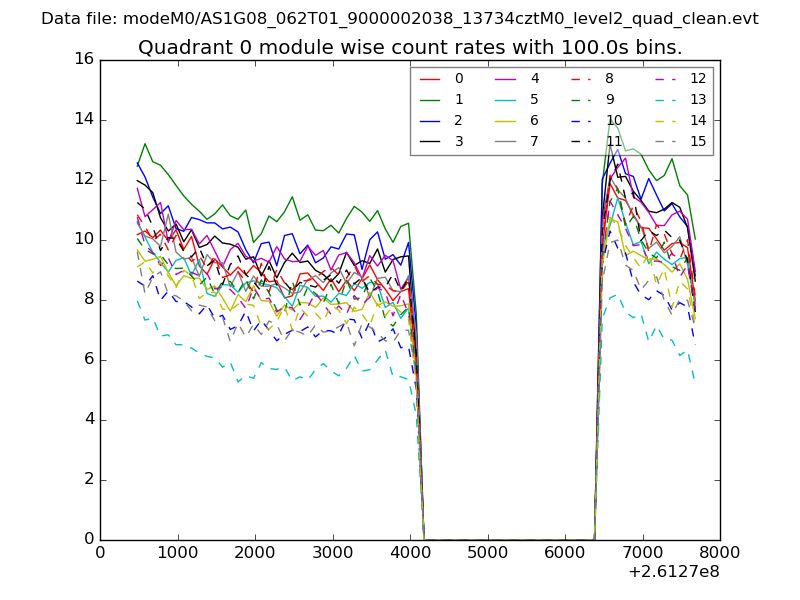 |
 |
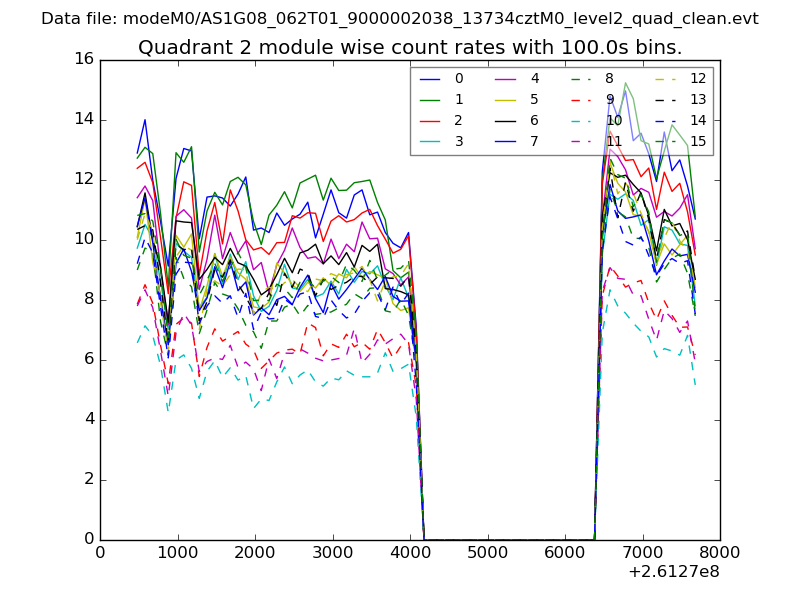
| Module-wise count rates for Quadrant B Data is divided into 100 sec bins |
 |
 |
| Module-wise count rates for Quadrant C Data is divided into 100 sec bins |
 |
 |
| Module-wise count rates for Quadrant D Data is divided into 100 sec bins |
 |
 |
| Parameter | Plot |
|---|---|
| CZT HV Monitor | 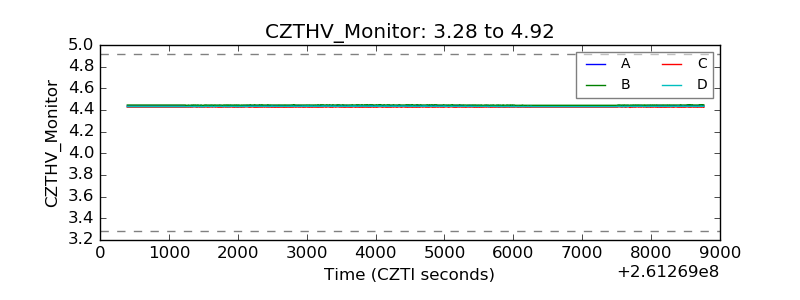 |
| D_VDD | 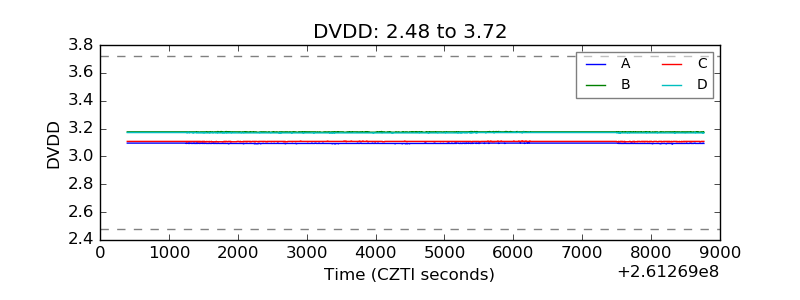 |
| Temperature 1 | 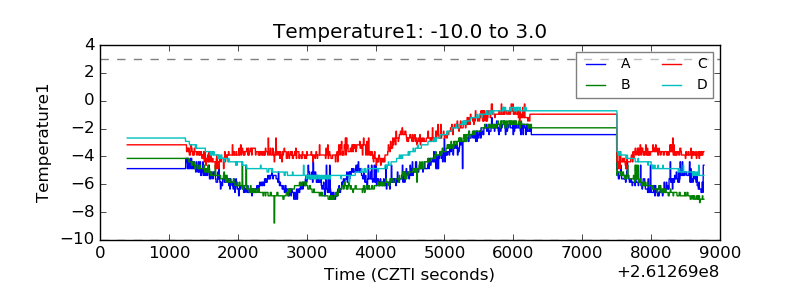 |
| Veto HV Monitor | 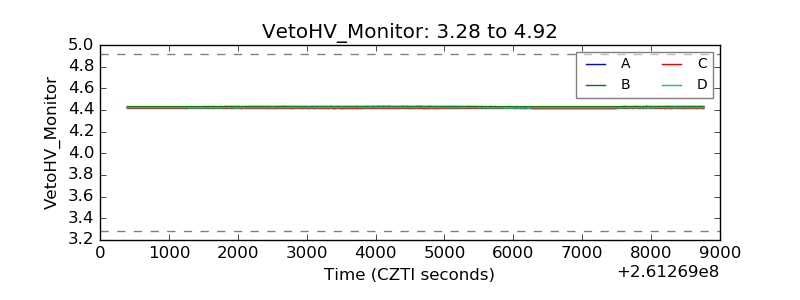 |
| Veto LLD | 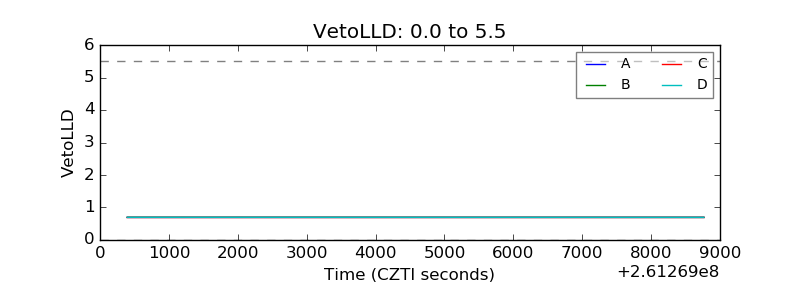 |
| Alpha Counter | 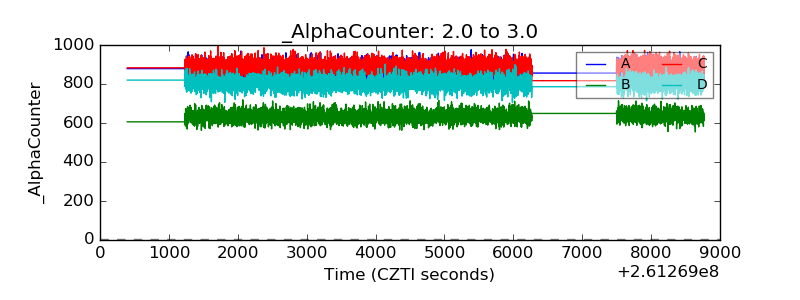 |
| _CPM_Rate | 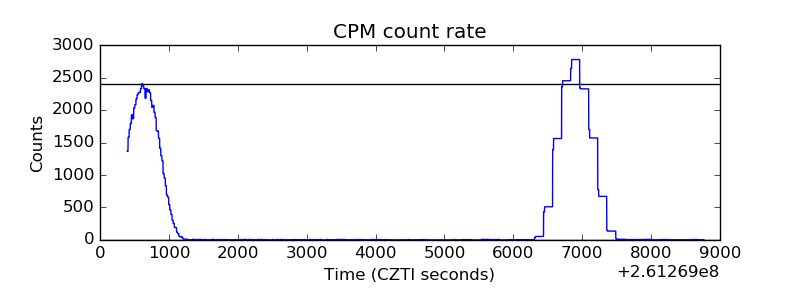 |
| CZT Counter | 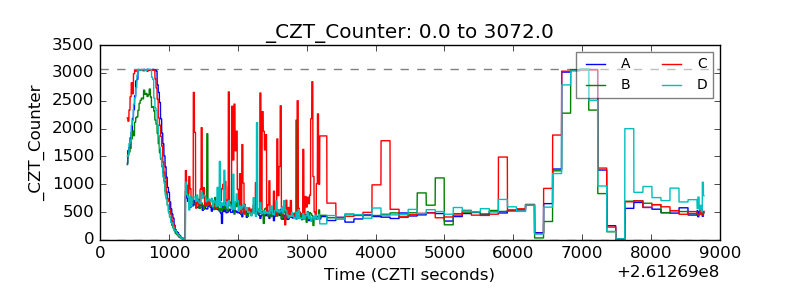 |
| +2.5 Volts monitor |  |
| +5 Volts monitor | 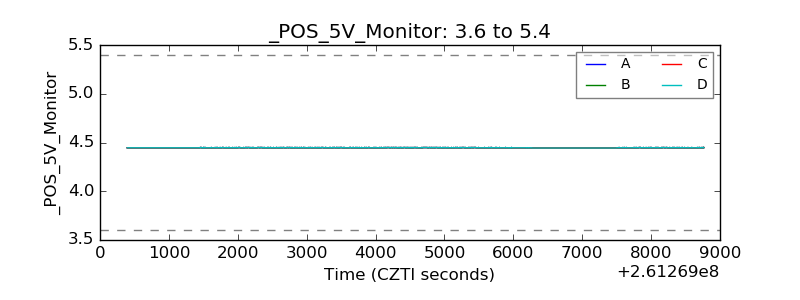 |
| _ROLL_ROT | 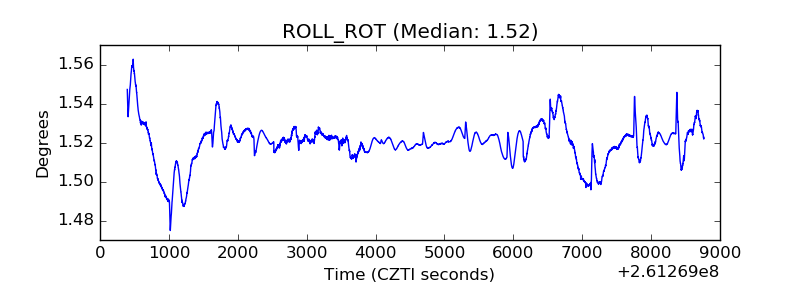 |
| _Roll_DEC | 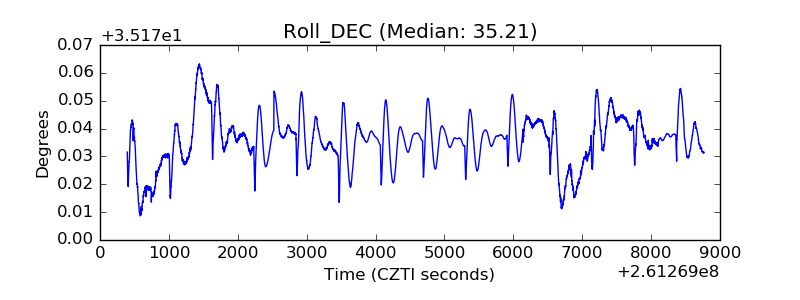 |
| _Roll_RA | 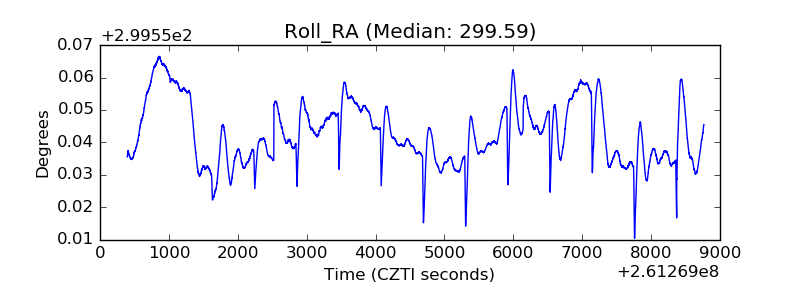 |
| Veto Counter | 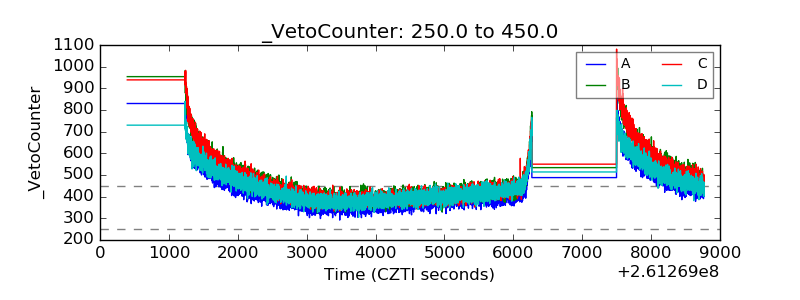 |