| Param | Original file | Final file |
|---|---|---|
| Filename | modeM0/AS1G08_062T01_9000002038_13736cztM0_level2.evt | modeM0/AS1G08_062T01_9000002038_13736cztM0_level2_quad_clean.evt |
| Size (bytes) | 557,228,160 | 105,750,720 |
| Size | 531.4 MB | 100.9 MB |
| Events in quadrant A | 3,270,351 | 697,656 |
| Events in quadrant B | 3,589,567 | 702,642 |
| Events in quadrant C | 3,908,604 | 718,894 |
| Events in quadrant D | 5,670,412 | 633,831 |
| Mode M9 | |||
|---|---|---|---|
| Quadrant | BADHDUFLAG | Total packets | Discarded packets |
| A | 0 | 21 | 0 |
| B | 0 | 21 | 0 |
| C | 0 | 21 | 0 |
| D | 0 | 22 | 0 |
| Mode M0 | |||
|---|---|---|---|
| Quadrant | BADHDUFLAG | Total packets | Discarded packets |
| A | 0 | 13601 | 3 |
| B | 0 | 14709 | 2 |
| C | 0 | 15618 | 2 |
| D | 0 | 21073 | 2 |
| Mode SS | |||
|---|---|---|---|
| Quadrant | BADHDUFLAG | Total packets | Discarded packets |
| A | 0 | 130 | 0 |
| B | 0 | 130 | 0 |
| C | 0 | 130 | 0 |
| D | 0 | 130 | 0 |
| Quadrant | Total seconds | Saturated seconds | Saturation percentage |
|---|---|---|---|
| A | 6445 | 30 | 0.465477% |
| B | 6445 | 67 | 1.039566% |
| C | 6445 | 176 | 2.730799% |
| D | 6445 | 824 | 12.785105% |
Noise dominated data is calculated using 1-second bins in cleaned event files. If a bin has >2000 counts, and if more than 50% of those come from <1% of pixels, then it is considered to be noise-dominated and hence unusable.
| Quadrant | # 1 sec bins | Bins with >0 counts | Bins with >2000 counts | High rate bins dominated by noise | Noise dominated (total time) | Noise dominated (detector-on time) | Marked lightcurve |
|---|---|---|---|---|---|---|---|
| A | 7811 | 6447 | 0 | 0 | 0.00% | 0.00% | 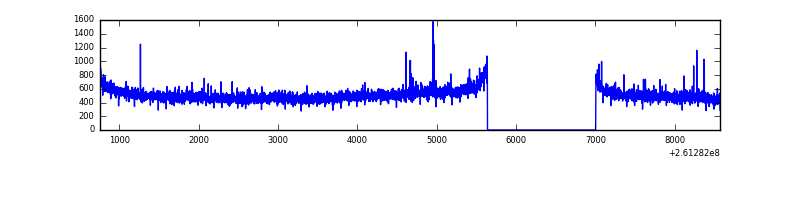 |
| B | 7811 | 6447 | 14 | 14 | 0.18% | 0.22% | 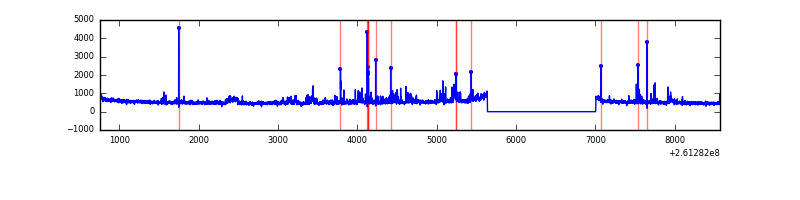 |
| C | 7811 | 6447 | 103 | 103 | 1.32% | 1.60% | 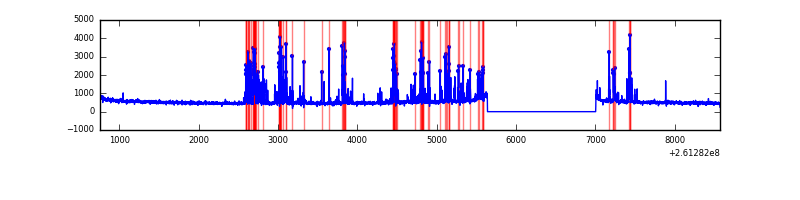 |
| D | 7811 | 6447 | 648 | 648 | 8.30% | 10.05% | 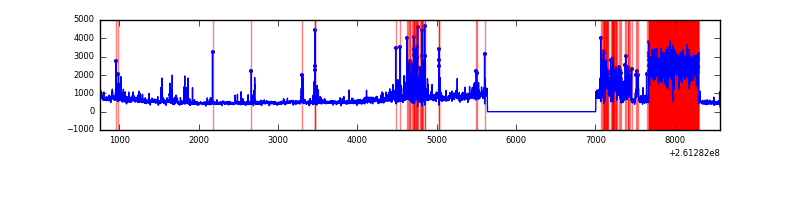 |
Top three noisy pixels from each quadrant. If the there are fewer than three noisy pixels in the level2.evt file, extra rows are filled as -1
| Pixel properties | Quadrant properties | ||||||
|---|---|---|---|---|---|---|---|
| Quadrant | DetID | PixID | Counts | Sigma | Mean | Median | Sigma |
| A | 0 | 23 | 75529 | 456.14 | 819 | 804 | 163.8 |
| A | 1 | 162 | 17164 | 99.87 | 819 | 804 | 163.8 |
| A | 0 | 226 | 12067 | 68.75 | 819 | 804 | 163.8 |
| B | 8 | 250 | 108288 | 698.24 | 822 | 805 | 153.9 |
| B | 0 | 189 | 74151 | 476.48 | 822 | 805 | 153.9 |
| B | 4 | 173 | 43441 | 276.98 | 822 | 805 | 153.9 |
| C | 4 | 254 | 682520 | 3707.19 | 798 | 806 | 183.9 |
| C | 3 | 233 | 105031 | 566.78 | 798 | 806 | 183.9 |
| C | 13 | 61 | 5924 | 27.83 | 798 | 806 | 183.9 |
| D | 5 | 222 | 1836852 | 10072.99 | 758 | 740 | 182.3 |
| D | 8 | 195 | 429459 | 2351.97 | 758 | 740 | 182.3 |
| D | 10 | 157 | 230662 | 1261.36 | 758 | 740 | 182.3 |
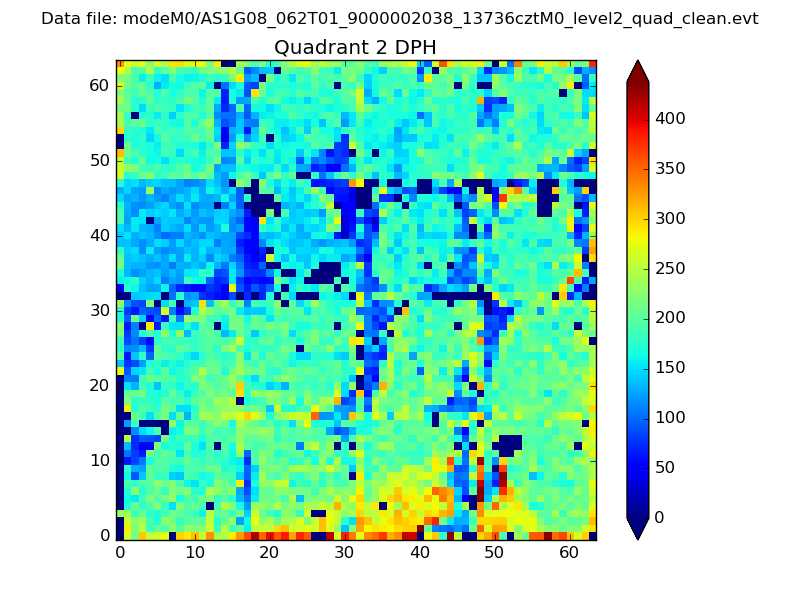
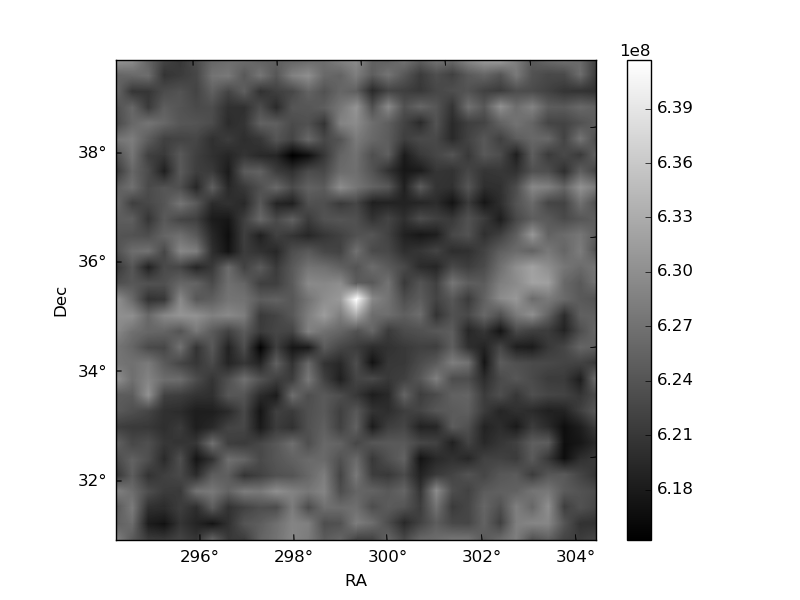
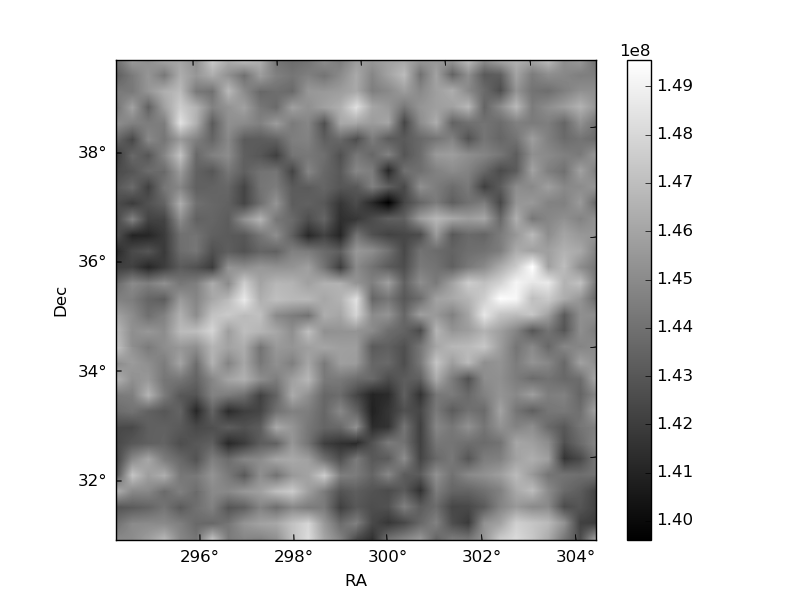
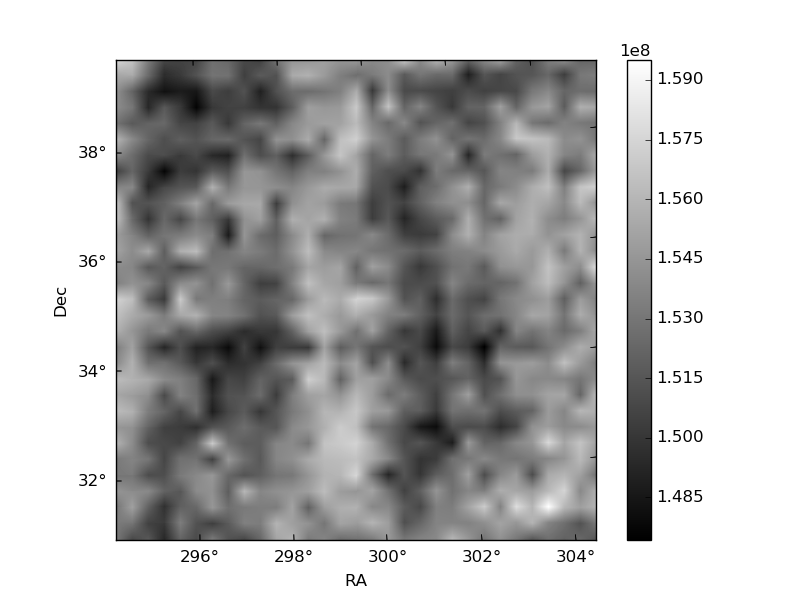
Histogram calculated using DETX and DETY for each event in the final _common_clean file
| Quadrant A | 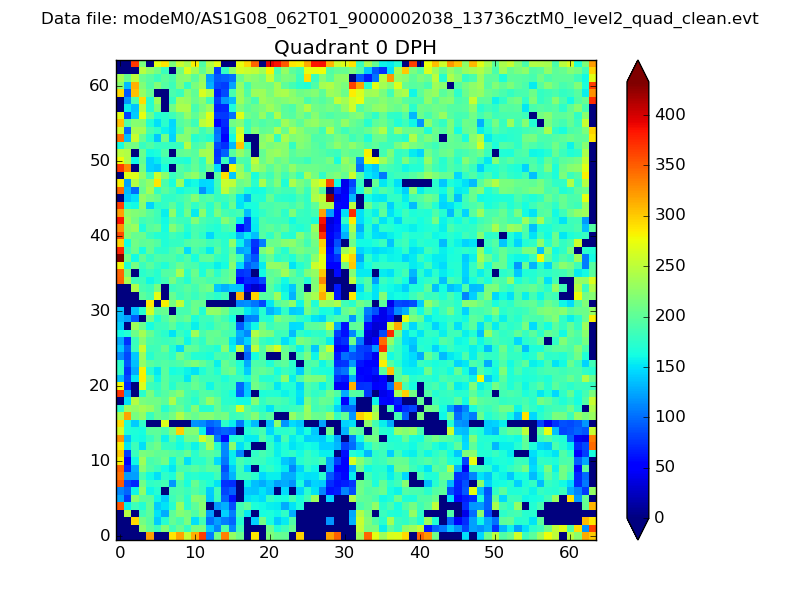 |
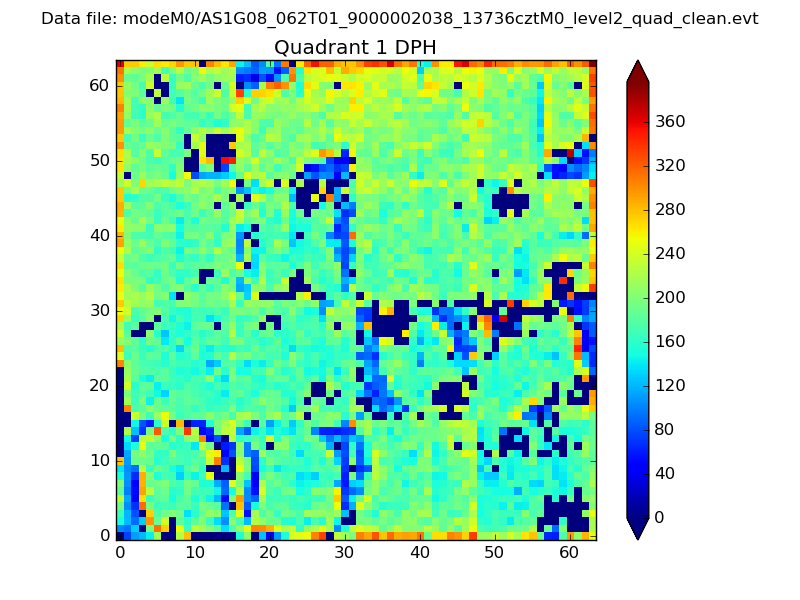 |
Quadrant B |
|---|---|---|---|
| Quadrant D | 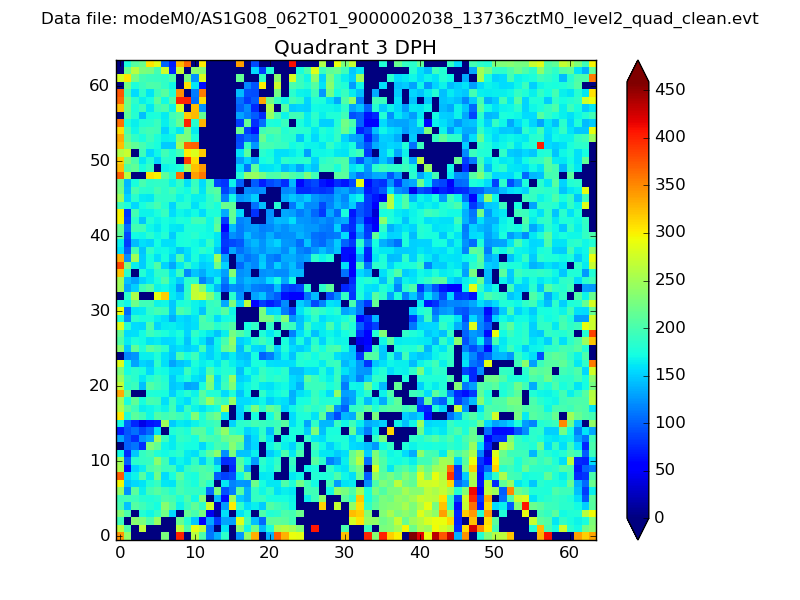 |
 |
Quadrant C |
| Plot type | Count rate plots | Images |
|---|---|---|
| Comparison with Poisson distribution Blue bars denote a histogram of data divided into 1 sec bins. Red curve is a Poisson curve with rate = median count rate of data. |
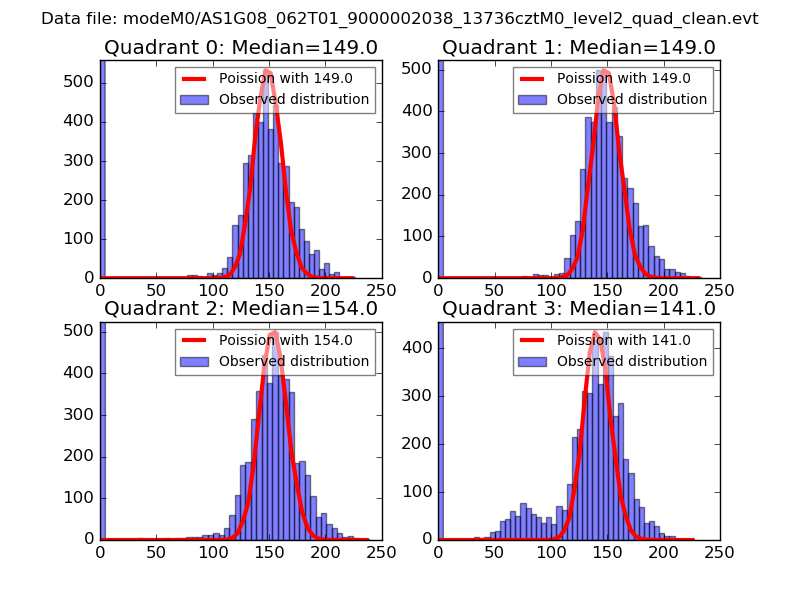 |
 |
| Quadrant-wise count rates Data is divided into 100 sec bins |
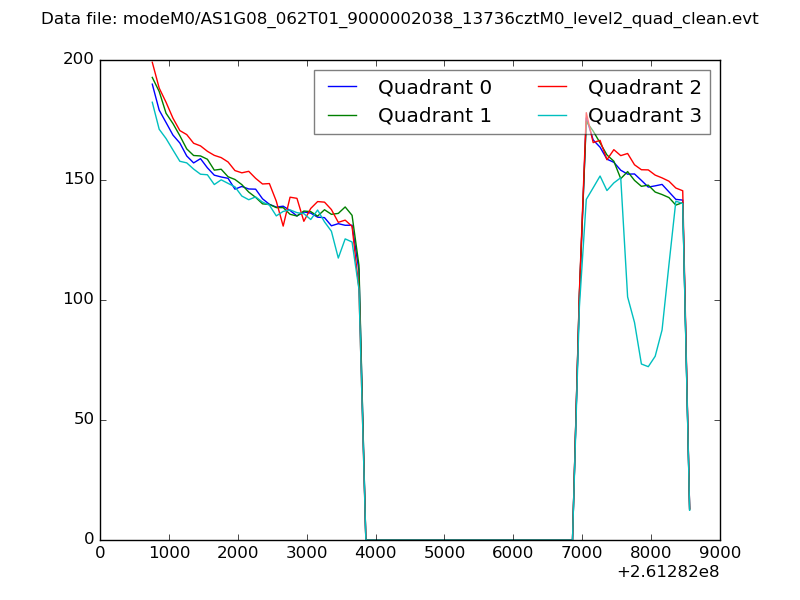 |
|
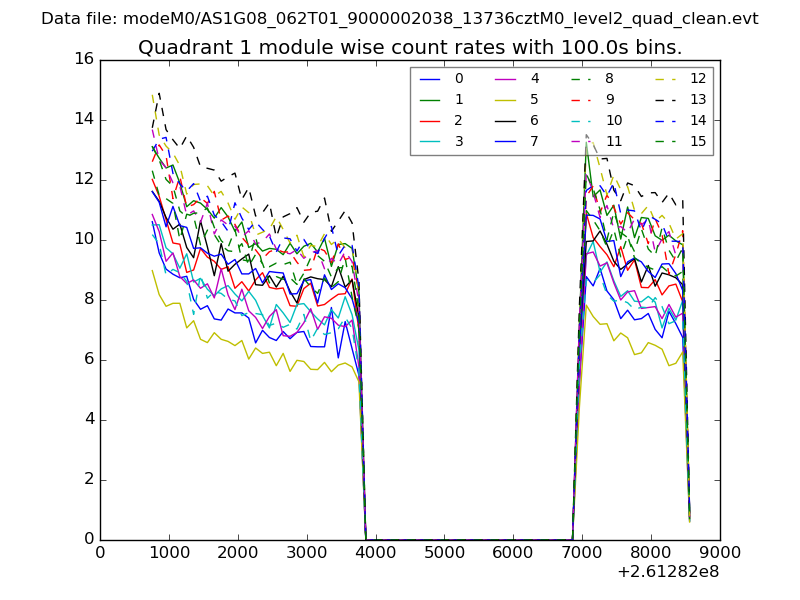
| Module-wise count rates for Quadrant A Data is divided into 100 sec bins |
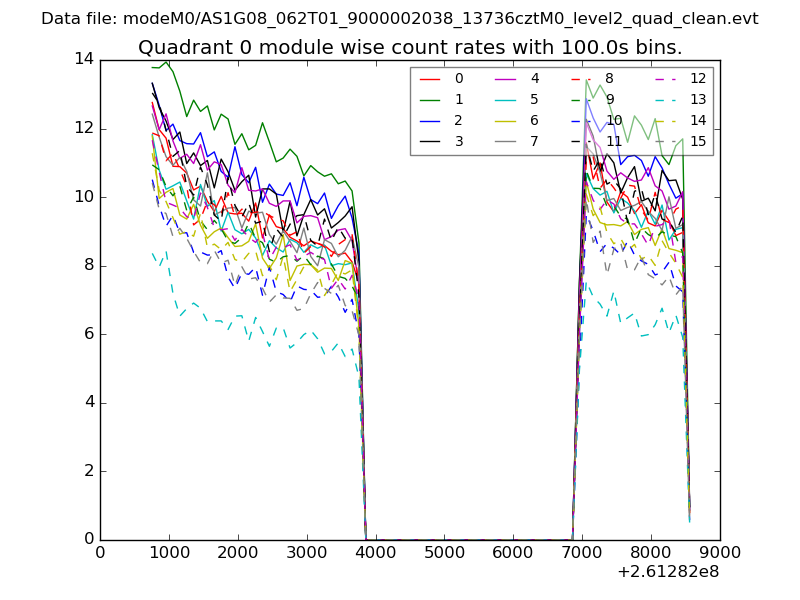 |
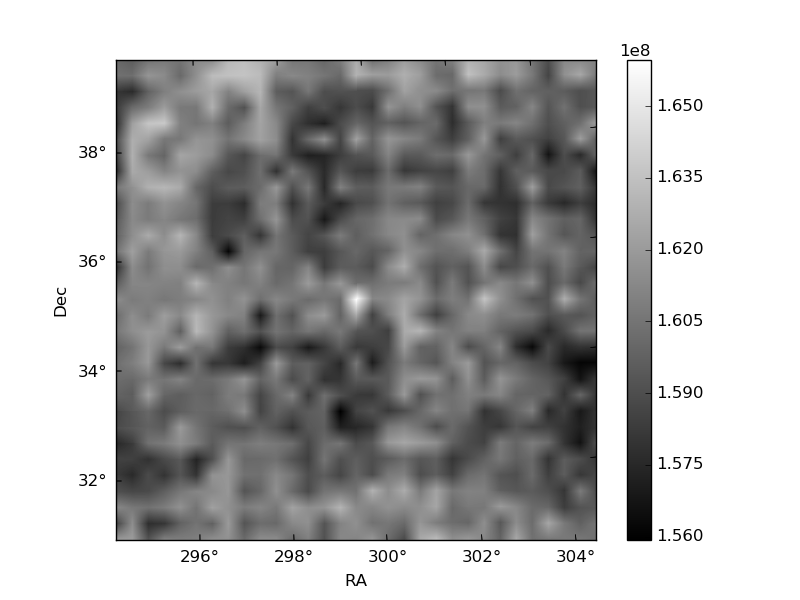 |
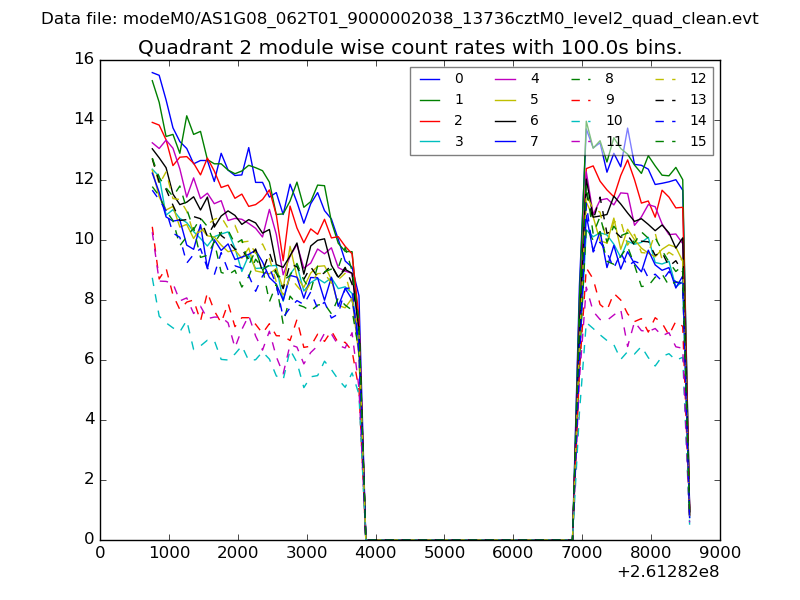
| Module-wise count rates for Quadrant B Data is divided into 100 sec bins |
 |
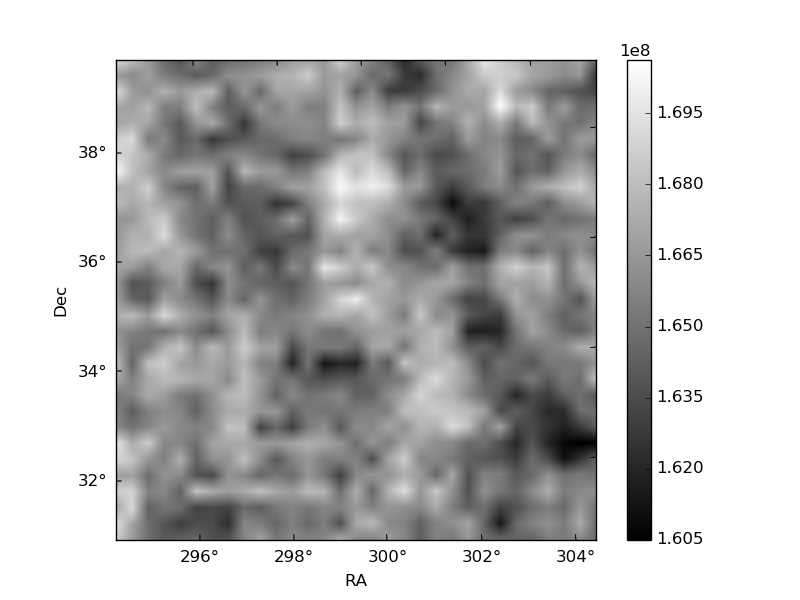 |
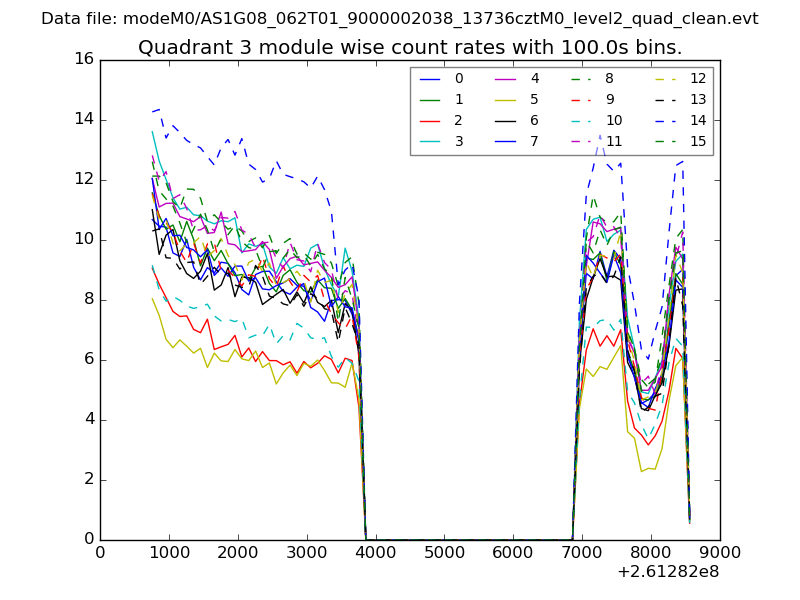
| Module-wise count rates for Quadrant C Data is divided into 100 sec bins |
 |
 |
| Module-wise count rates for Quadrant D Data is divided into 100 sec bins |
 |
 |
| Parameter | Plot |
|---|---|
| CZT HV Monitor | 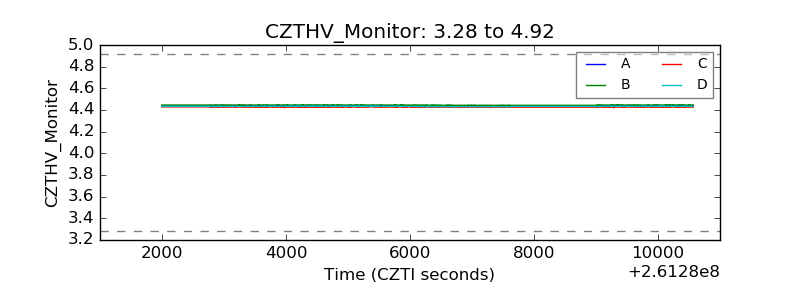 |
| D_VDD | 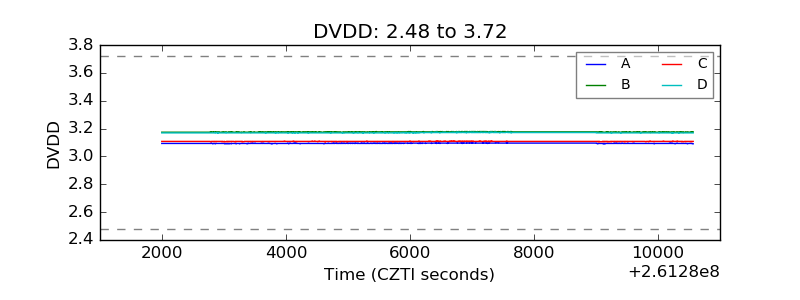 |
| Temperature 1 | 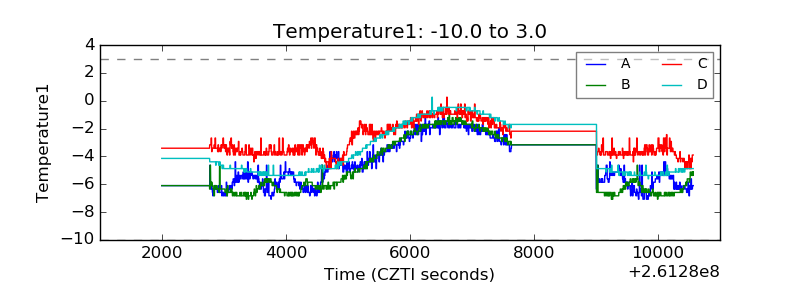 |
| Veto HV Monitor | 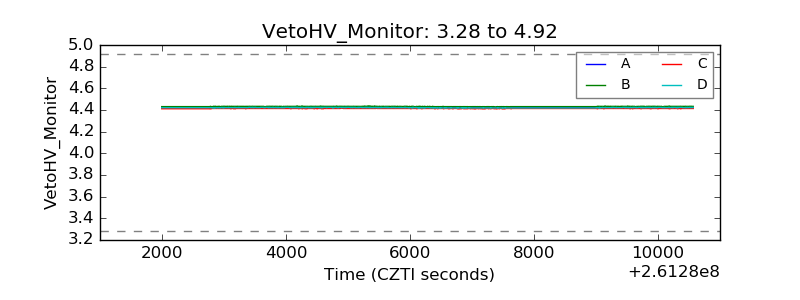 |
| Veto LLD | 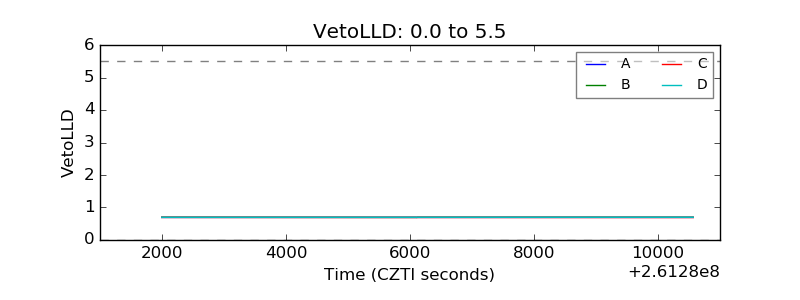 |
| Alpha Counter | 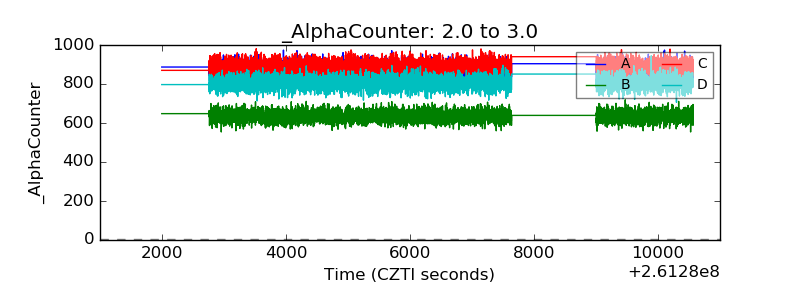 |
| _CPM_Rate | 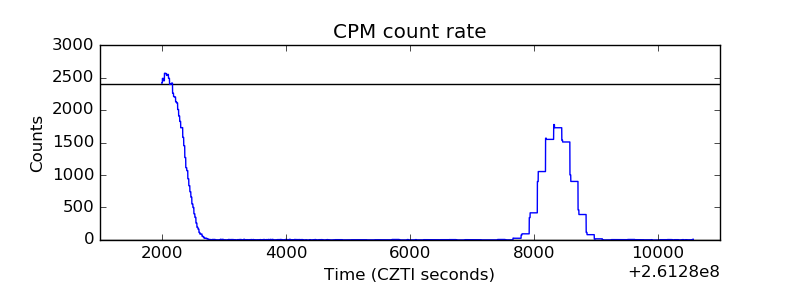 |
| CZT Counter | 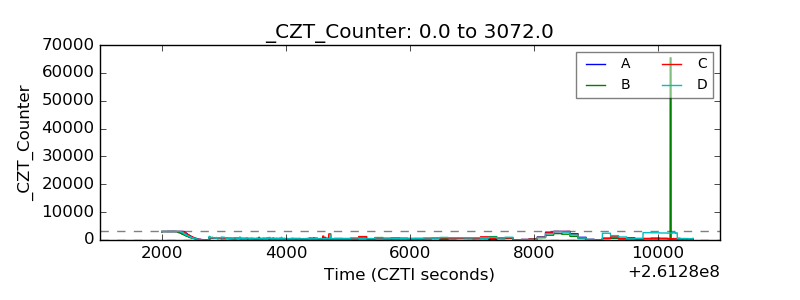 |
| +2.5 Volts monitor |  |
| +5 Volts monitor | 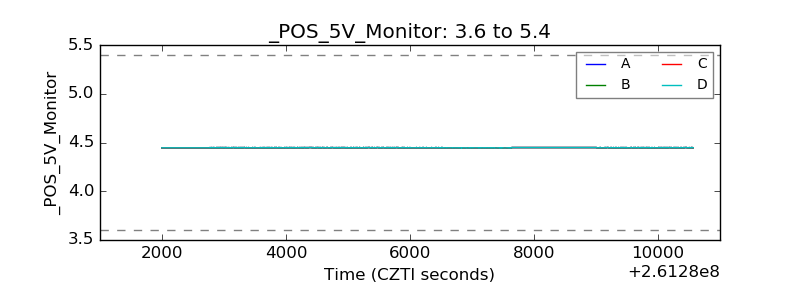 |
| _ROLL_ROT | 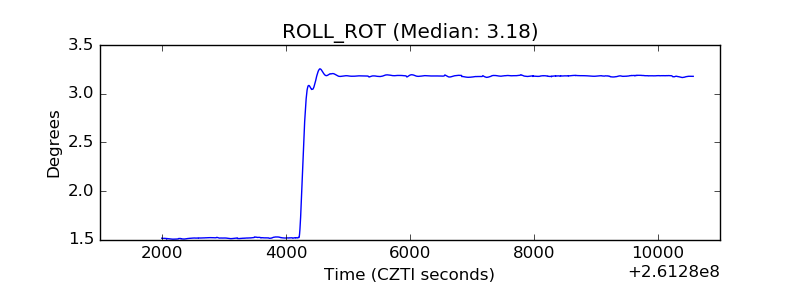 |
| _Roll_DEC | 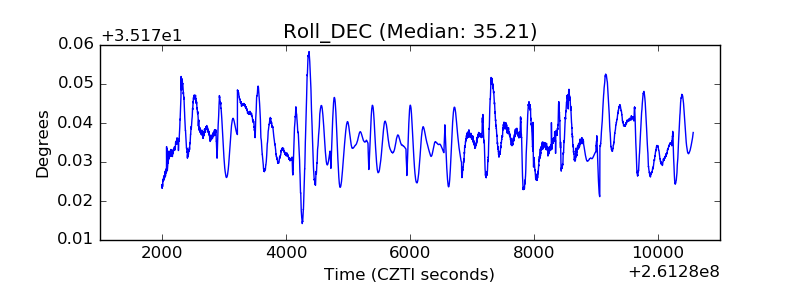 |
| _Roll_RA | 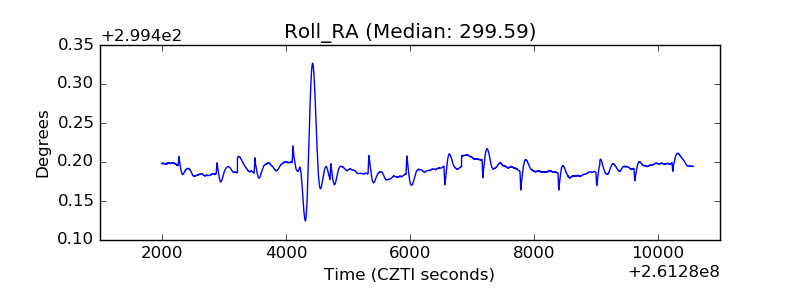 |
| Veto Counter | 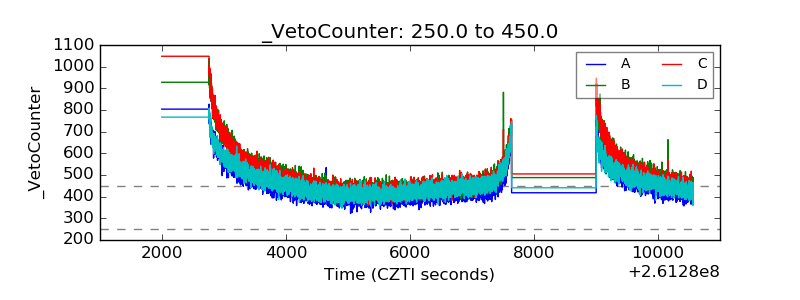 |