| Param | Original file | Final file |
|---|---|---|
| Filename | modeM0/AS1G08_062T01_9000002038_13737cztM0_level2.evt | modeM0/AS1G08_062T01_9000002038_13737cztM0_level2_quad_clean.evt |
| Size (bytes) | 438,779,520 | 77,184,000 |
| Size | 418.5 MB | 73.6 MB |
| Events in quadrant A | 2,799,305 | 492,308 |
| Events in quadrant B | 3,049,023 | 487,254 |
| Events in quadrant C | 2,753,949 | 508,906 |
| Events in quadrant D | 4,302,937 | 454,057 |
| Mode M9 | |||
|---|---|---|---|
| Quadrant | BADHDUFLAG | Total packets | Discarded packets |
| A | 0 | 13 | 0 |
| B | 0 | 13 | 0 |
| C | 0 | 13 | 0 |
| D | 0 | 13 | 0 |
| Mode M0 | |||
|---|---|---|---|
| Quadrant | BADHDUFLAG | Total packets | Discarded packets |
| A | 0 | 11858 | 2 |
| B | 0 | 12600 | 1 |
| C | 0 | 11666 | 1 |
| D | 0 | 16648 | 1 |
| Mode SS | |||
|---|---|---|---|
| Quadrant | BADHDUFLAG | Total packets | Discarded packets |
| A | 0 | 116 | 0 |
| B | 0 | 116 | 0 |
| C | 0 | 116 | 0 |
| D | 0 | 116 | 0 |
| Quadrant | Total seconds | Saturated seconds | Saturation percentage |
|---|---|---|---|
| A | 5635 | 31 | 0.550133% |
| B | 5635 | 101 | 1.792369% |
| C | 5635 | 11 | 0.195209% |
| D | 5635 | 450 | 7.985803% |
Noise dominated data is calculated using 1-second bins in cleaned event files. If a bin has >2000 counts, and if more than 50% of those come from <1% of pixels, then it is considered to be noise-dominated and hence unusable.
| Quadrant | # 1 sec bins | Bins with >0 counts | Bins with >2000 counts | High rate bins dominated by noise | Noise dominated (total time) | Noise dominated (detector-on time) | Marked lightcurve |
|---|---|---|---|---|---|---|---|
| A | 6946 | 5637 | 10 | 10 | 0.14% | 0.18% | 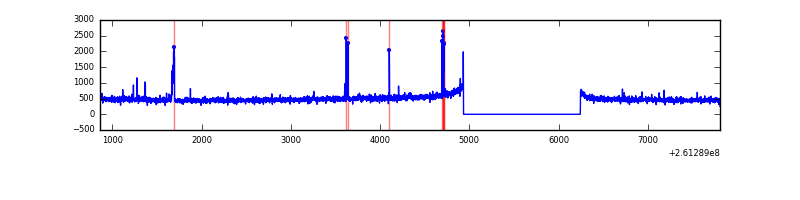 |
| B | 6946 | 5637 | 37 | 37 | 0.53% | 0.66% | 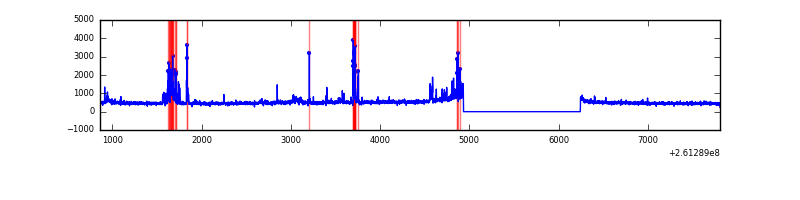 |
| C | 6946 | 5637 | 0 | 0 | 0.00% | 0.00% | 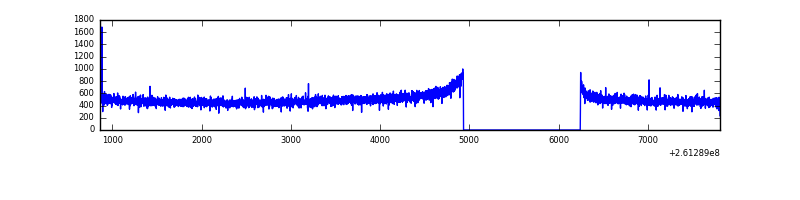 |
| D | 6946 | 5637 | 396 | 396 | 5.70% | 7.03% | 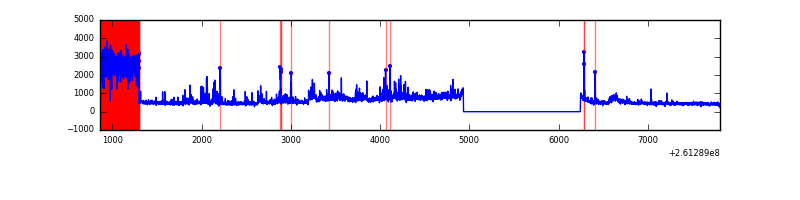 |
Top three noisy pixels from each quadrant. If the there are fewer than three noisy pixels in the level2.evt file, extra rows are filled as -1
| Pixel properties | Quadrant properties | ||||||
|---|---|---|---|---|---|---|---|
| Quadrant | DetID | PixID | Counts | Sigma | Mean | Median | Sigma |
| A | 15 | 69 | 74625 | 524.84 | 698 | 686 | 140.9 |
| A | 1 | 162 | 14787 | 100.09 | 698 | 686 | 140.9 |
| A | 0 | 23 | 14132 | 95.44 | 698 | 686 | 140.9 |
| B | 10 | 245 | 220583 | 1675.75 | 692 | 677 | 131.2 |
| B | 3 | 64 | 60223 | 453.76 | 692 | 677 | 131.2 |
| B | 0 | 219 | 32987 | 246.21 | 692 | 677 | 131.2 |
| C | 3 | 233 | 104045 | 656.36 | 679 | 685 | 157.5 |
| C | 13 | 61 | 4957 | 27.13 | 679 | 685 | 157.5 |
| C | 4 | 254 | 2728 | 12.97 | 679 | 685 | 157.5 |
| D | 5 | 222 | 1308760 | 8287.45 | 655 | 637 | 157.8 |
| D | 8 | 195 | 173516 | 1095.25 | 655 | 637 | 157.8 |
| D | 13 | 168 | 133257 | 840.19 | 655 | 637 | 157.8 |
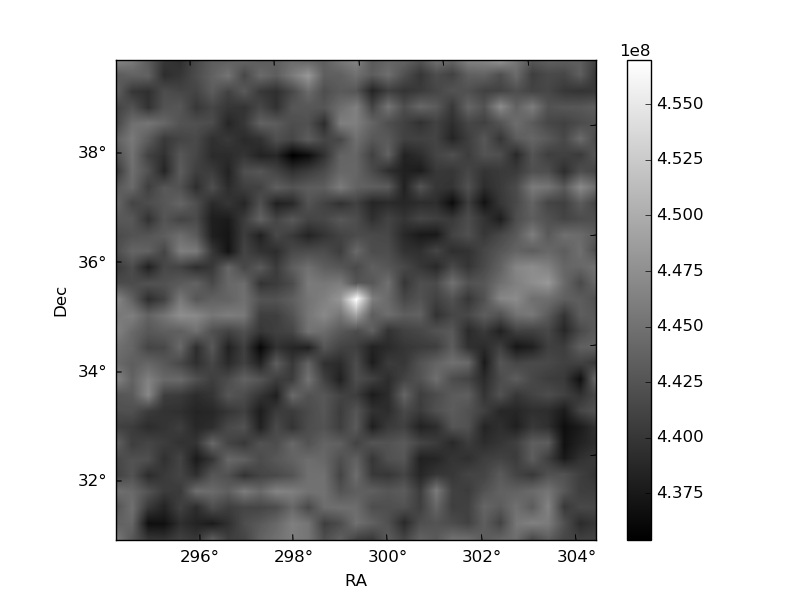
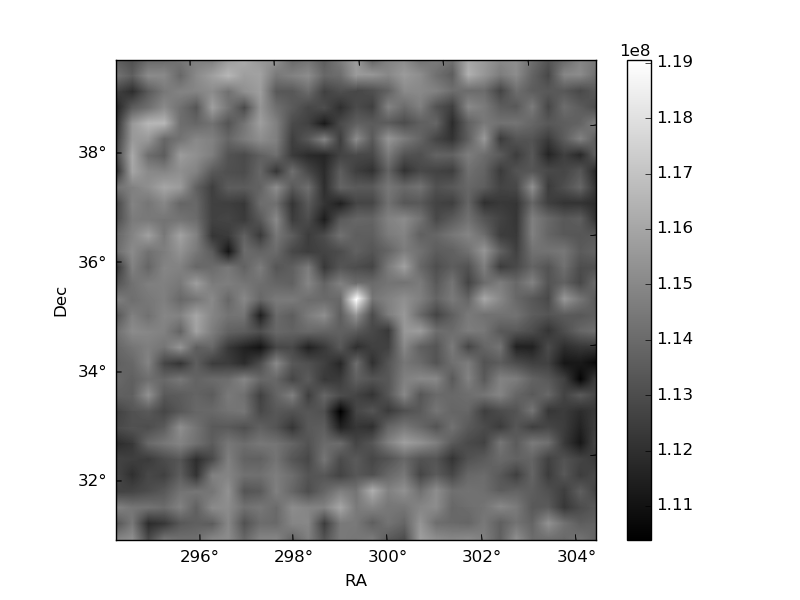
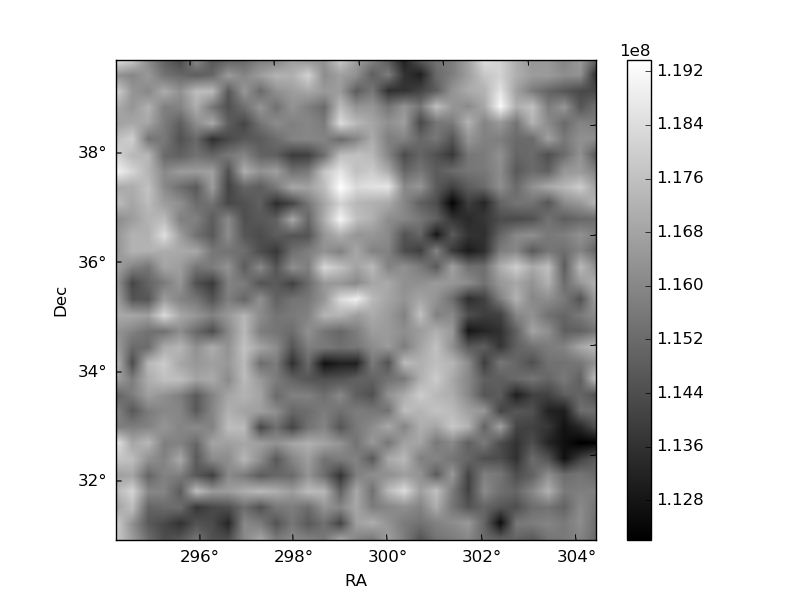
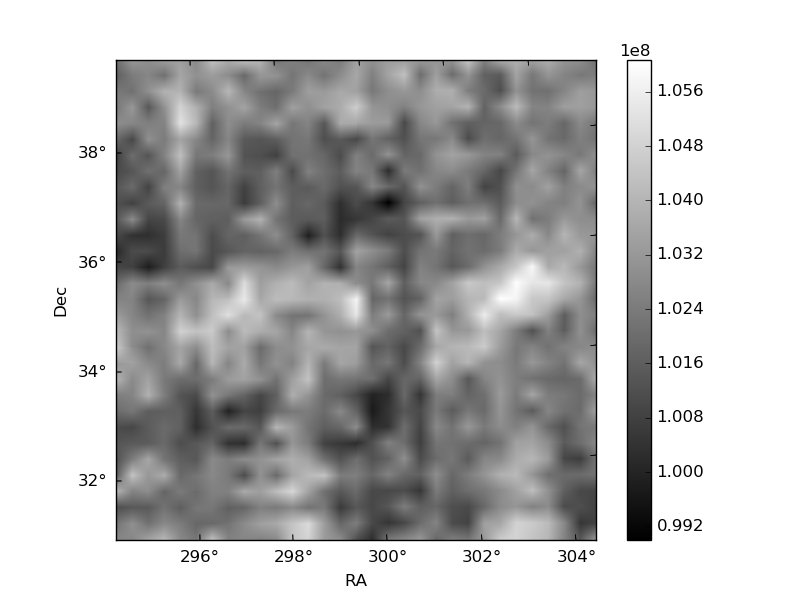
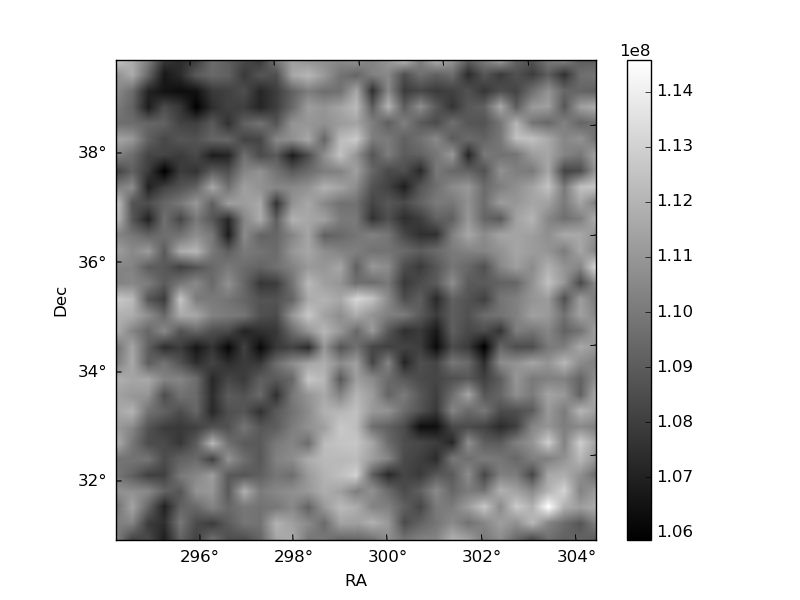
Histogram calculated using DETX and DETY for each event in the final _common_clean file
| Quadrant A | 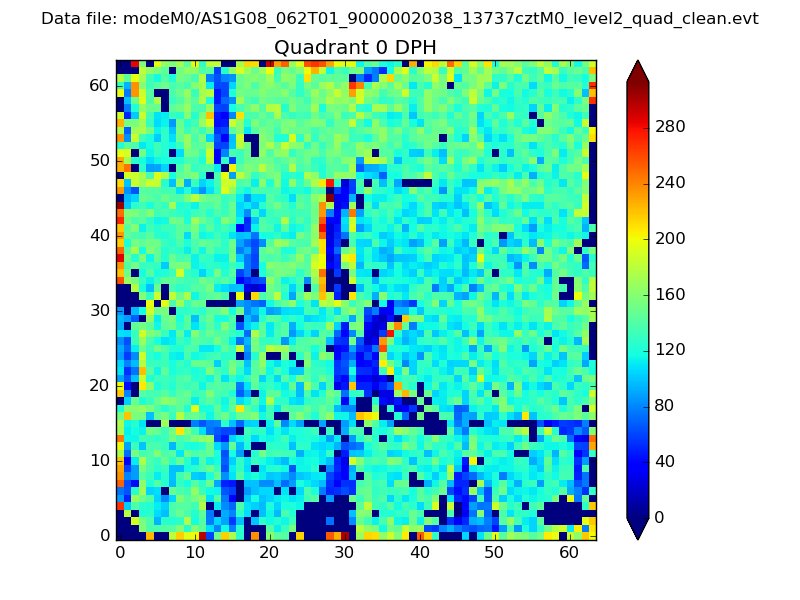 |
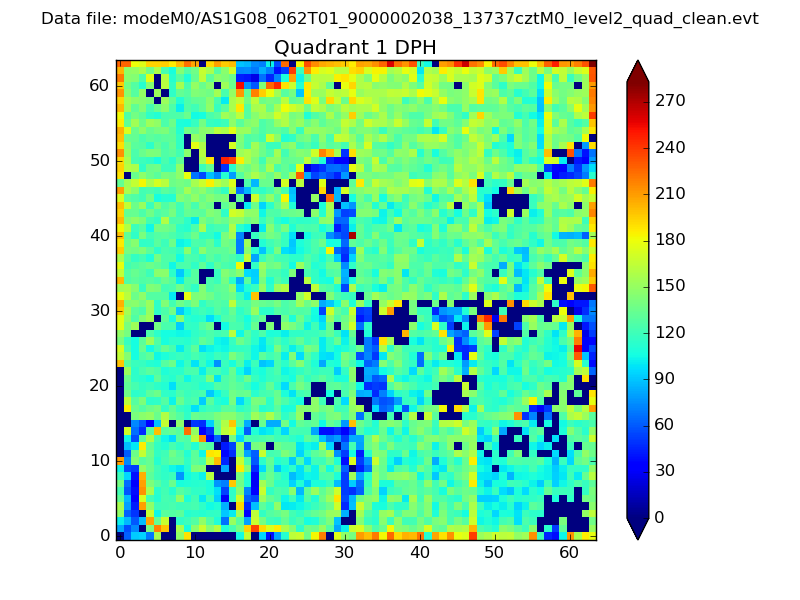 |
Quadrant B |
|---|---|---|---|
| Quadrant D | 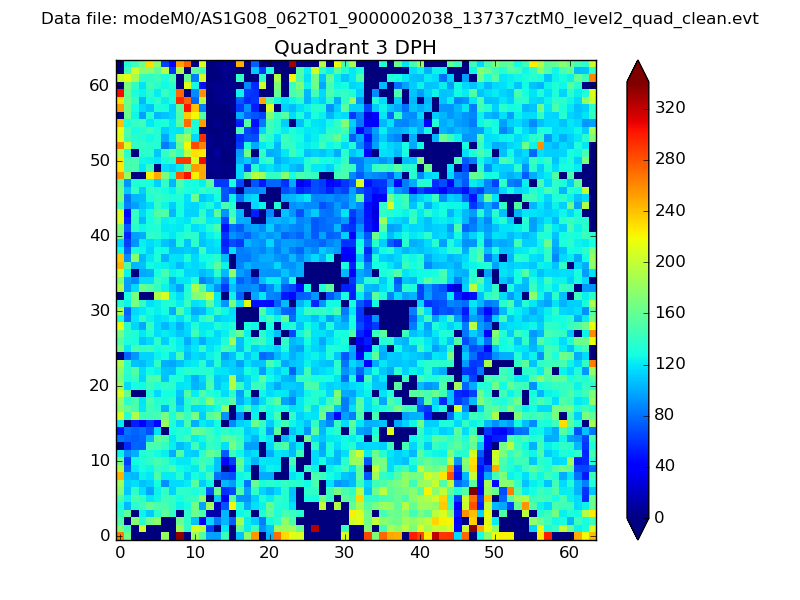 |
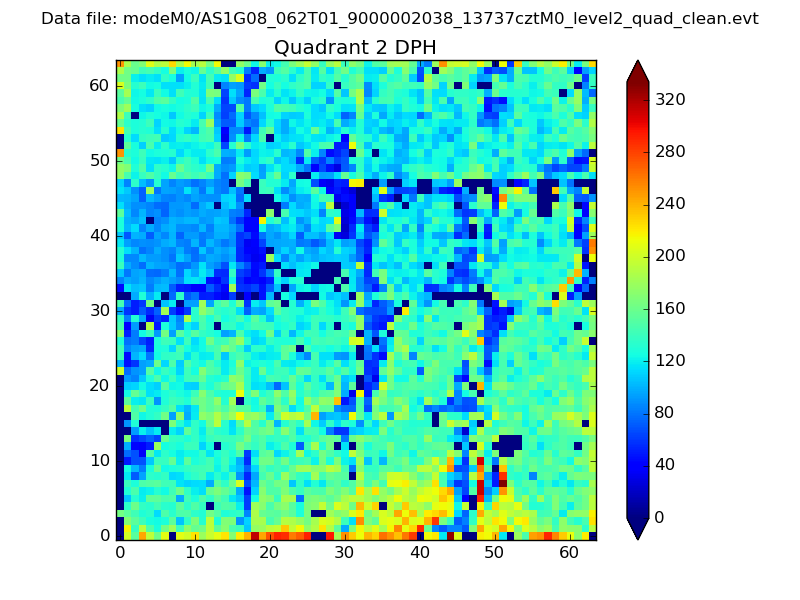 |
Quadrant C |
| Plot type | Count rate plots | Images |
|---|---|---|
| Comparison with Poisson distribution Blue bars denote a histogram of data divided into 1 sec bins. Red curve is a Poisson curve with rate = median count rate of data. |
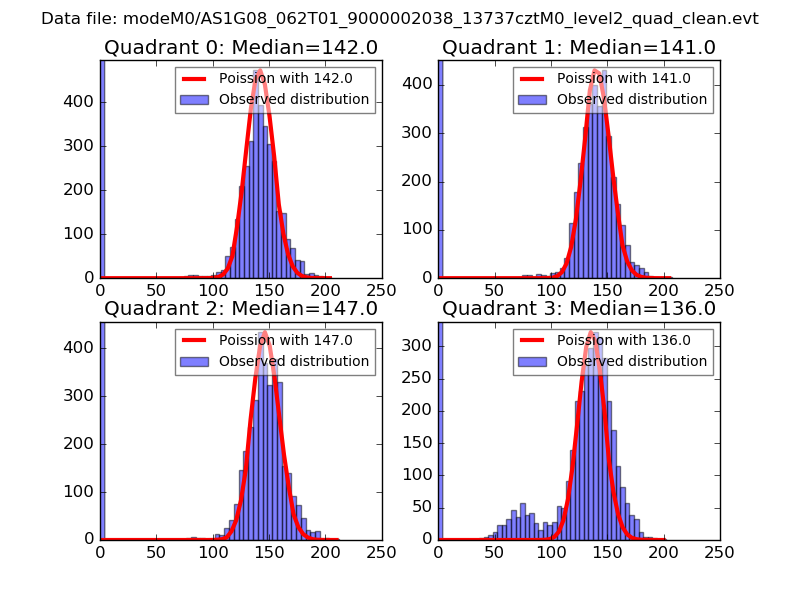 |
 |
| Quadrant-wise count rates Data is divided into 100 sec bins |
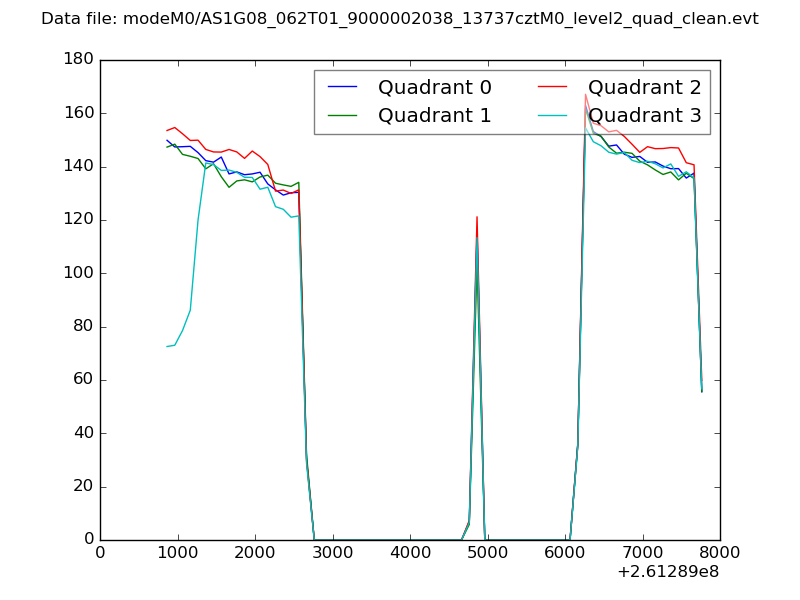 |
|
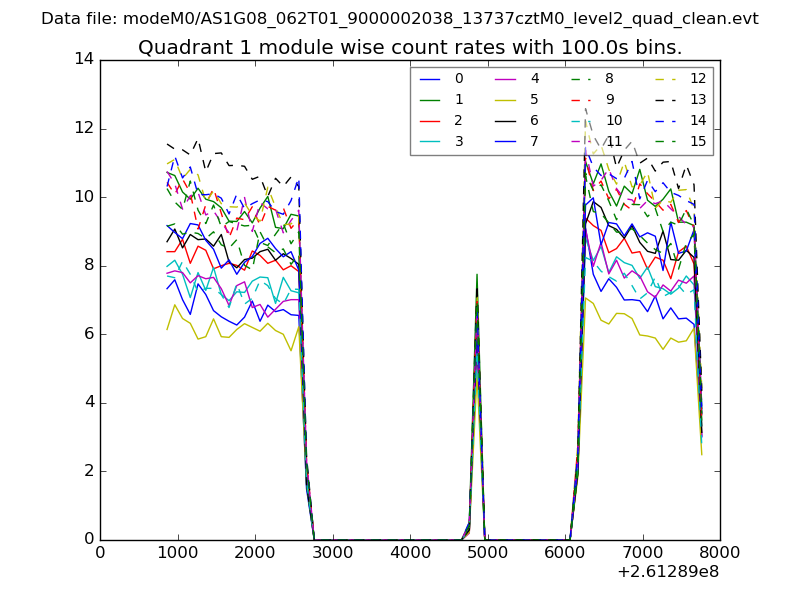
| Module-wise count rates for Quadrant A Data is divided into 100 sec bins |
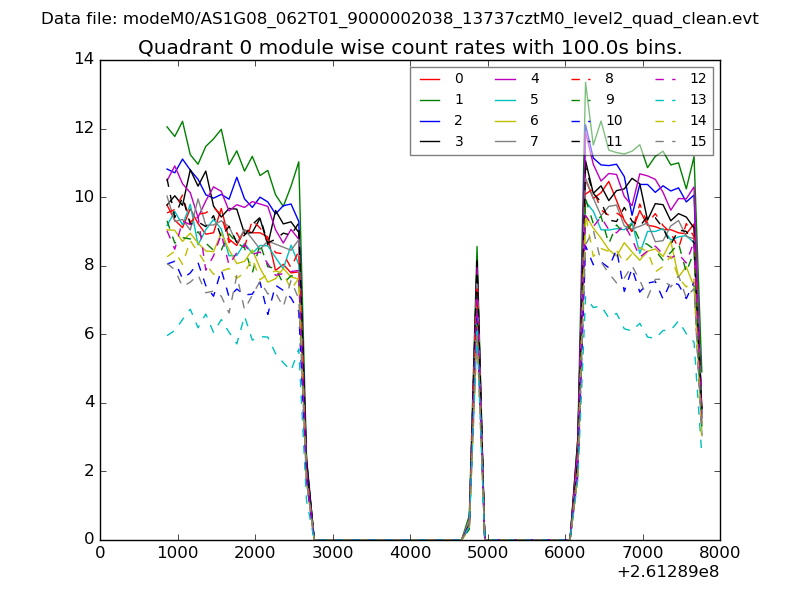 |
 |
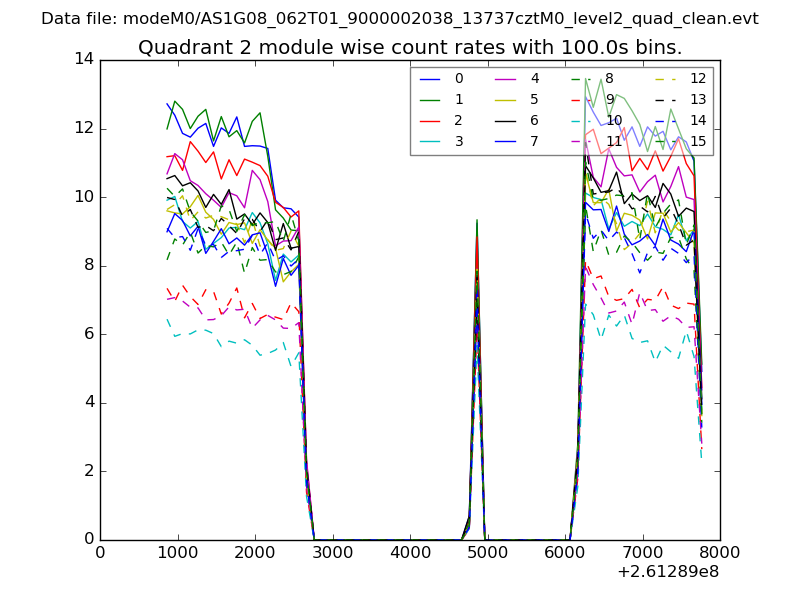
| Module-wise count rates for Quadrant B Data is divided into 100 sec bins |
 |
 |
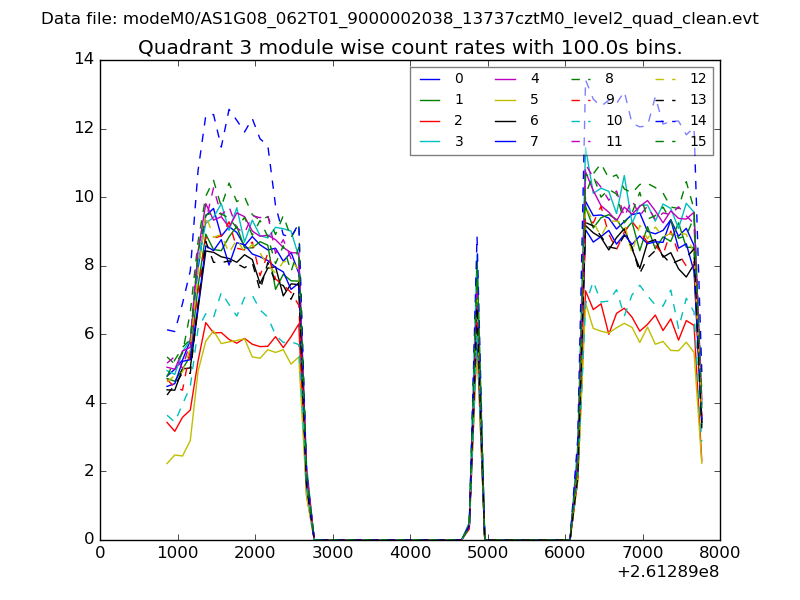
| Module-wise count rates for Quadrant C Data is divided into 100 sec bins |
 |
 |
| Module-wise count rates for Quadrant D Data is divided into 100 sec bins |
 |
 |
| Parameter | Plot |
|---|---|
| CZT HV Monitor | 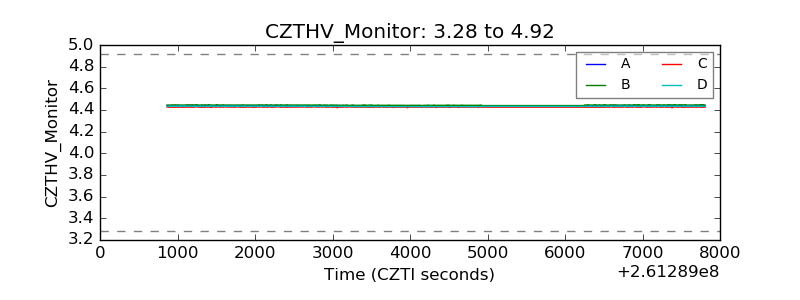 |
| D_VDD | 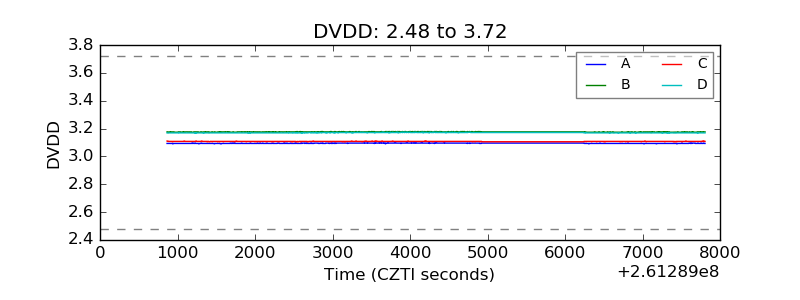 |
| Temperature 1 | 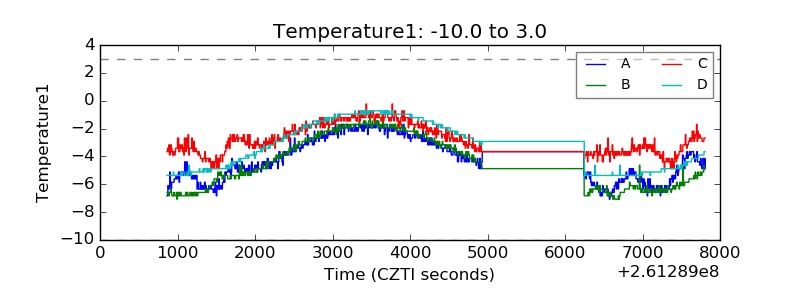 |
| Veto HV Monitor | 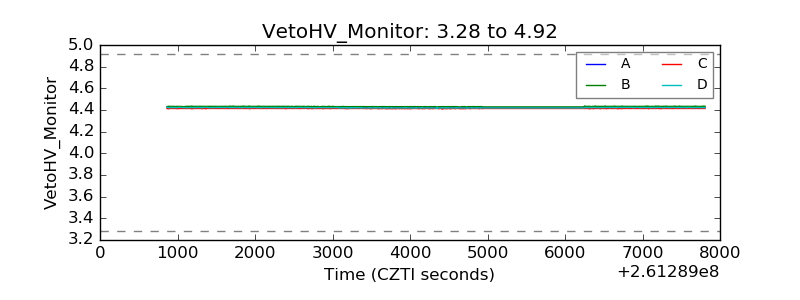 |
| Veto LLD | 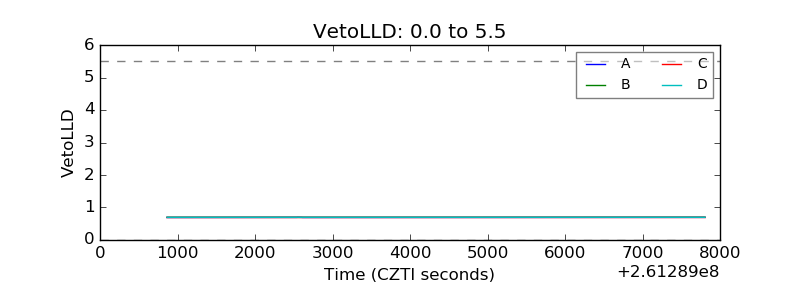 |
| Alpha Counter | 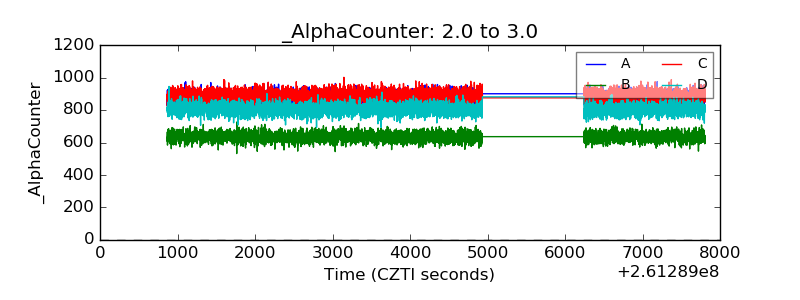 |
| _CPM_Rate | 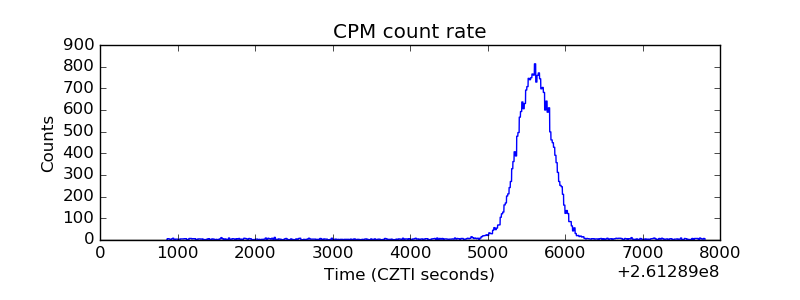 |
| CZT Counter | 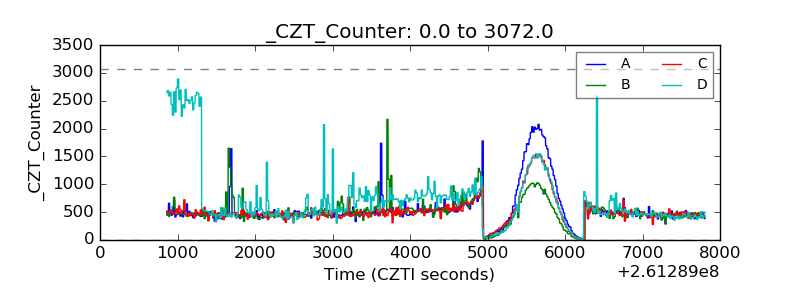 |
| +2.5 Volts monitor |  |
| +5 Volts monitor | 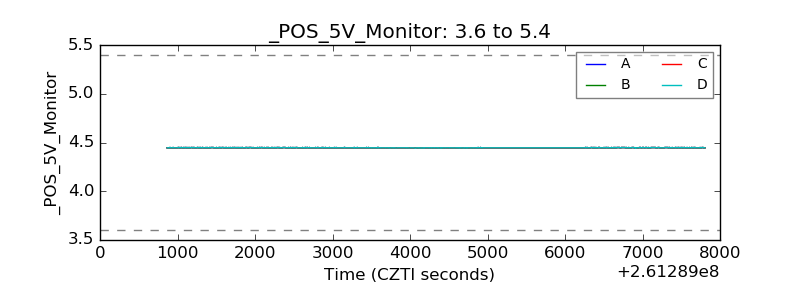 |
| _ROLL_ROT | 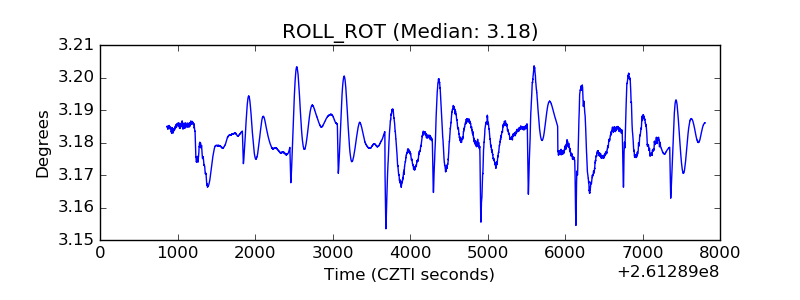 |
| _Roll_DEC | 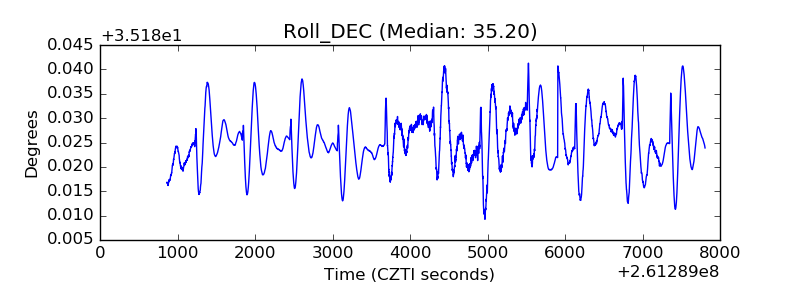 |
| _Roll_RA | 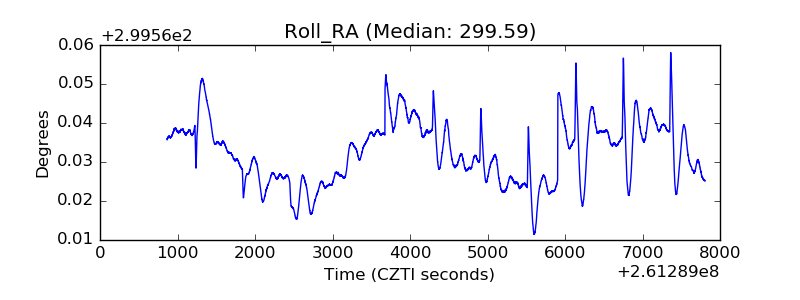 |
| Veto Counter | 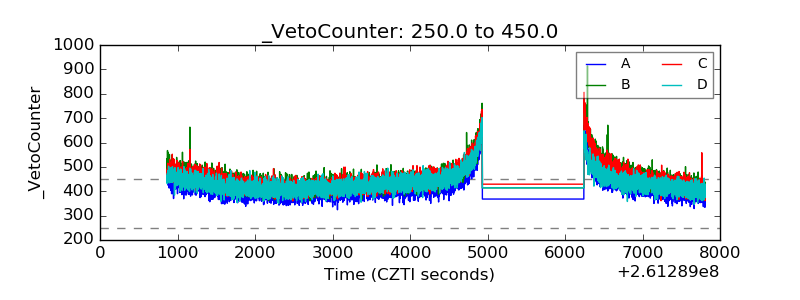 |