| Param | Original file | Final file |
|---|---|---|
| Filename | modeM0/AS1G08_062T01_9000002038_13738cztM0_level2.evt | modeM0/AS1G08_062T01_9000002038_13738cztM0_level2_quad_clean.evt |
| Size (bytes) | 434,712,960 | 89,902,080 |
| Size | 414.6 MB | 85.7 MB |
| Events in quadrant A | 3,006,096 | 569,605 |
| Events in quadrant B | 3,173,472 | 563,791 |
| Events in quadrant C | 3,042,858 | 589,999 |
| Events in quadrant D | 3,519,283 | 564,101 |
| Mode M9 | |||
|---|---|---|---|
| Quadrant | BADHDUFLAG | Total packets | Discarded packets |
| A | 0 | 10 | 0 |
| B | 0 | 10 | 0 |
| C | 0 | 10 | 0 |
| D | 0 | 10 | 0 |
| Mode M0 | |||
|---|---|---|---|
| Quadrant | BADHDUFLAG | Total packets | Discarded packets |
| A | 0 | 12919 | 2 |
| B | 0 | 13486 | 1 |
| C | 0 | 12924 | 1 |
| D | 0 | 14907 | 1 |
| Mode SS | |||
|---|---|---|---|
| Quadrant | BADHDUFLAG | Total packets | Discarded packets |
| A | 0 | 128 | 0 |
| B | 0 | 128 | 0 |
| C | 0 | 128 | 0 |
| D | 0 | 128 | 0 |
| Quadrant | Total seconds | Saturated seconds | Saturation percentage |
|---|---|---|---|
| A | 6227 | 47 | 0.754778% |
| B | 6227 | 67 | 1.075960% |
| C | 6227 | 17 | 0.273005% |
| D | 6227 | 22 | 0.353300% |
Noise dominated data is calculated using 1-second bins in cleaned event files. If a bin has >2000 counts, and if more than 50% of those come from <1% of pixels, then it is considered to be noise-dominated and hence unusable.
| Quadrant | # 1 sec bins | Bins with >0 counts | Bins with >2000 counts | High rate bins dominated by noise | Noise dominated (total time) | Noise dominated (detector-on time) | Marked lightcurve |
|---|---|---|---|---|---|---|---|
| A | 7233 | 6229 | 0 | 0 | 0.00% | 0.00% | 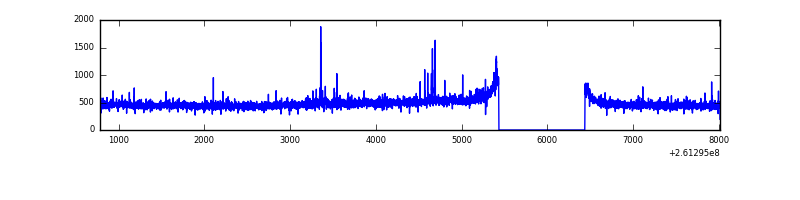 |
| B | 7233 | 6229 | 14 | 14 | 0.19% | 0.22% | 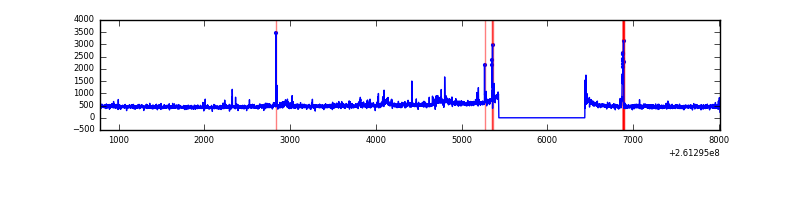 |
| C | 7233 | 6229 | 3 | 3 | 0.04% | 0.05% | 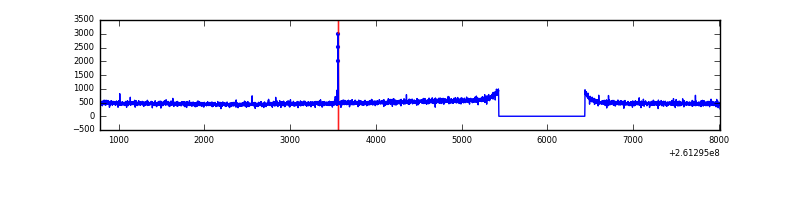 |
| D | 7233 | 6229 | 2 | 2 | 0.03% | 0.03% | 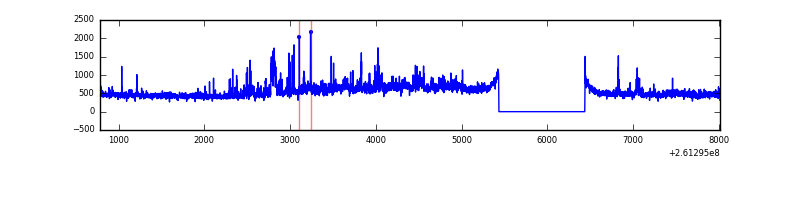 |
Top three noisy pixels from each quadrant. If the there are fewer than three noisy pixels in the level2.evt file, extra rows are filled as -1
| Pixel properties | Quadrant properties | ||||||
|---|---|---|---|---|---|---|---|
| Quadrant | DetID | PixID | Counts | Sigma | Mean | Median | Sigma |
| A | 15 | 69 | 25290 | 157.48 | 768 | 754 | 155.8 |
| A | 1 | 162 | 11103 | 66.42 | 768 | 754 | 155.8 |
| A | 0 | 226 | 6987 | 40.01 | 768 | 754 | 155.8 |
| B | 0 | 219 | 69042 | 468.0 | 761 | 743 | 145.9 |
| B | 4 | 48 | 42399 | 285.44 | 761 | 743 | 145.9 |
| B | 3 | 64 | 31043 | 207.62 | 761 | 743 | 145.9 |
| C | 3 | 233 | 117743 | 672.18 | 746 | 750 | 174.1 |
| C | 14 | 234 | 11024 | 59.03 | 746 | 750 | 174.1 |
| C | 0 | 207 | 6985 | 35.82 | 746 | 750 | 174.1 |
| D | 13 | 168 | 264849 | 1371.24 | 741 | 724 | 192.6 |
| D | 5 | 222 | 180449 | 933.07 | 741 | 724 | 192.6 |
| D | 8 | 195 | 107247 | 553.03 | 741 | 724 | 192.6 |
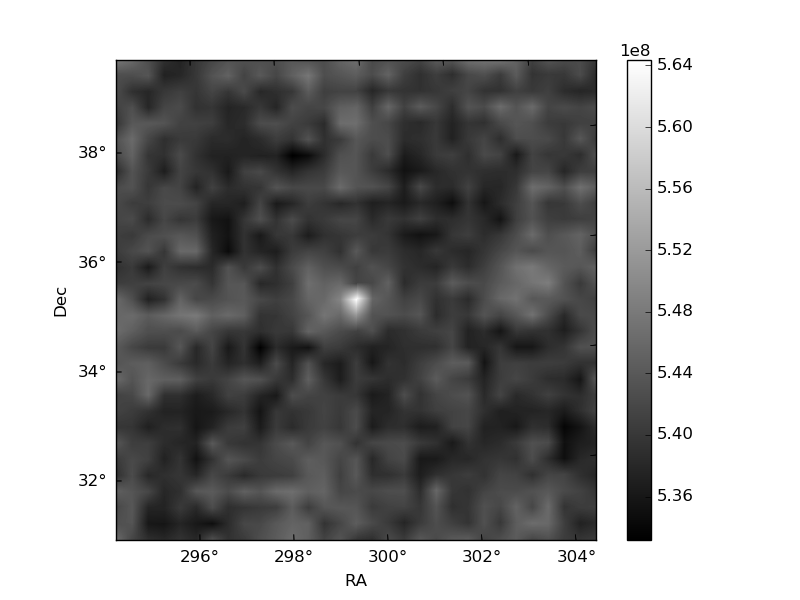
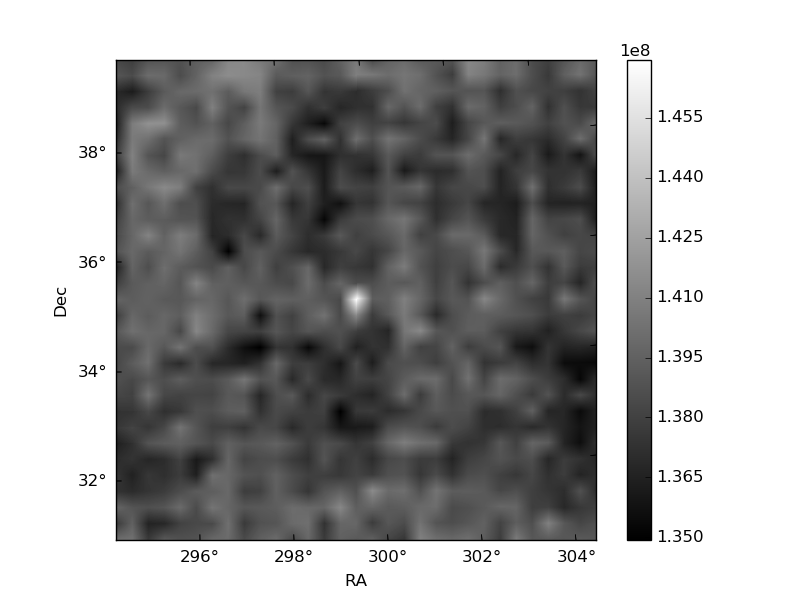
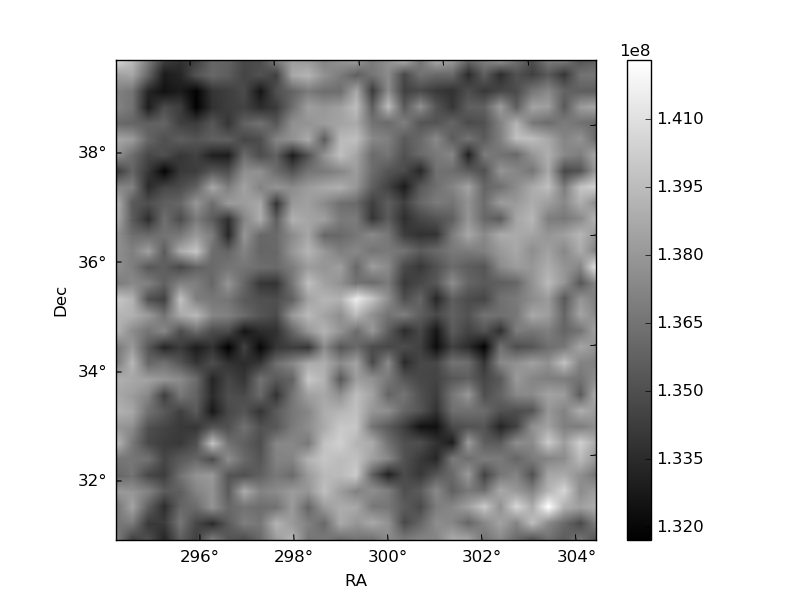
Histogram calculated using DETX and DETY for each event in the final _common_clean file
| Quadrant A | 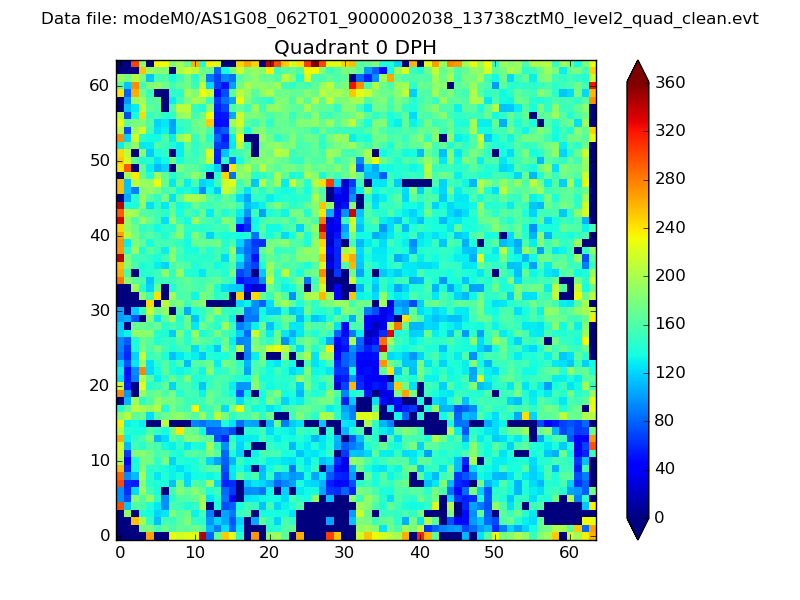 |
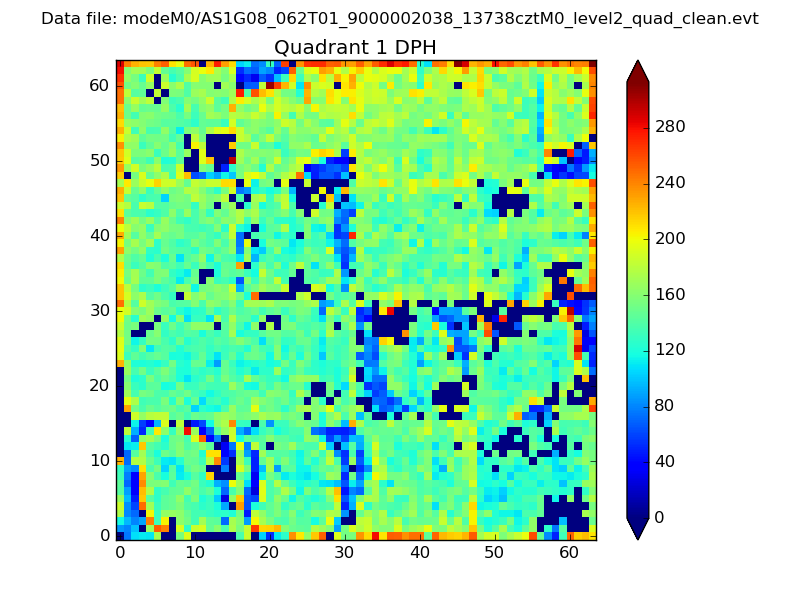 |
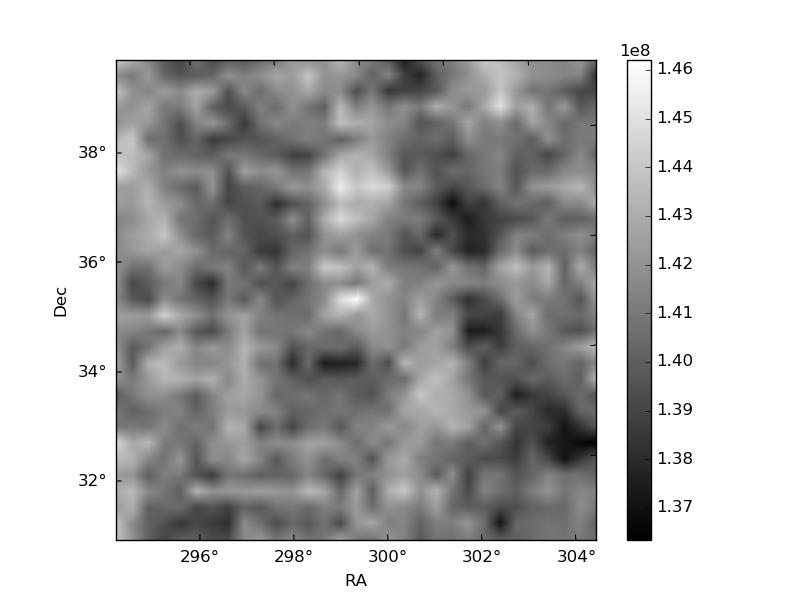
Quadrant B |
|---|---|---|---|
| Quadrant D | 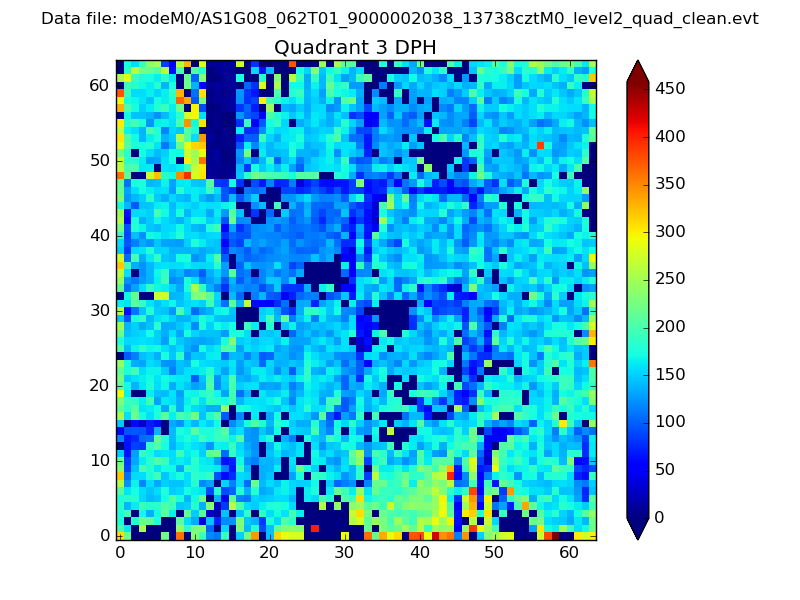 |
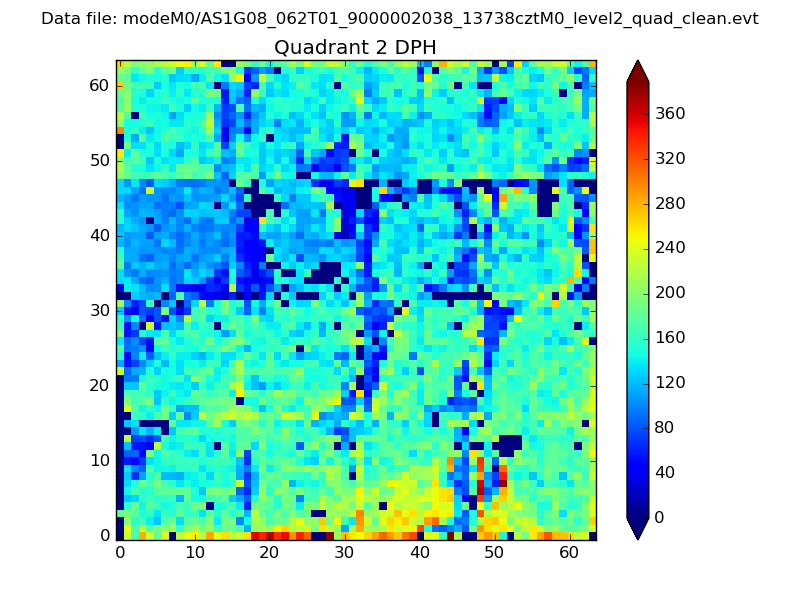 |
Quadrant C |
| Plot type | Count rate plots | Images |
|---|---|---|
| Comparison with Poisson distribution Blue bars denote a histogram of data divided into 1 sec bins. Red curve is a Poisson curve with rate = median count rate of data. |
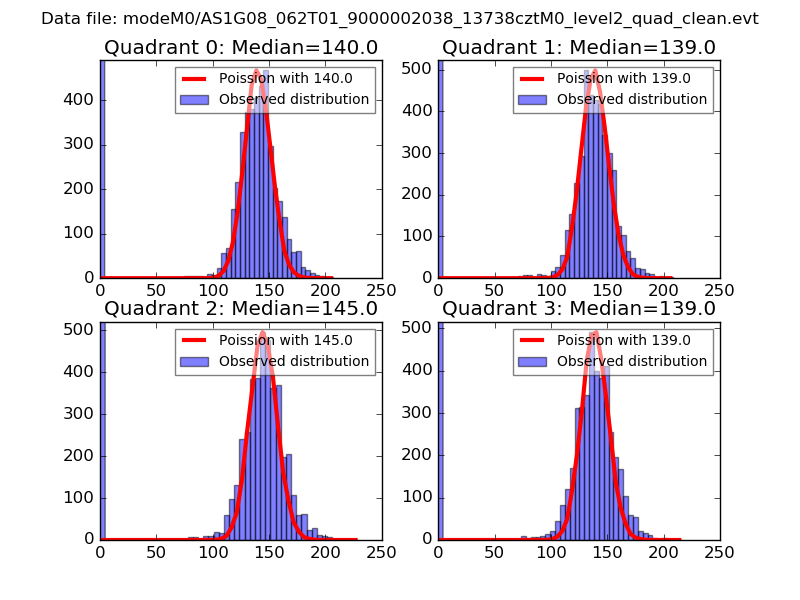 |
 |
| Quadrant-wise count rates Data is divided into 100 sec bins |
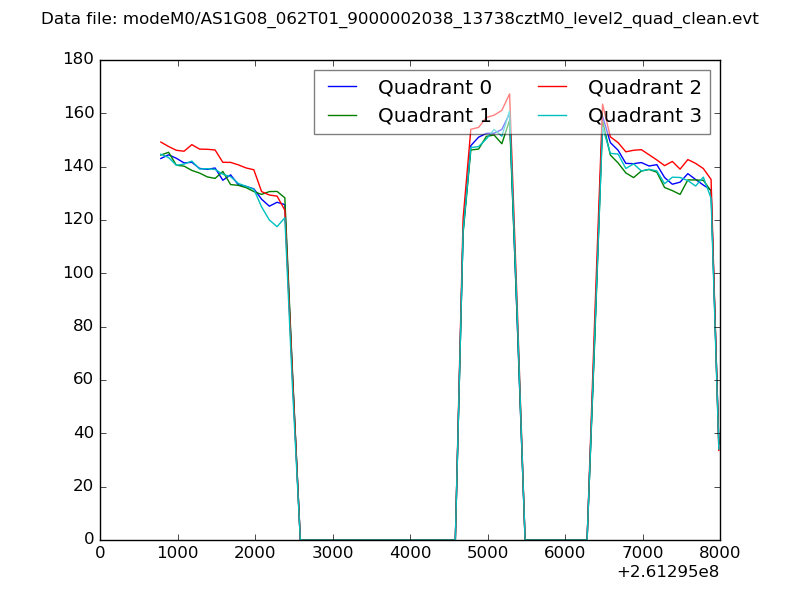 |
|
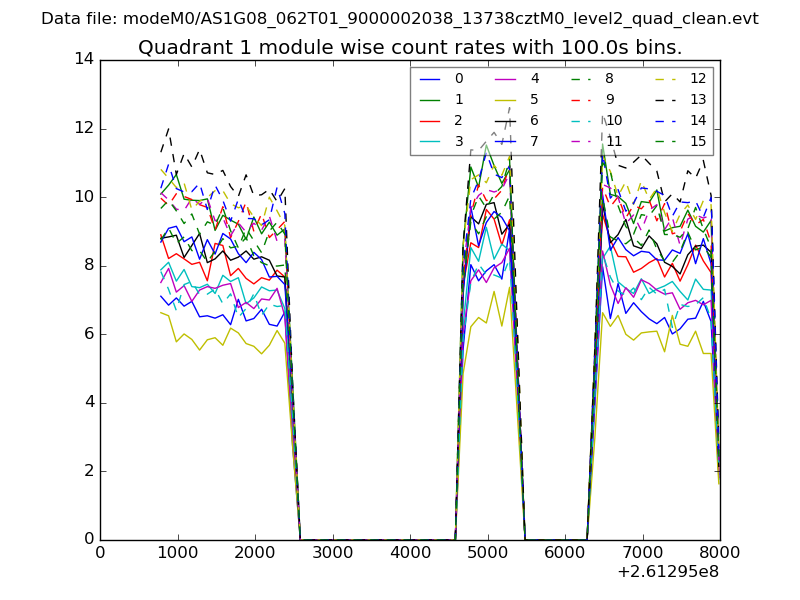
| Module-wise count rates for Quadrant A Data is divided into 100 sec bins |
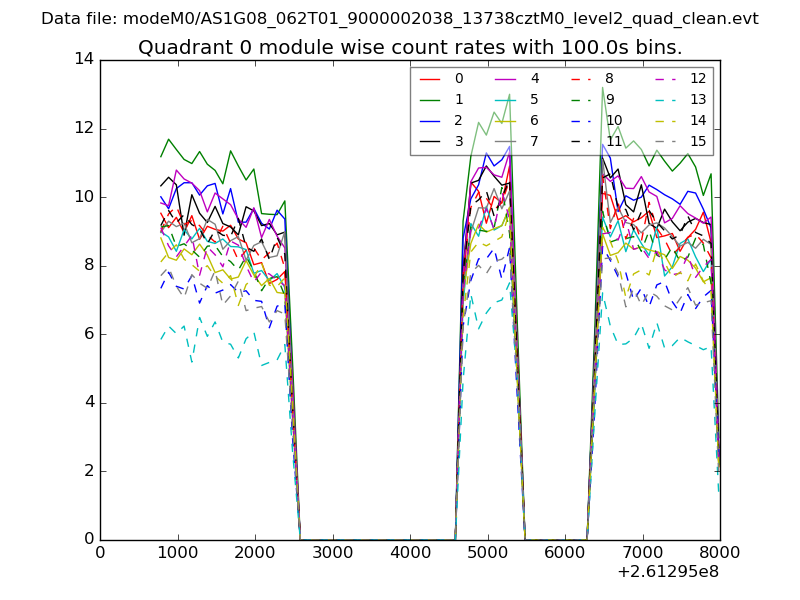 |
 |
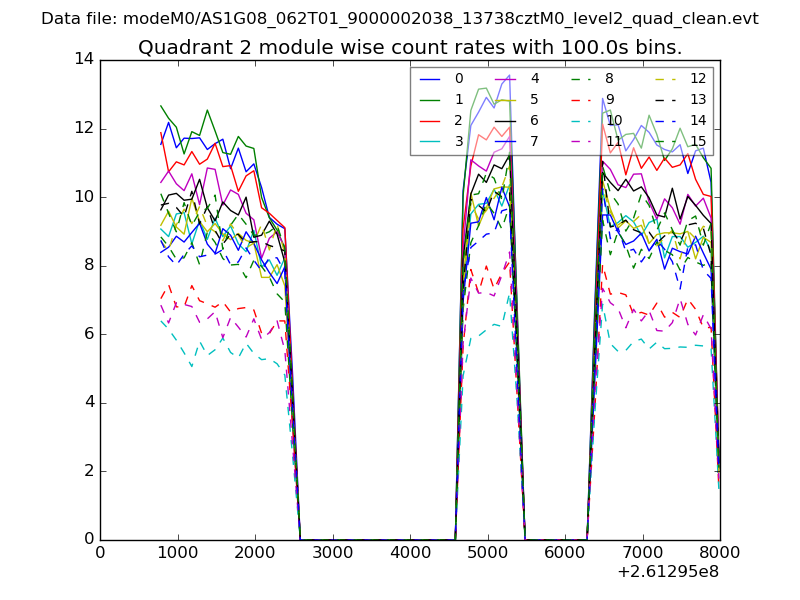
| Module-wise count rates for Quadrant B Data is divided into 100 sec bins |
 |
 |
| Module-wise count rates for Quadrant C Data is divided into 100 sec bins |
 |
 |
| Module-wise count rates for Quadrant D Data is divided into 100 sec bins |
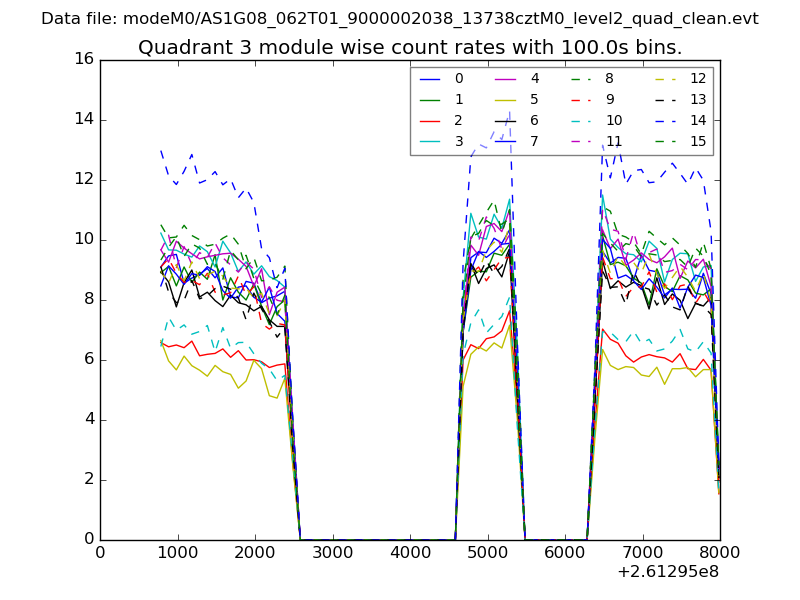 |
 |
| Parameter | Plot |
|---|---|
| CZT HV Monitor | 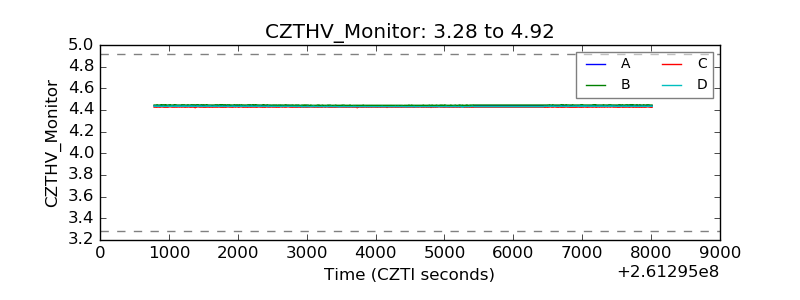 |
| D_VDD | 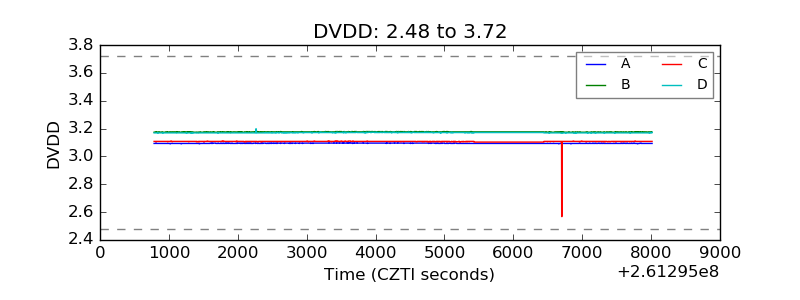 |
| Temperature 1 |  |
| Veto HV Monitor |  |
| Veto LLD | 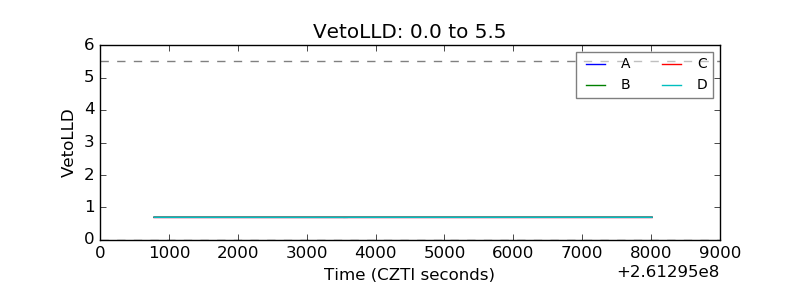 |
| Alpha Counter | 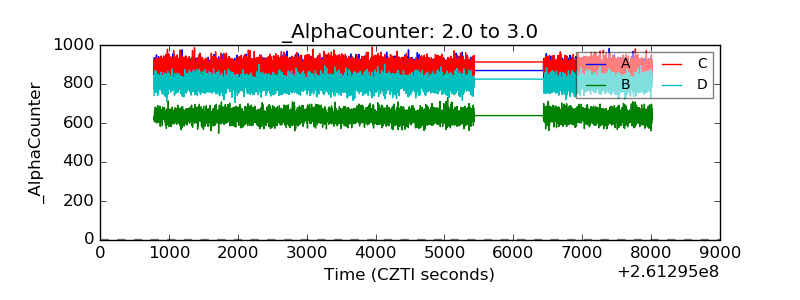 |
| _CPM_Rate | 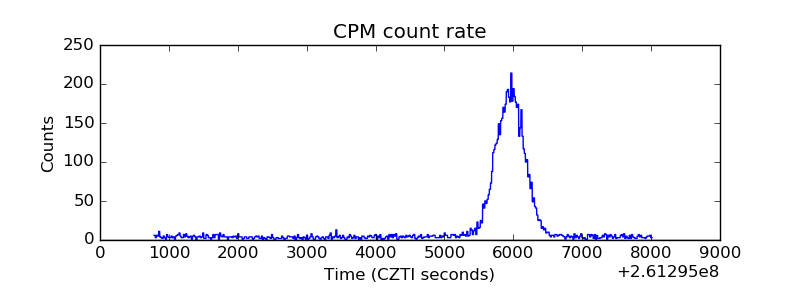 |
| CZT Counter | 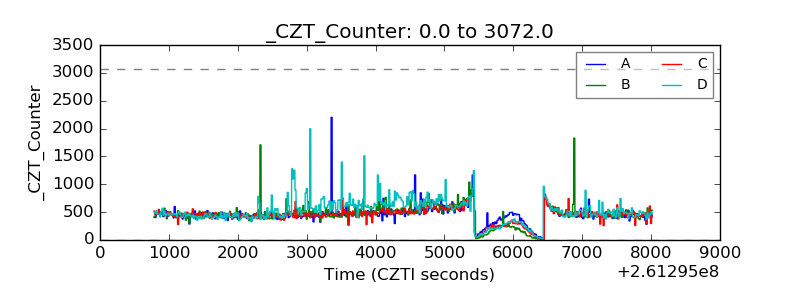 |
| +2.5 Volts monitor | 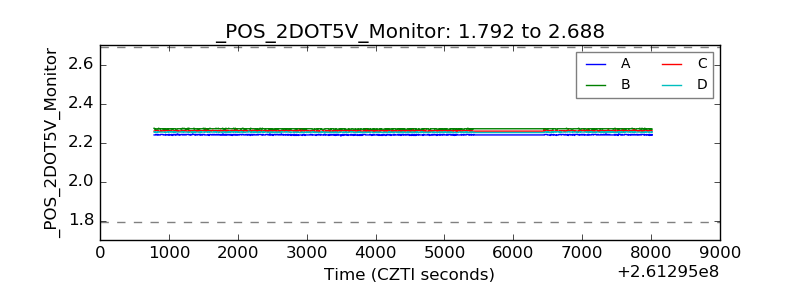 |
| +5 Volts monitor | 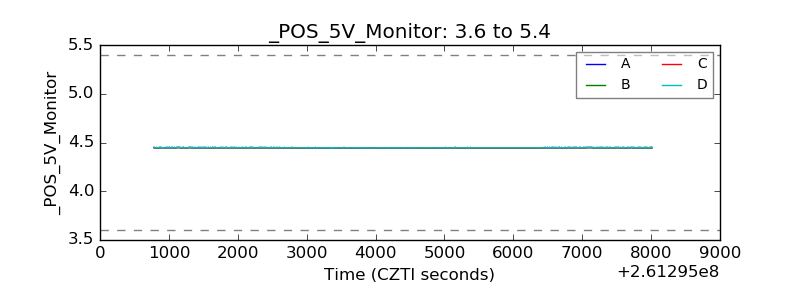 |
| _ROLL_ROT |  |
| _Roll_DEC |  |
| _Roll_RA | 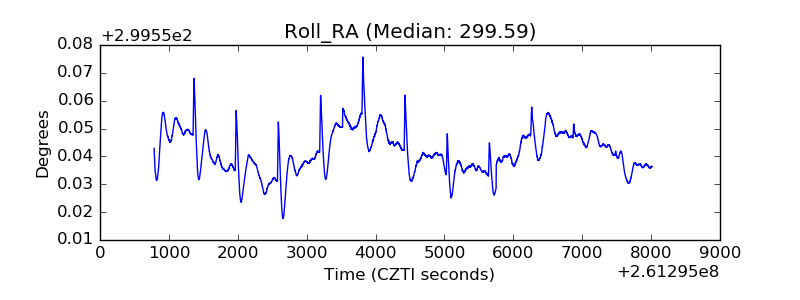 |
| Veto Counter | 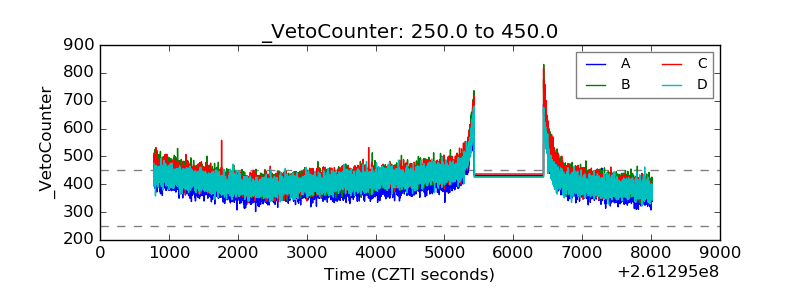 |