| Param | Original file | Final file |
|---|---|---|
| Filename | modeM0/AS1G08_062T01_9000002038_13739cztM0_level2.evt | modeM0/AS1G08_062T01_9000002038_13739cztM0_level2_quad_clean.evt |
| Size (bytes) | 495,446,400 | 98,769,600 |
| Size | 472.5 MB | 94.2 MB |
| Events in quadrant A | 3,230,196 | 627,620 |
| Events in quadrant B | 3,571,177 | 621,114 |
| Events in quadrant C | 3,331,993 | 651,912 |
| Events in quadrant D | 4,410,590 | 617,575 |
| Mode M9 | |||
|---|---|---|---|
| Quadrant | BADHDUFLAG | Total packets | Discarded packets |
| A | 0 | 5 | 0 |
| B | 0 | 5 | 0 |
| C | 0 | 5 | 0 |
| D | 0 | 5 | 0 |
| Mode M0 | |||
|---|---|---|---|
| Quadrant | BADHDUFLAG | Total packets | Discarded packets |
| A | 0 | 13979 | 3 |
| B | 0 | 14940 | 2 |
| C | 0 | 14069 | 2 |
| D | 0 | 17834 | 2 |
| Mode SS | |||
|---|---|---|---|
| Quadrant | BADHDUFLAG | Total packets | Discarded packets |
| A | 0 | 138 | 0 |
| B | 0 | 138 | 0 |
| C | 0 | 138 | 0 |
| D | 0 | 138 | 0 |
| Quadrant | Total seconds | Saturated seconds | Saturation percentage |
|---|---|---|---|
| A | 6783 | 143 | 2.108212% |
| B | 6783 | 172 | 2.535751% |
| C | 6783 | 94 | 1.385817% |
| D | 6783 | 149 | 2.196668% |
Noise dominated data is calculated using 1-second bins in cleaned event files. If a bin has >2000 counts, and if more than 50% of those come from <1% of pixels, then it is considered to be noise-dominated and hence unusable.
| Quadrant | # 1 sec bins | Bins with >0 counts | Bins with >2000 counts | High rate bins dominated by noise | Noise dominated (total time) | Noise dominated (detector-on time) | Marked lightcurve |
|---|---|---|---|---|---|---|---|
| A | 7314 | 6785 | 3 | 3 | 0.04% | 0.04% |  |
| B | 7314 | 6786 | 23 | 23 | 0.31% | 0.34% | 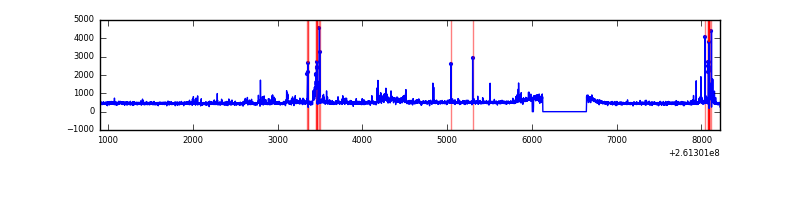 |
| C | 7314 | 6786 | 1 | 1 | 0.01% | 0.01% | 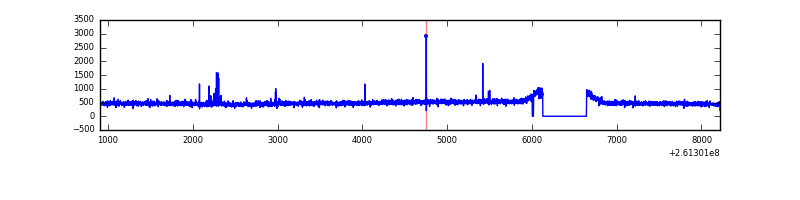 |
| D | 7314 | 6786 | 27 | 27 | 0.37% | 0.40% | 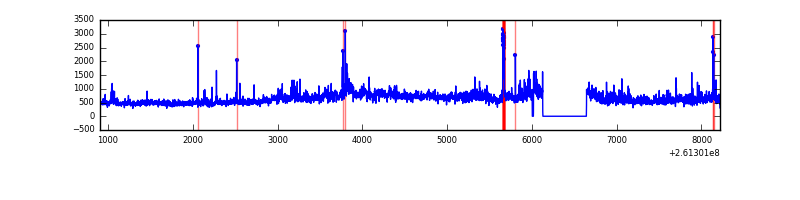 |
Top three noisy pixels from each quadrant. If the there are fewer than three noisy pixels in the level2.evt file, extra rows are filled as -1
| Pixel properties | Quadrant properties | ||||||
|---|---|---|---|---|---|---|---|
| Quadrant | DetID | PixID | Counts | Sigma | Mean | Median | Sigma |
| A | 15 | 69 | 27622 | 155.77 | 828 | 810 | 172.1 |
| A | 1 | 162 | 14696 | 80.68 | 828 | 810 | 172.1 |
| A | 0 | 226 | 7528 | 39.03 | 828 | 810 | 172.1 |
| B | 3 | 64 | 192630 | 1207.25 | 820 | 799 | 158.9 |
| B | 10 | 252 | 55146 | 342.02 | 820 | 799 | 158.9 |
| B | 4 | 173 | 46873 | 289.95 | 820 | 799 | 158.9 |
| C | 3 | 233 | 123918 | 654.26 | 807 | 814 | 188.2 |
| C | 0 | 207 | 48880 | 255.46 | 807 | 814 | 188.2 |
| C | 14 | 234 | 7196 | 33.92 | 807 | 814 | 188.2 |
| D | 13 | 168 | 601178 | 2964.72 | 803 | 780 | 202.5 |
| D | 5 | 222 | 300099 | 1478.01 | 803 | 780 | 202.5 |
| D | 10 | 157 | 177076 | 870.54 | 803 | 780 | 202.5 |
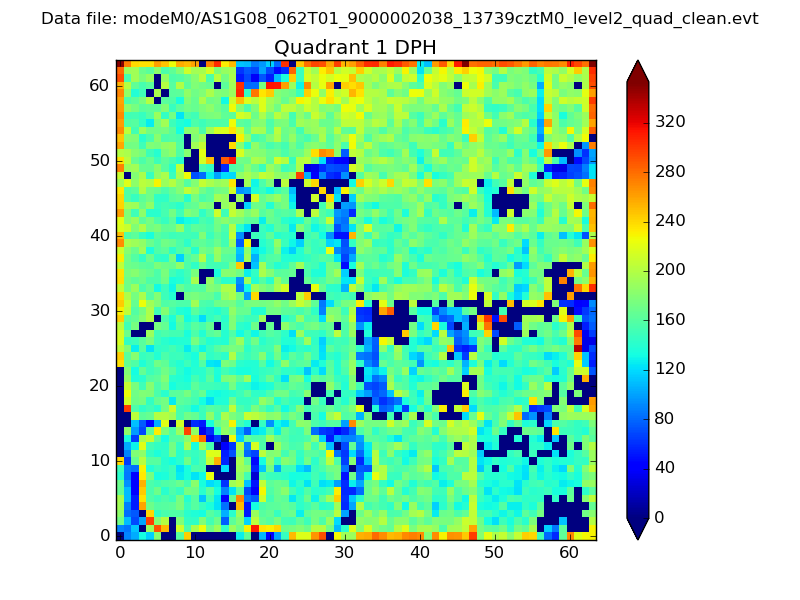
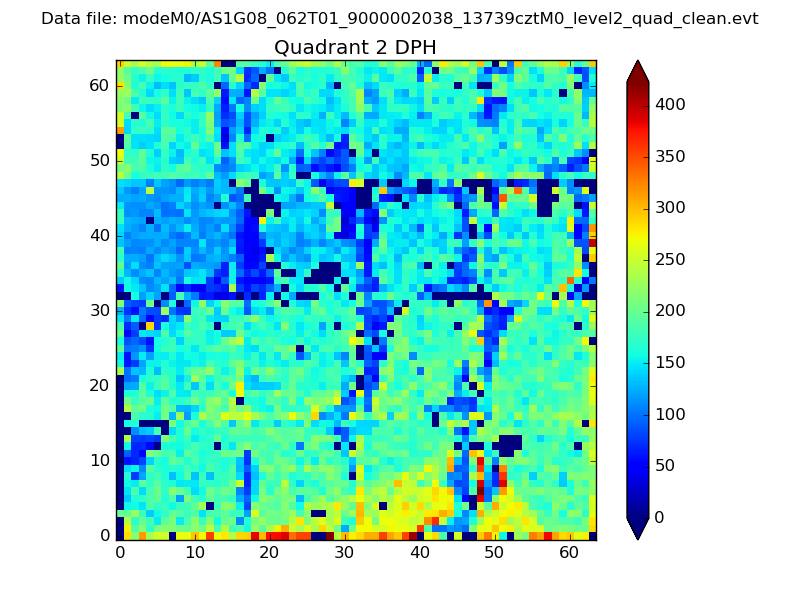
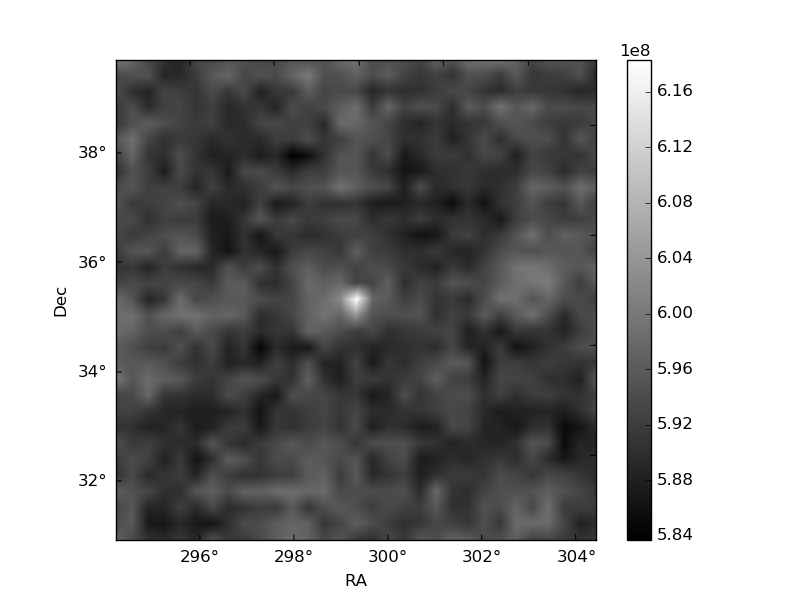
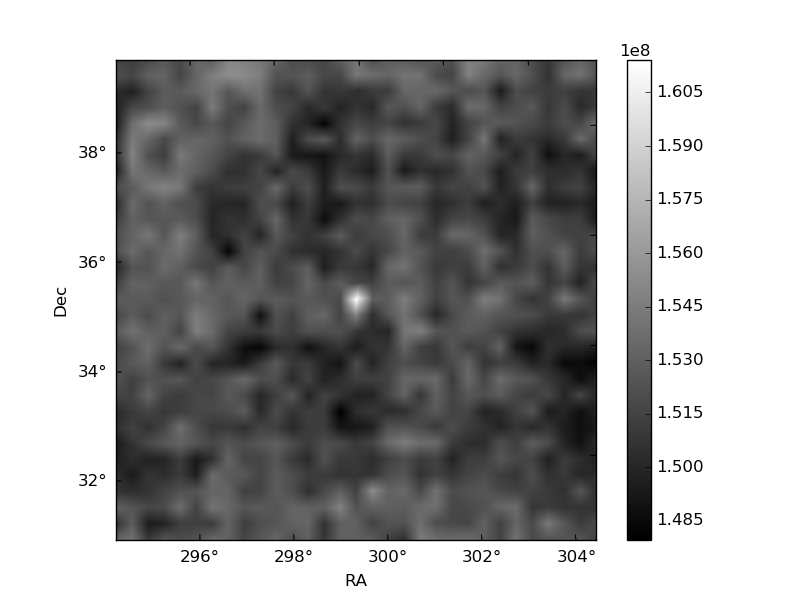
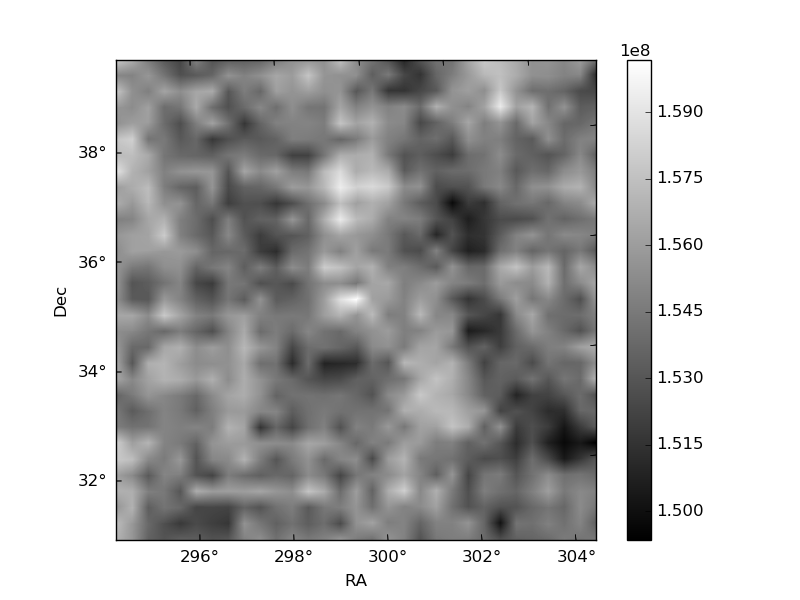
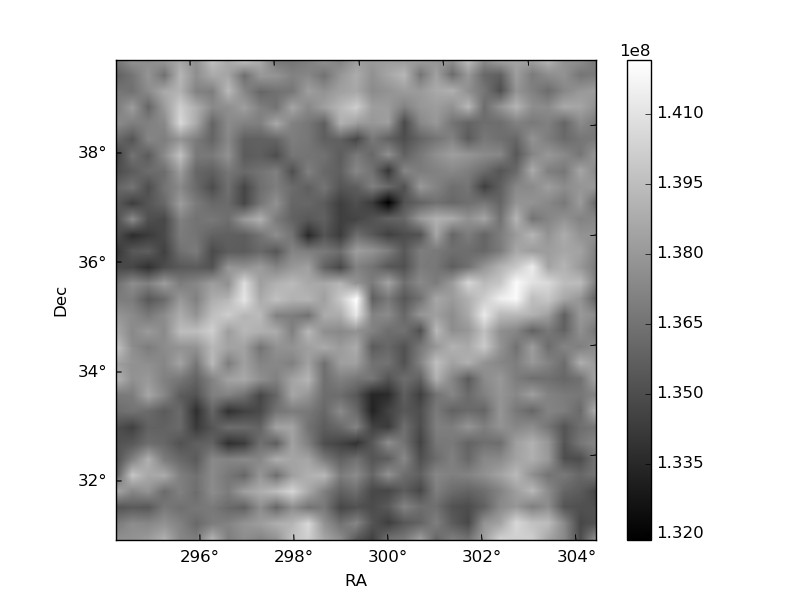
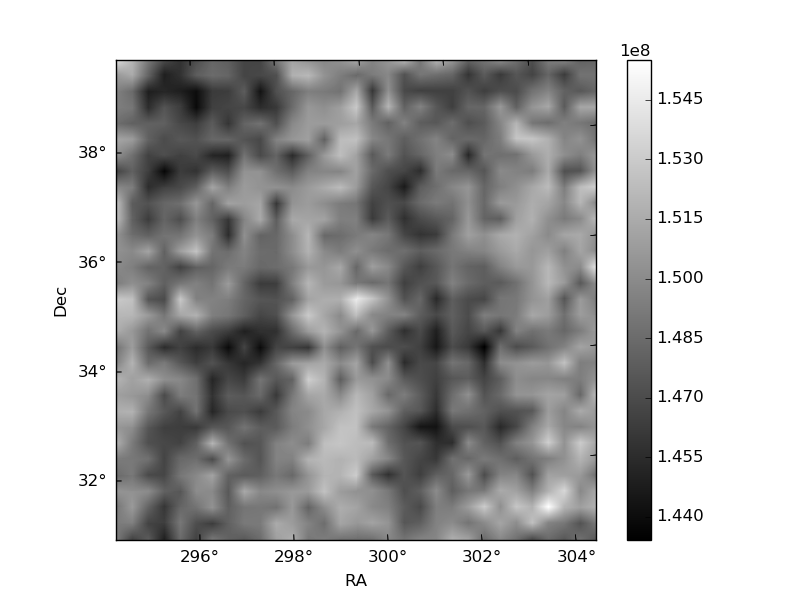
Histogram calculated using DETX and DETY for each event in the final _common_clean file
| Quadrant A | 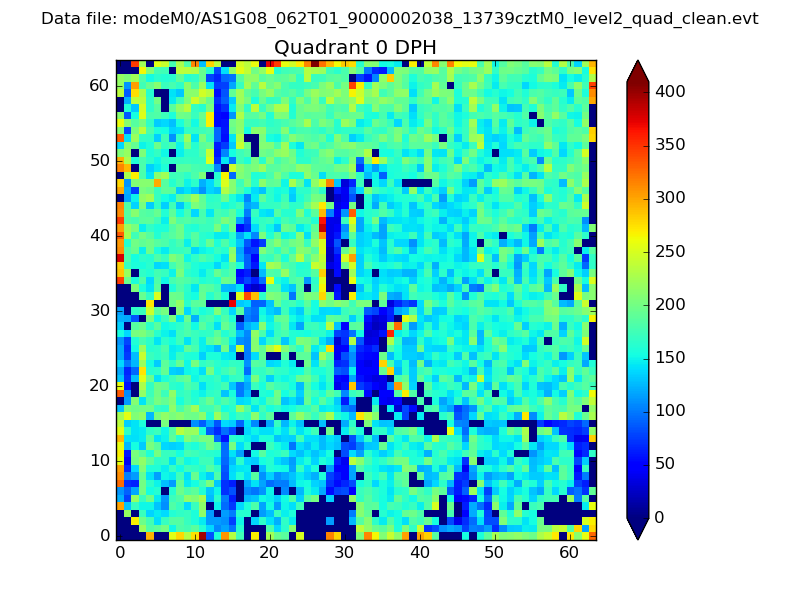 |
 |
Quadrant B |
|---|---|---|---|
| Quadrant D | 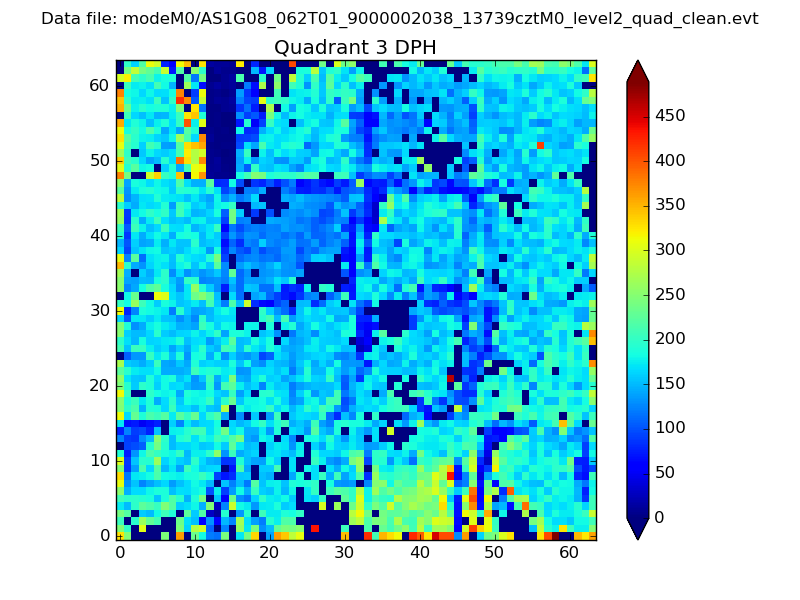 |
 |
Quadrant C |
| Plot type | Count rate plots | Images |
|---|---|---|
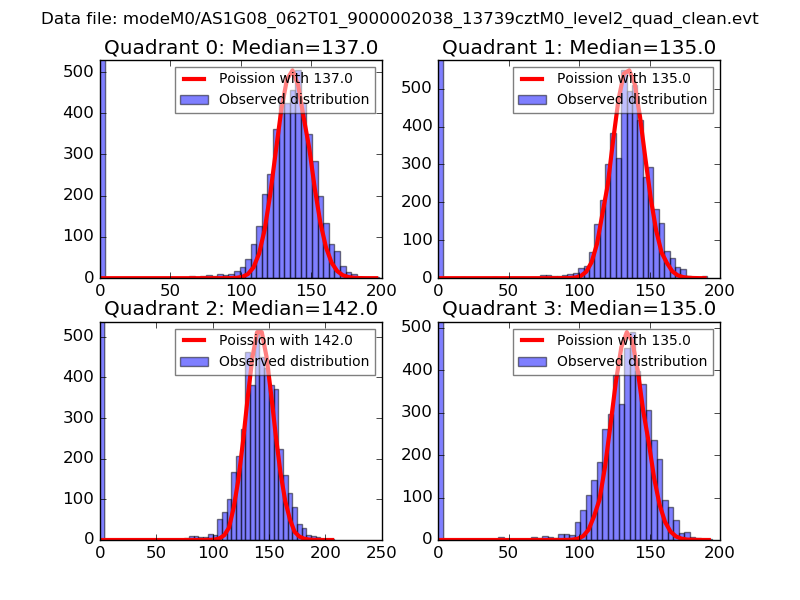
| Comparison with Poisson distribution Blue bars denote a histogram of data divided into 1 sec bins. Red curve is a Poisson curve with rate = median count rate of data. |
 |
 |
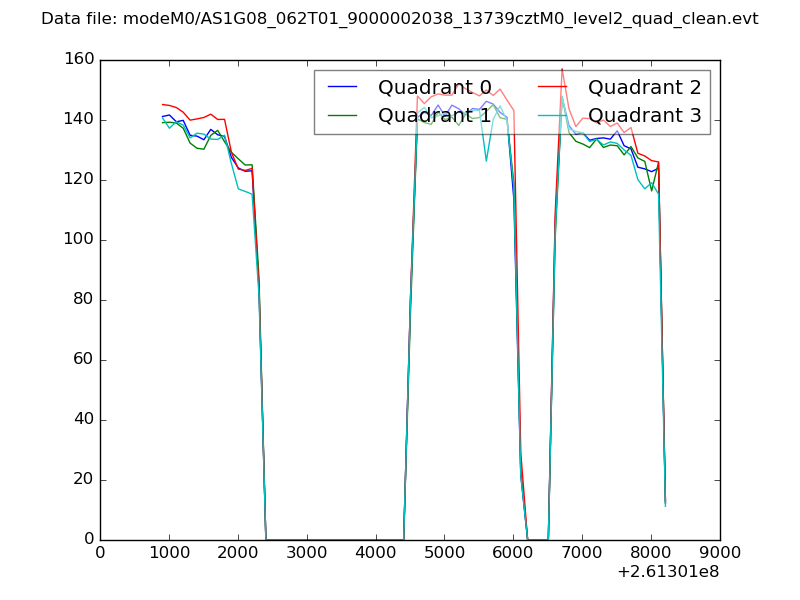
| Quadrant-wise count rates Data is divided into 100 sec bins |
 |
|
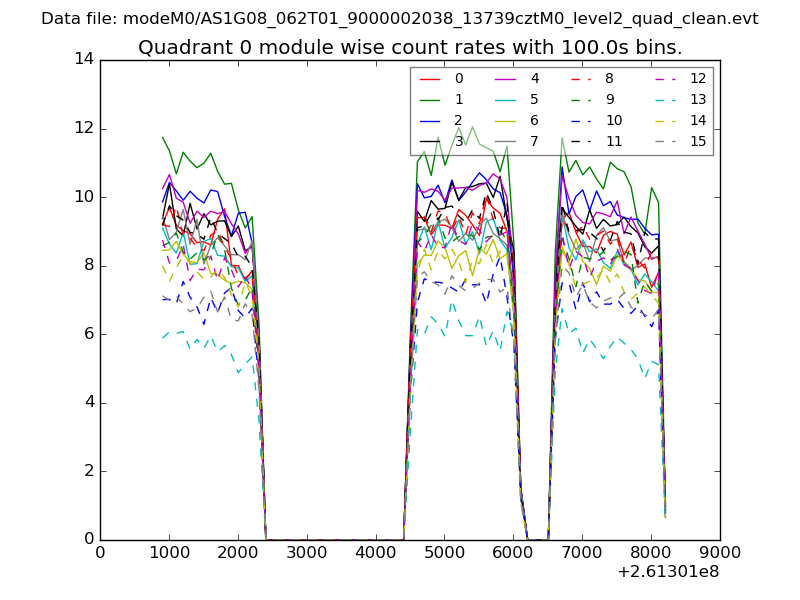
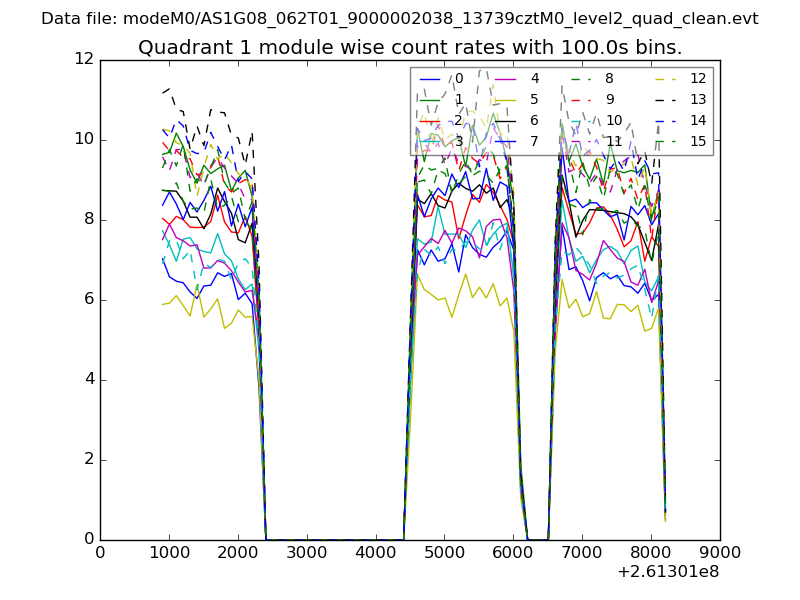
| Module-wise count rates for Quadrant A Data is divided into 100 sec bins |
 |
 |
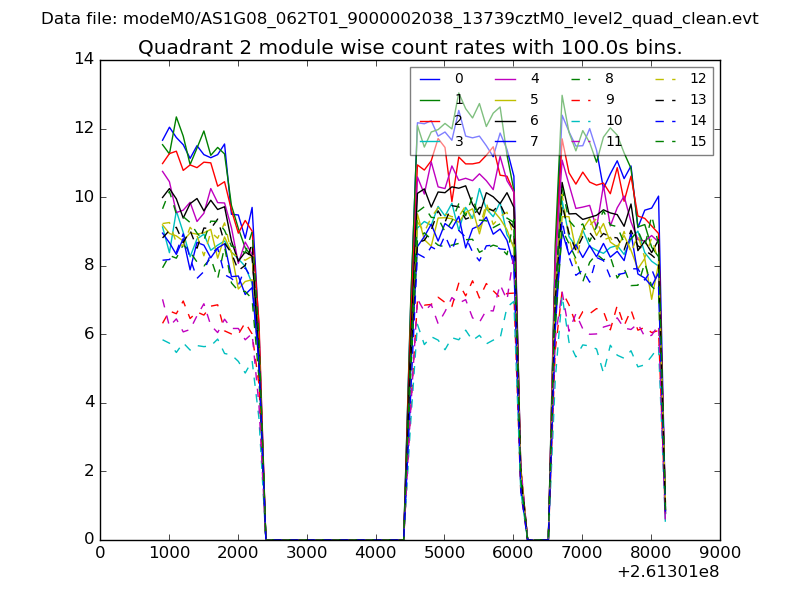
| Module-wise count rates for Quadrant B Data is divided into 100 sec bins |
 |
 |
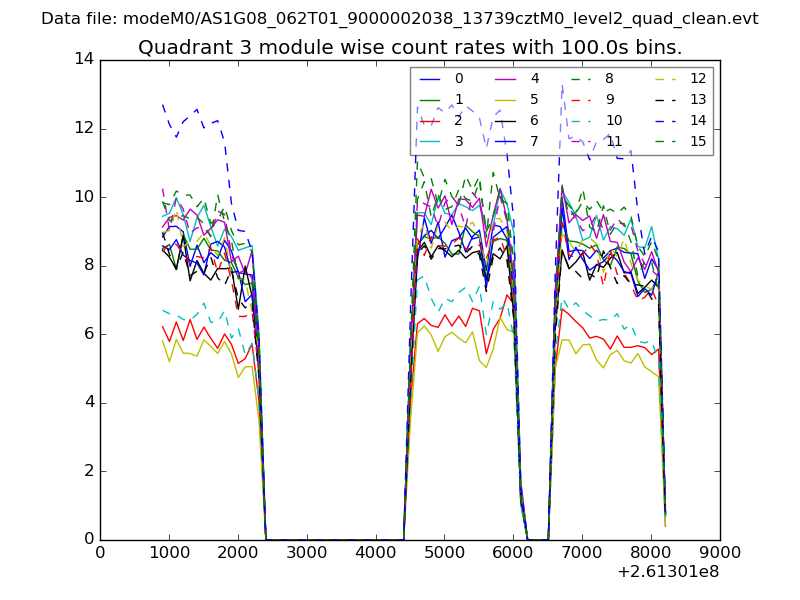
| Module-wise count rates for Quadrant C Data is divided into 100 sec bins |
 |
 |
| Module-wise count rates for Quadrant D Data is divided into 100 sec bins |
 |
 |
| Parameter | Plot |
|---|---|
| CZT HV Monitor | 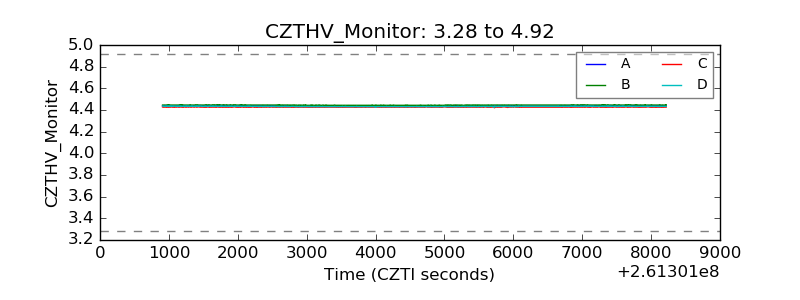 |
| D_VDD | 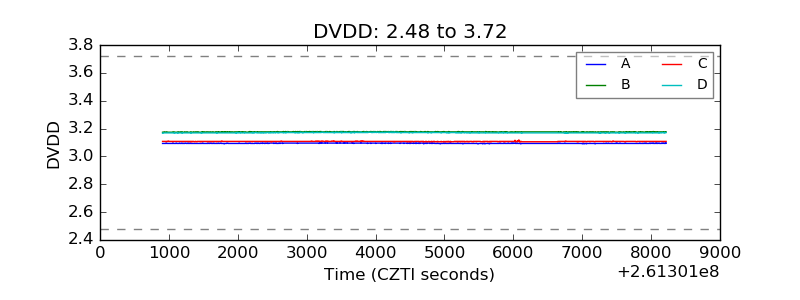 |
| Temperature 1 | 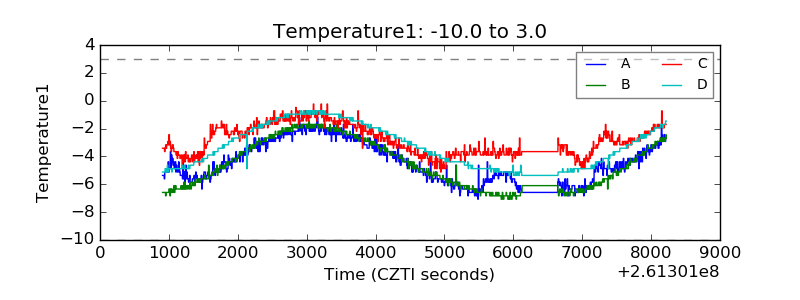 |
| Veto HV Monitor | 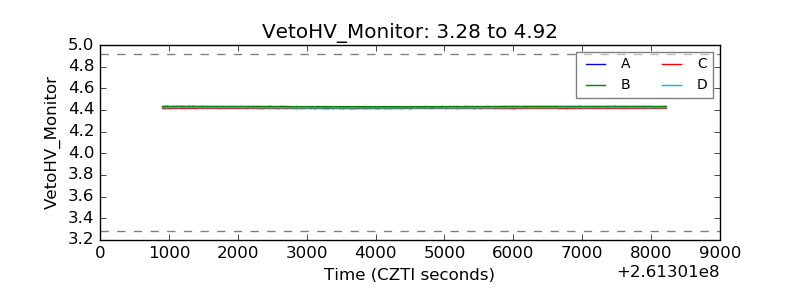 |
| Veto LLD | 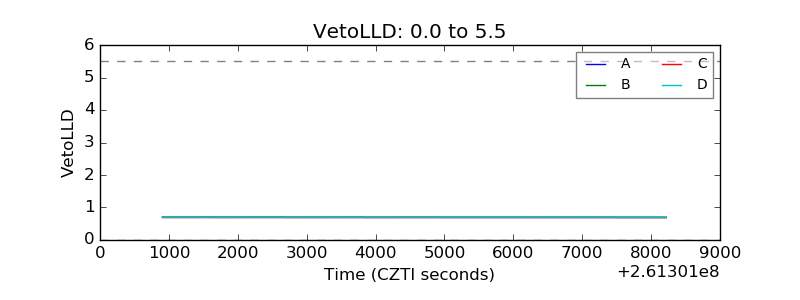 |
| Alpha Counter | 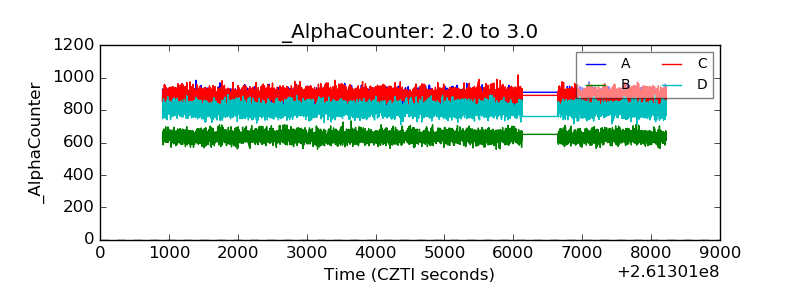 |
| _CPM_Rate | 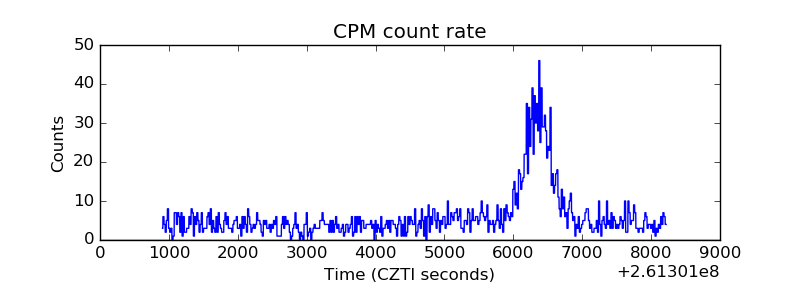 |
| CZT Counter | 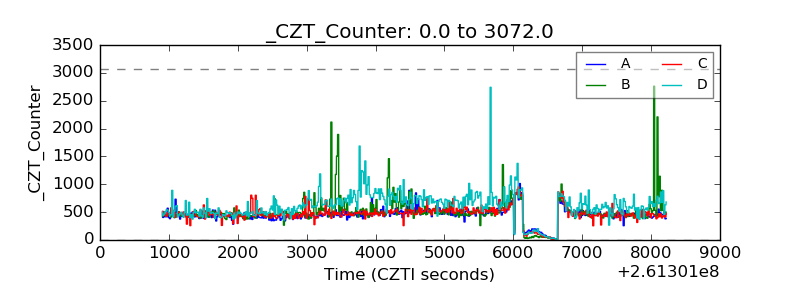 |
| +2.5 Volts monitor | 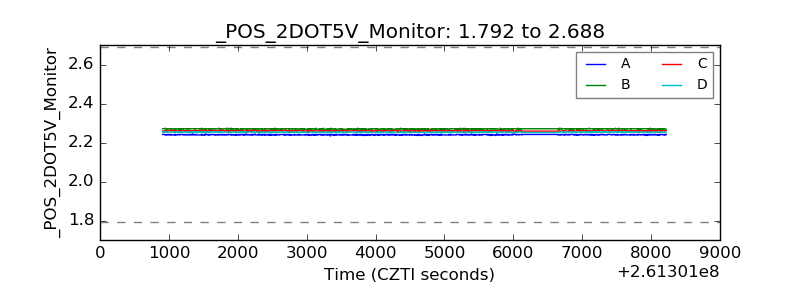 |
| +5 Volts monitor |  |
| _ROLL_ROT | 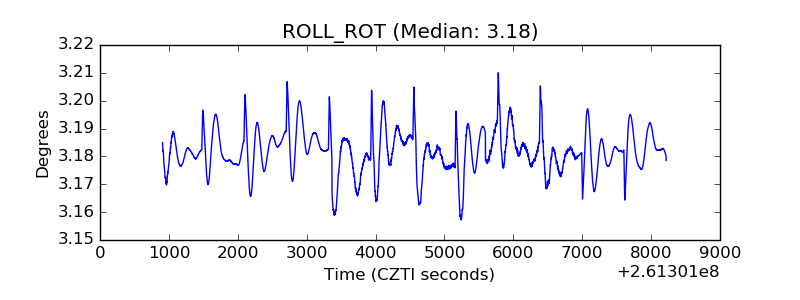 |
| _Roll_DEC | 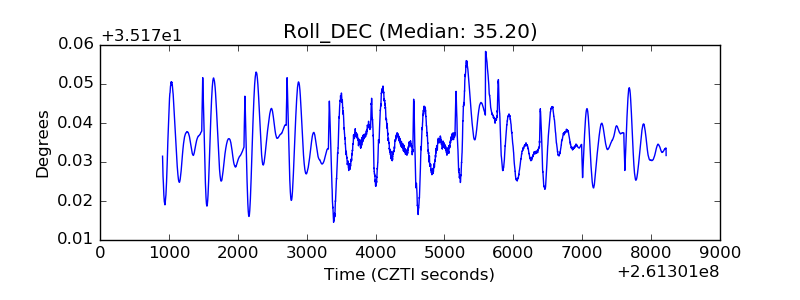 |
| _Roll_RA | 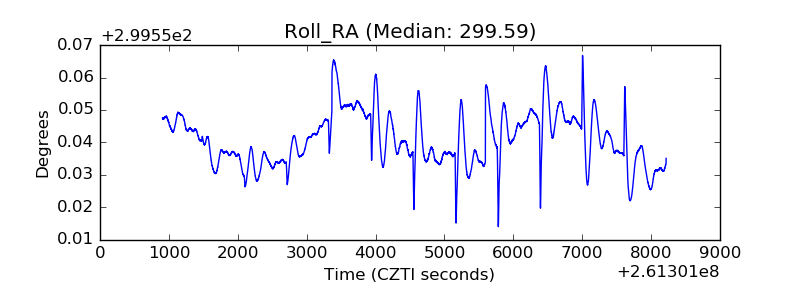 |
| Veto Counter | 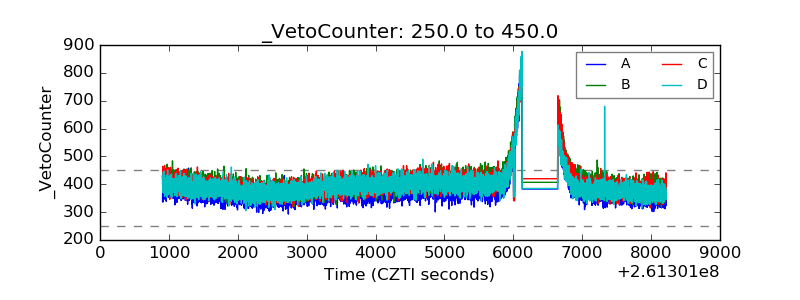 |