| Param | Original file | Final file |
|---|---|---|
| Filename | modeM0/AS1G08_062T01_9000002038_13740cztM0_level2.evt | modeM0/AS1G08_062T01_9000002038_13740cztM0_level2_quad_clean.evt |
| Size (bytes) | 502,911,360 | 93,709,440 |
| Size | 479.6 MB | 89.4 MB |
| Events in quadrant A | 3,187,680 | 590,666 |
| Events in quadrant B | 3,522,398 | 584,456 |
| Events in quadrant C | 3,252,410 | 616,245 |
| Events in quadrant D | 4,816,319 | 582,133 |
| Mode M9 | |||
|---|---|---|---|
| Quadrant | BADHDUFLAG | Total packets | Discarded packets |
| A | 0 | 2 | 0 |
| B | 0 | 2 | 0 |
| C | 0 | 2 | 0 |
| D | 0 | 2 | 0 |
| Mode M0 | |||
|---|---|---|---|
| Quadrant | BADHDUFLAG | Total packets | Discarded packets |
| A | 0 | 13810 | 2 |
| B | 0 | 14605 | 1 |
| C | 0 | 13824 | 1 |
| D | 0 | 18814 | 1 |
| Mode SS | |||
|---|---|---|---|
| Quadrant | BADHDUFLAG | Total packets | Discarded packets |
| A | 0 | 134 | 0 |
| B | 0 | 134 | 0 |
| C | 0 | 134 | 0 |
| D | 0 | 134 | 0 |
| Quadrant | Total seconds | Saturated seconds | Saturation percentage |
|---|---|---|---|
| A | 6666 | 206 | 3.090309% |
| B | 6666 | 231 | 3.465347% |
| C | 6666 | 151 | 2.265227% |
| D | 6666 | 310 | 4.650465% |
Noise dominated data is calculated using 1-second bins in cleaned event files. If a bin has >2000 counts, and if more than 50% of those come from <1% of pixels, then it is considered to be noise-dominated and hence unusable.
| Quadrant | # 1 sec bins | Bins with >0 counts | Bins with >2000 counts | High rate bins dominated by noise | Noise dominated (total time) | Noise dominated (detector-on time) | Marked lightcurve |
|---|---|---|---|---|---|---|---|
| A | 6762 | 6669 | 1 | 1 | 0.01% | 0.01% | 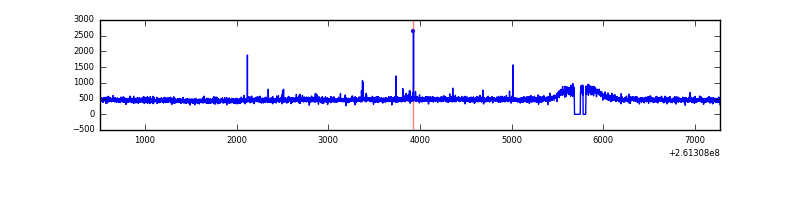 |
| B | 6762 | 6669 | 19 | 19 | 0.28% | 0.28% | 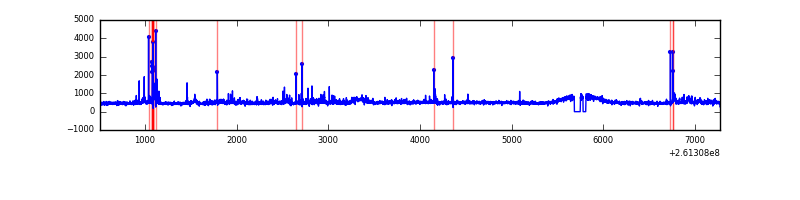 |
| C | 6762 | 6669 | 1 | 1 | 0.01% | 0.01% | 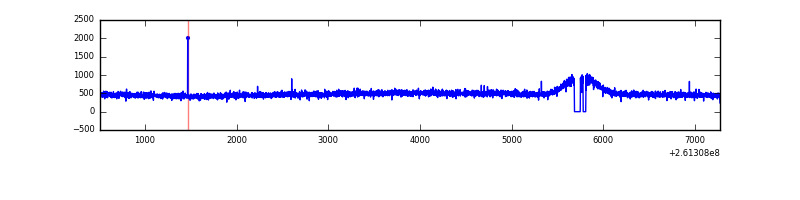 |
| D | 6762 | 6669 | 94 | 94 | 1.39% | 1.41% | 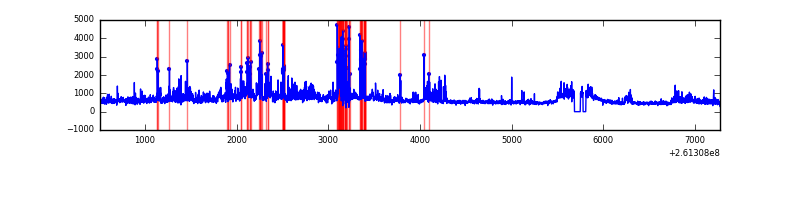 |
Top three noisy pixels from each quadrant. If the there are fewer than three noisy pixels in the level2.evt file, extra rows are filled as -1
| Pixel properties | Quadrant properties | ||||||
|---|---|---|---|---|---|---|---|
| Quadrant | DetID | PixID | Counts | Sigma | Mean | Median | Sigma |
| A | 15 | 69 | 13735 | 75.91 | 822 | 803 | 170.4 |
| A | 1 | 162 | 9793 | 52.77 | 822 | 803 | 170.4 |
| A | 0 | 226 | 7405 | 38.75 | 822 | 803 | 170.4 |
| B | 3 | 64 | 89631 | 564.12 | 816 | 795 | 157.5 |
| B | 0 | 219 | 66561 | 417.62 | 816 | 795 | 157.5 |
| B | 4 | 173 | 57870 | 362.43 | 816 | 795 | 157.5 |
| C | 3 | 233 | 100155 | 523.16 | 807 | 810 | 189.9 |
| C | 13 | 61 | 5745 | 25.99 | 807 | 810 | 189.9 |
| C | 14 | 234 | 3683 | 15.13 | 807 | 810 | 189.9 |
| D | 10 | 157 | 589260 | 3010.03 | 797 | 773 | 195.5 |
| D | 13 | 168 | 566268 | 2892.43 | 797 | 773 | 195.5 |
| D | 5 | 222 | 293067 | 1495.04 | 797 | 773 | 195.5 |
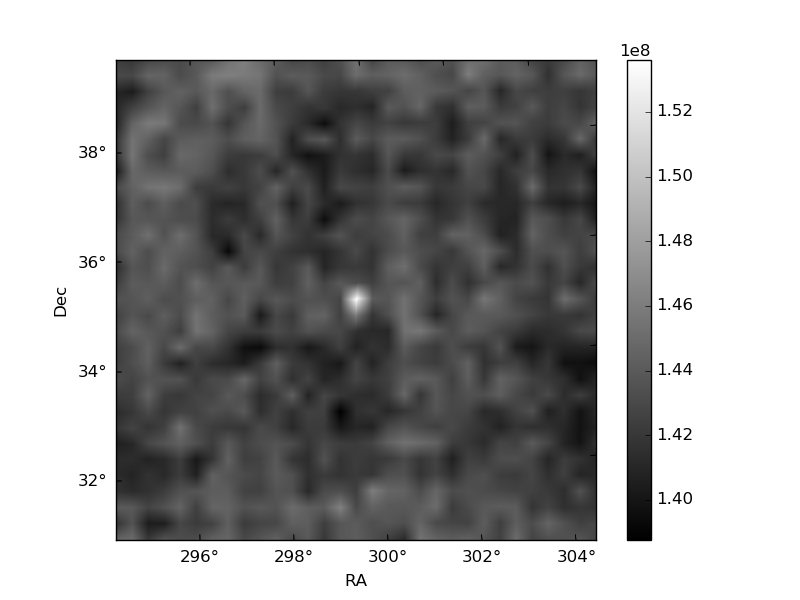
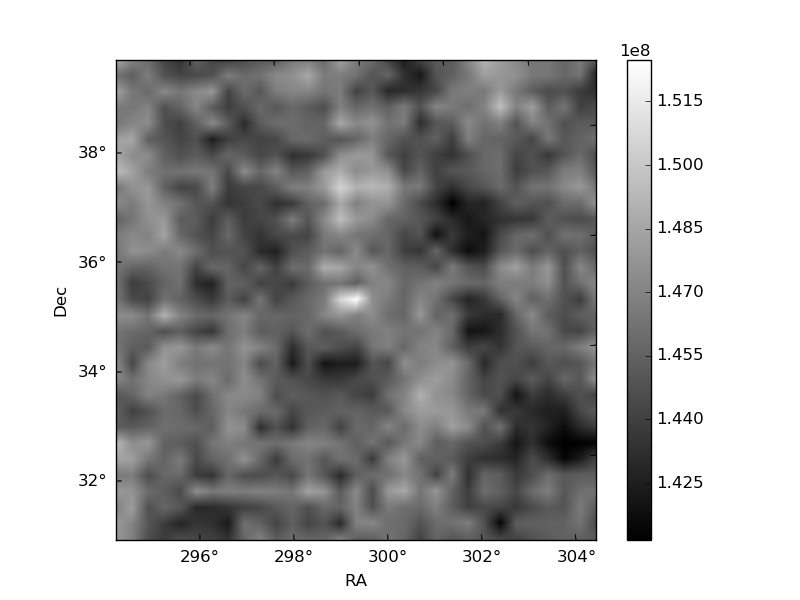
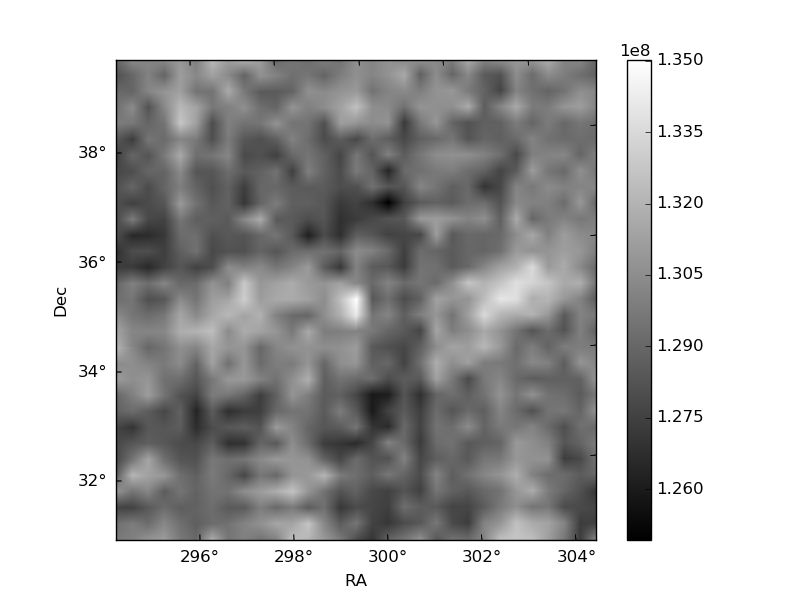
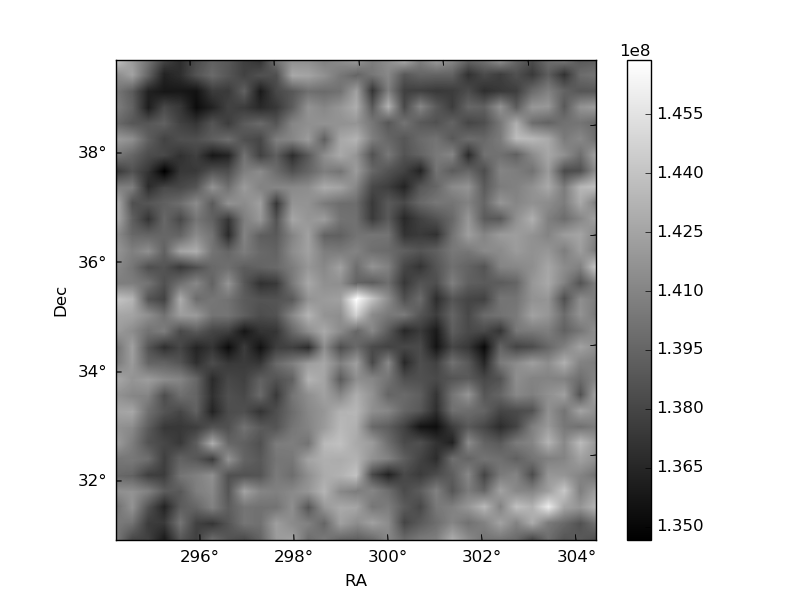
Histogram calculated using DETX and DETY for each event in the final _common_clean file
| Quadrant A | 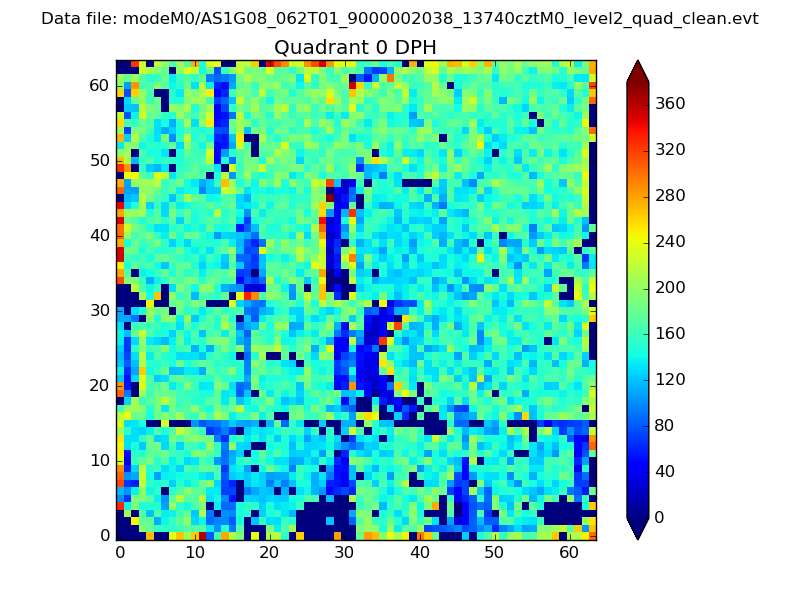 |
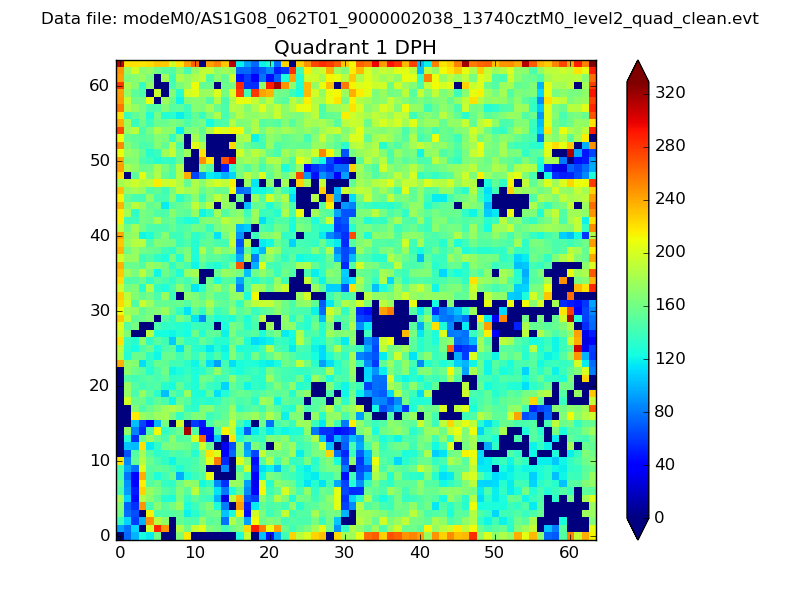 |
Quadrant B |
|---|---|---|---|
| Quadrant D | 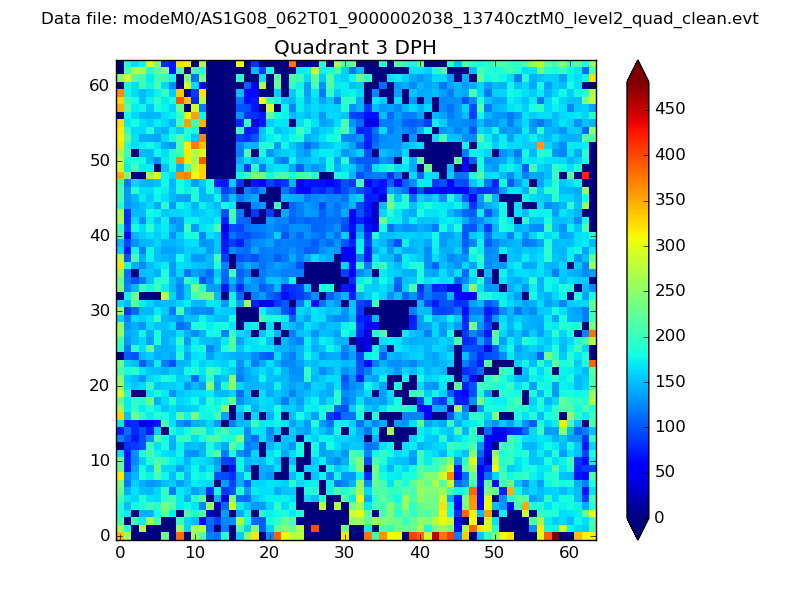 |
 |
Quadrant C |
| Plot type | Count rate plots | Images |
|---|---|---|
| Comparison with Poisson distribution Blue bars denote a histogram of data divided into 1 sec bins. Red curve is a Poisson curve with rate = median count rate of data. |
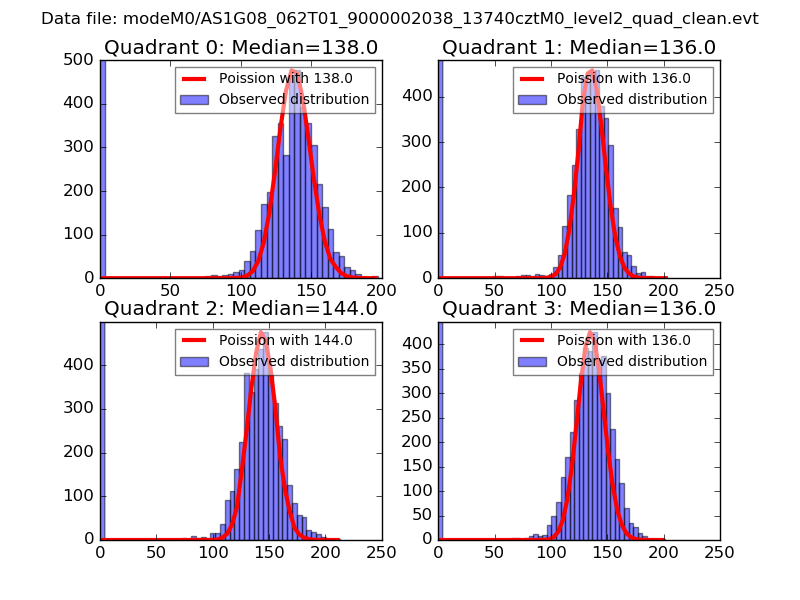 |
 |
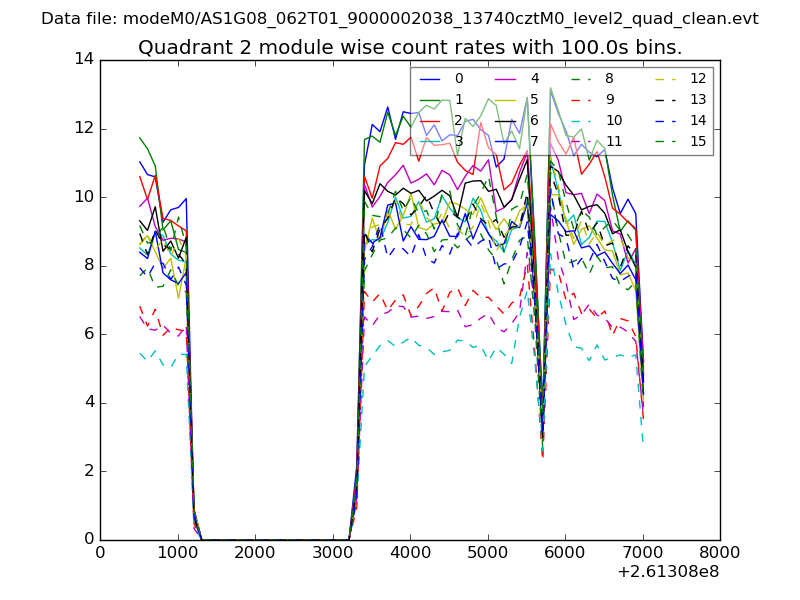
| Quadrant-wise count rates Data is divided into 100 sec bins |
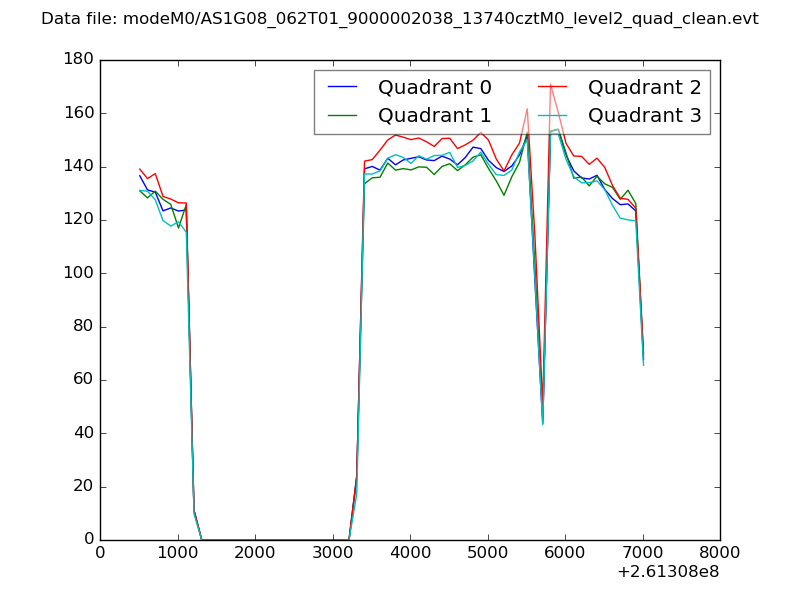 |
|
| Module-wise count rates for Quadrant A Data is divided into 100 sec bins |
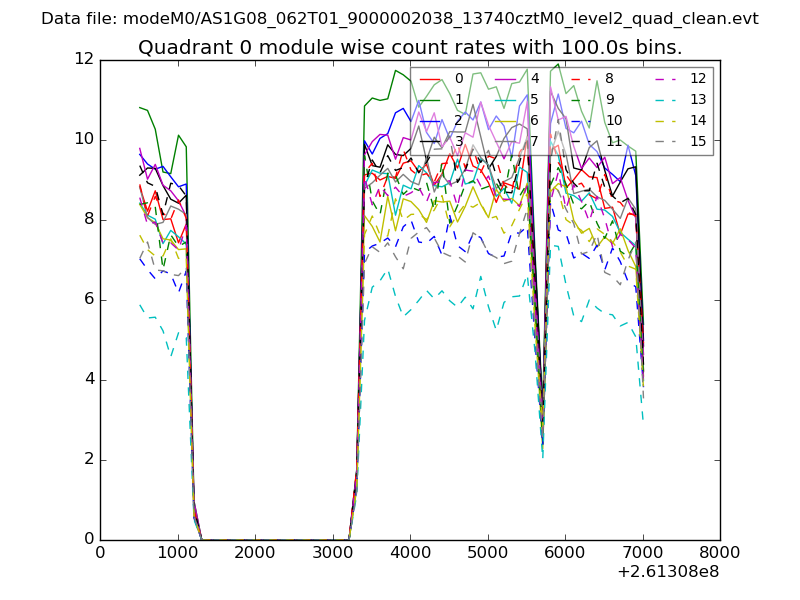 |
 |
| Module-wise count rates for Quadrant B Data is divided into 100 sec bins |
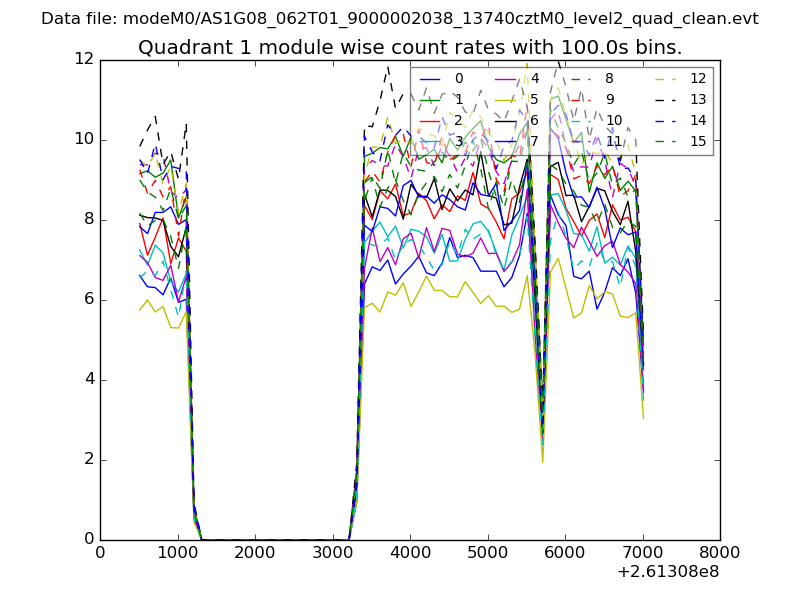 |
 |
| Module-wise count rates for Quadrant C Data is divided into 100 sec bins |
 |
 |
| Module-wise count rates for Quadrant D Data is divided into 100 sec bins |
 |
 |
| Parameter | Plot |
|---|---|
| CZT HV Monitor | 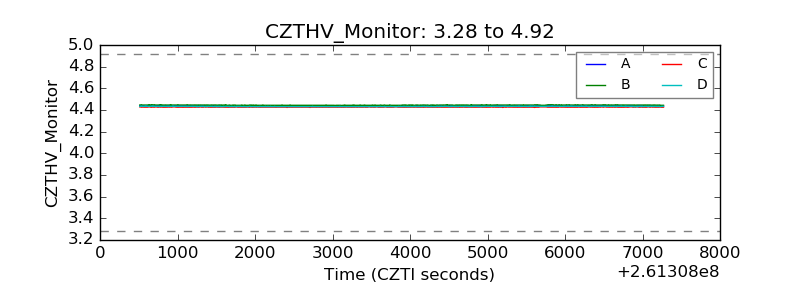 |
| D_VDD | 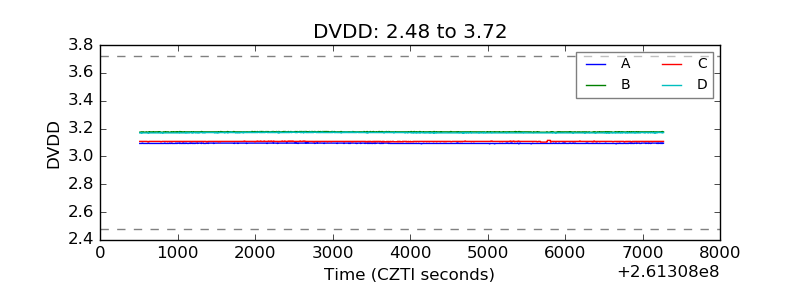 |
| Temperature 1 |  |
| Veto HV Monitor | 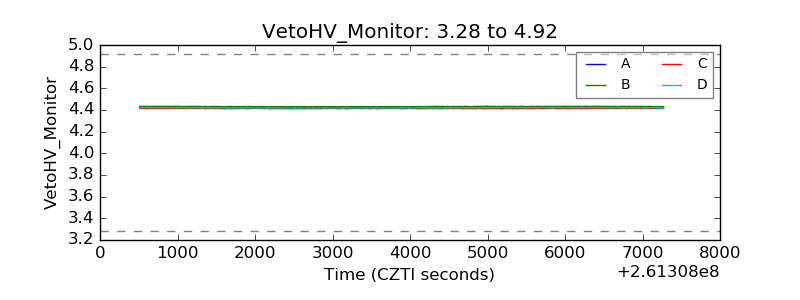 |
| Veto LLD | 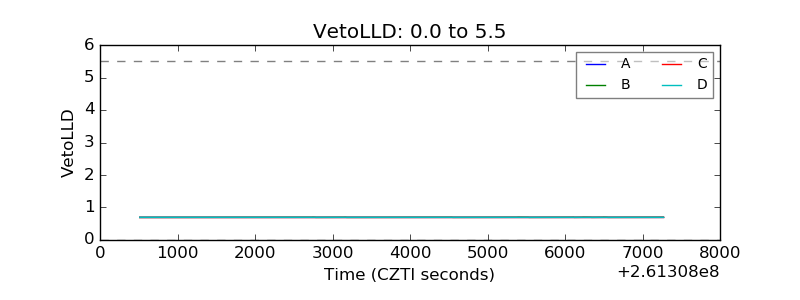 |
| Alpha Counter | 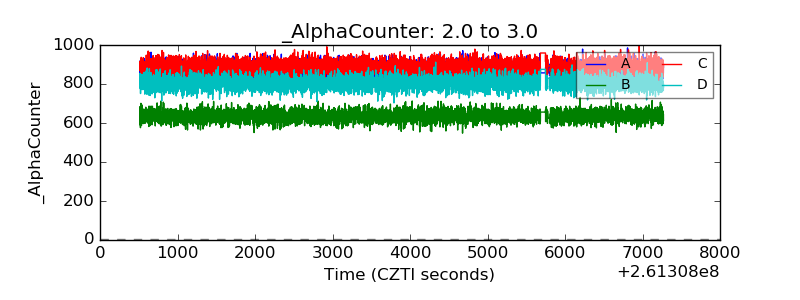 |
| _CPM_Rate | 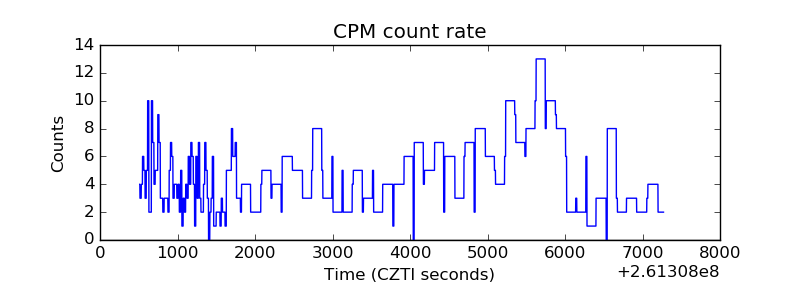 |
| CZT Counter |  |
| +2.5 Volts monitor |  |
| +5 Volts monitor |  |
| _ROLL_ROT |  |
| _Roll_DEC |  |
| _Roll_RA |  |
| Veto Counter |  |