| Param | Original file | Final file |
|---|---|---|
| Filename | modeM0/AS1G08_062T01_9000002038_13741cztM0_level2.evt | modeM0/AS1G08_062T01_9000002038_13741cztM0_level2_quad_clean.evt |
| Size (bytes) | 544,991,040 | 101,885,760 |
| Size | 519.7 MB | 97.2 MB |
| Events in quadrant A | 3,780,162 | 633,243 |
| Events in quadrant B | 4,075,680 | 628,538 |
| Events in quadrant C | 3,745,714 | 659,109 |
| Events in quadrant D | 4,381,861 | 630,082 |
| Mode M0 | |||
|---|---|---|---|
| Quadrant | BADHDUFLAG | Total packets | Discarded packets |
| A | 0 | 16072 | 1 |
| B | 0 | 16798 | 0 |
| C | 0 | 15991 | 0 |
| D | 0 | 17896 | 0 |
| Mode SS | |||
|---|---|---|---|
| Quadrant | BADHDUFLAG | Total packets | Discarded packets |
| A | 0 | 154 | 0 |
| B | 0 | 154 | 0 |
| C | 0 | 154 | 0 |
| D | 0 | 154 | 0 |
| Quadrant | Total seconds | Saturated seconds | Saturation percentage |
|---|---|---|---|
| A | 7680 | 316 | 4.114583% |
| B | 7680 | 351 | 4.570312% |
| C | 7680 | 280 | 3.645833% |
| D | 7680 | 293 | 3.815104% |
Noise dominated data is calculated using 1-second bins in cleaned event files. If a bin has >2000 counts, and if more than 50% of those come from <1% of pixels, then it is considered to be noise-dominated and hence unusable.
| Quadrant | # 1 sec bins | Bins with >0 counts | Bins with >2000 counts | High rate bins dominated by noise | Noise dominated (total time) | Noise dominated (detector-on time) | Marked lightcurve |
|---|---|---|---|---|---|---|---|
| A | 7681 | 7681 | 1 | 1 | 0.01% | 0.01% | 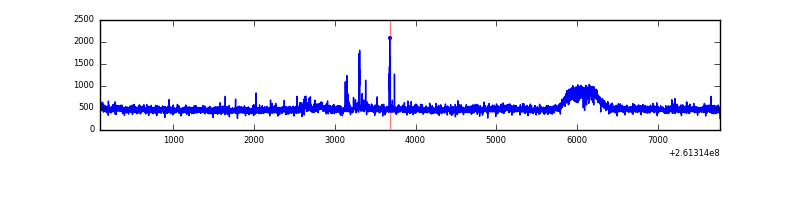 |
| B | 7681 | 7681 | 18 | 18 | 0.23% | 0.23% | 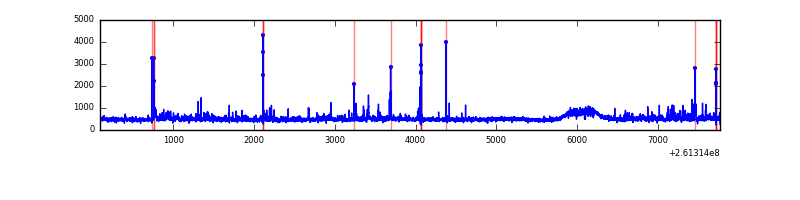 |
| C | 7681 | 7681 | 0 | 0 | 0.00% | 0.00% | 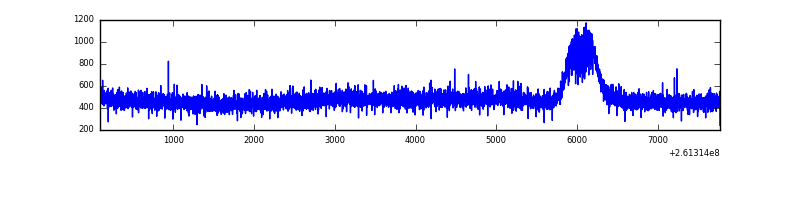 |
| D | 7681 | 7681 | 14 | 14 | 0.18% | 0.18% | 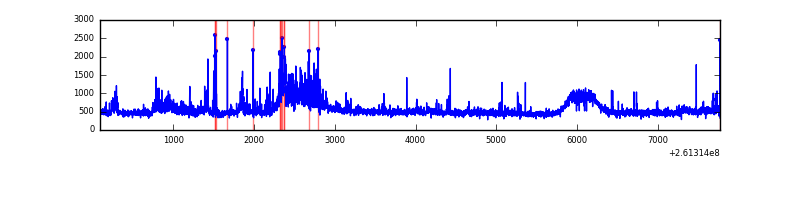 |
Top three noisy pixels from each quadrant. If the there are fewer than three noisy pixels in the level2.evt file, extra rows are filled as -1
| Pixel properties | Quadrant properties | ||||||
|---|---|---|---|---|---|---|---|
| Quadrant | DetID | PixID | Counts | Sigma | Mean | Median | Sigma |
| A | 15 | 69 | 29436 | 144.34 | 960 | 940 | 197.4 |
| A | 15 | 157 | 24759 | 120.65 | 960 | 940 | 197.4 |
| A | 1 | 162 | 21834 | 105.83 | 960 | 940 | 197.4 |
| B | 3 | 64 | 76429 | 410.38 | 948 | 923 | 184.0 |
| B | 4 | 173 | 69821 | 374.46 | 948 | 923 | 184.0 |
| B | 10 | 252 | 50854 | 271.38 | 948 | 923 | 184.0 |
| C | 3 | 233 | 92957 | 422.66 | 935 | 940 | 217.7 |
| C | 13 | 61 | 6826 | 27.04 | 935 | 940 | 217.7 |
| C | 0 | 207 | 3850 | 13.37 | 935 | 940 | 217.7 |
| D | 5 | 222 | 477505 | 2087.61 | 937 | 909 | 228.3 |
| D | 10 | 157 | 119050 | 517.49 | 937 | 909 | 228.3 |
| D | 8 | 195 | 99109 | 430.14 | 937 | 909 | 228.3 |
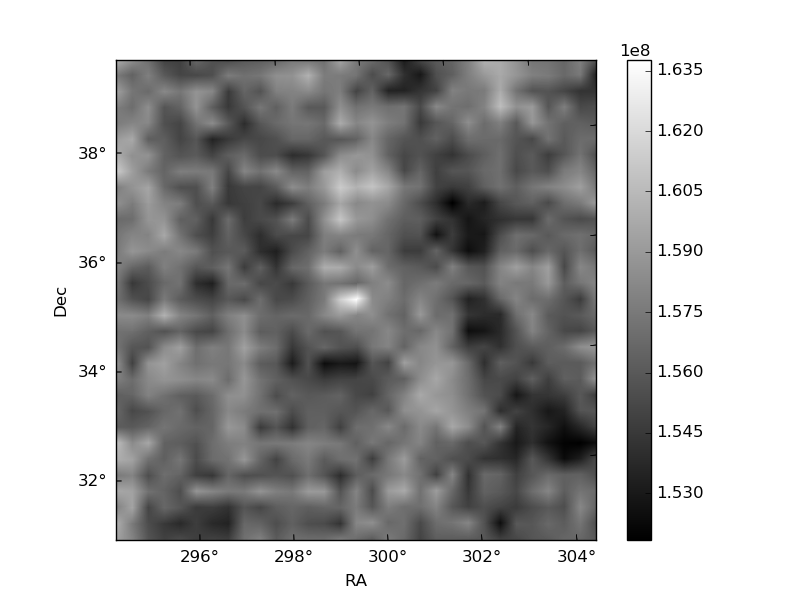
Histogram calculated using DETX and DETY for each event in the final _common_clean file
| Quadrant A | 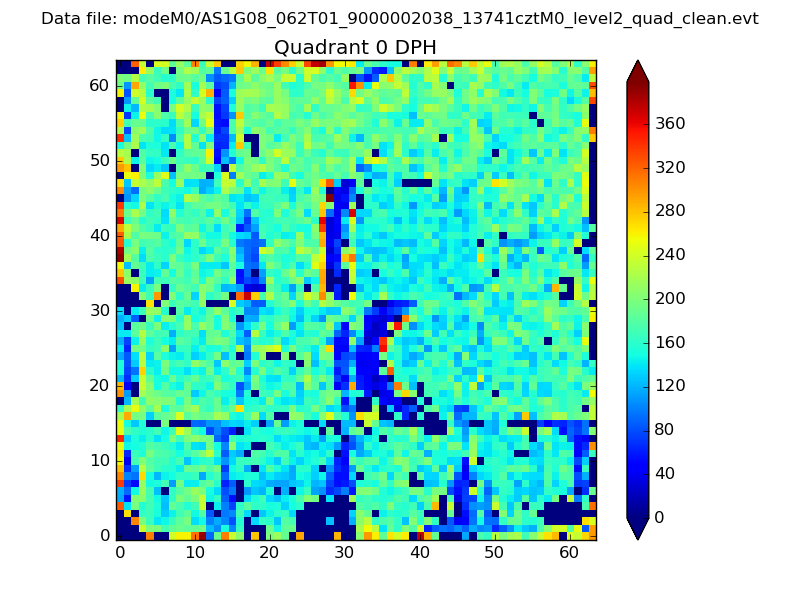 |
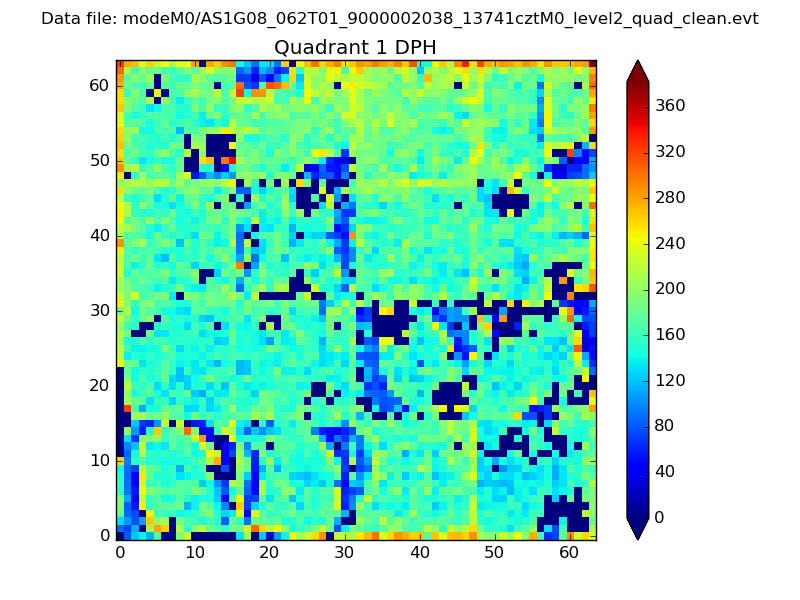 |
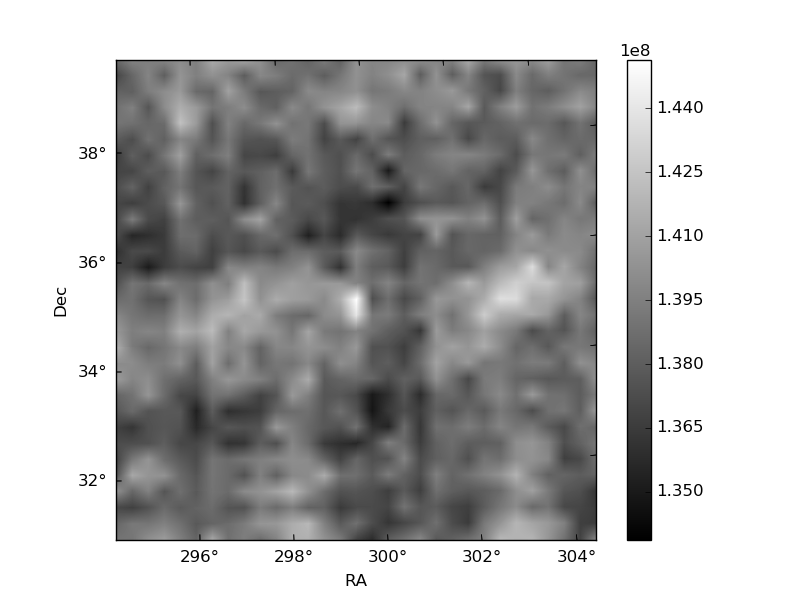
Quadrant B |
|---|---|---|---|
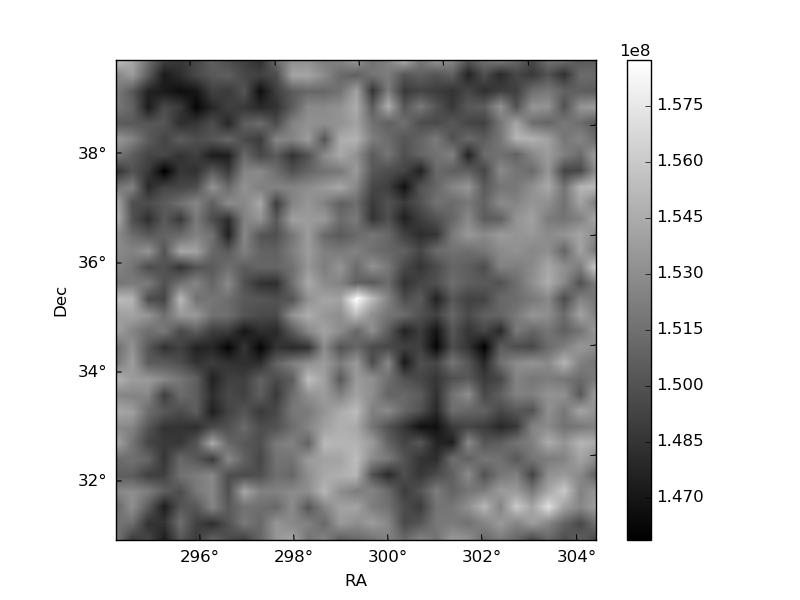
| Quadrant D | 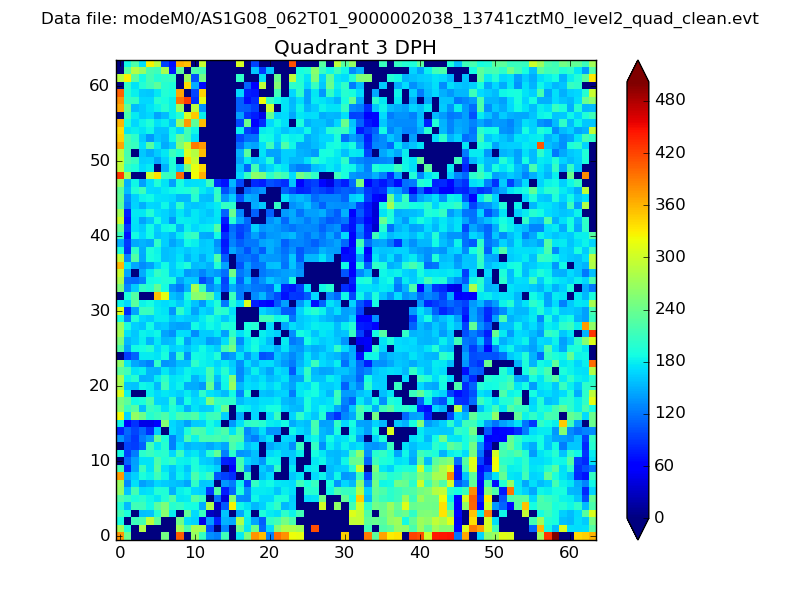 |
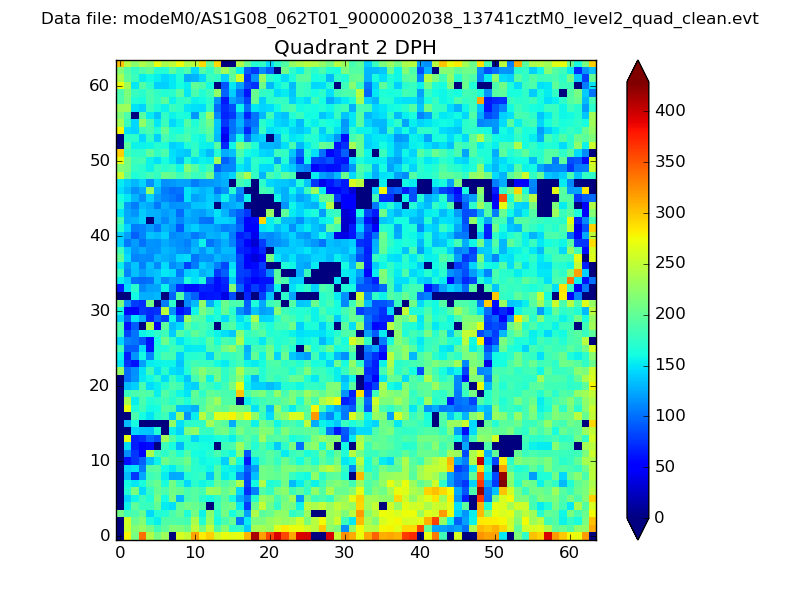 |
Quadrant C |
| Plot type | Count rate plots | Images |
|---|---|---|
| Comparison with Poisson distribution Blue bars denote a histogram of data divided into 1 sec bins. Red curve is a Poisson curve with rate = median count rate of data. |
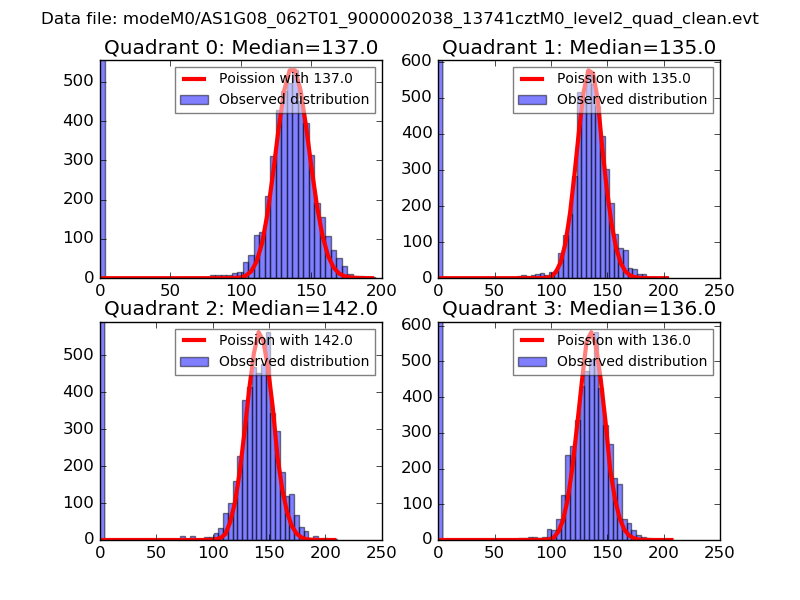 |
 |
| Quadrant-wise count rates Data is divided into 100 sec bins |
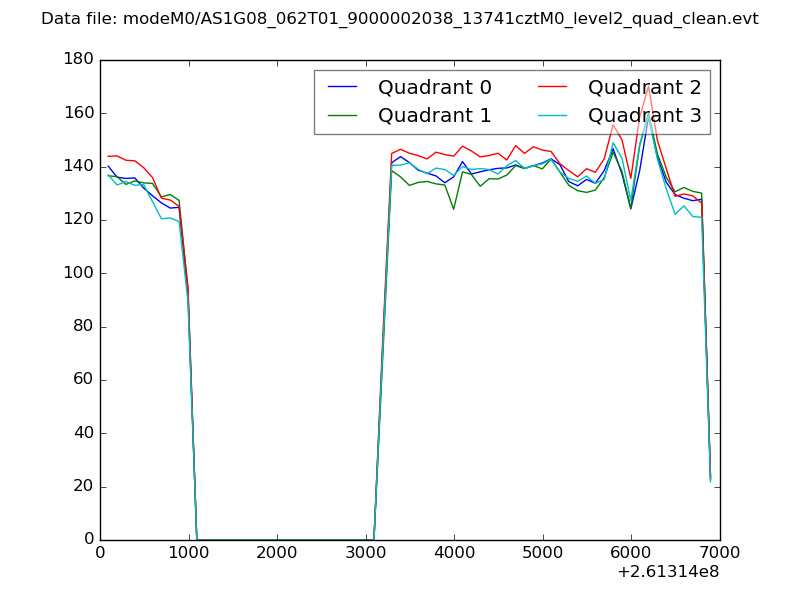 |
|
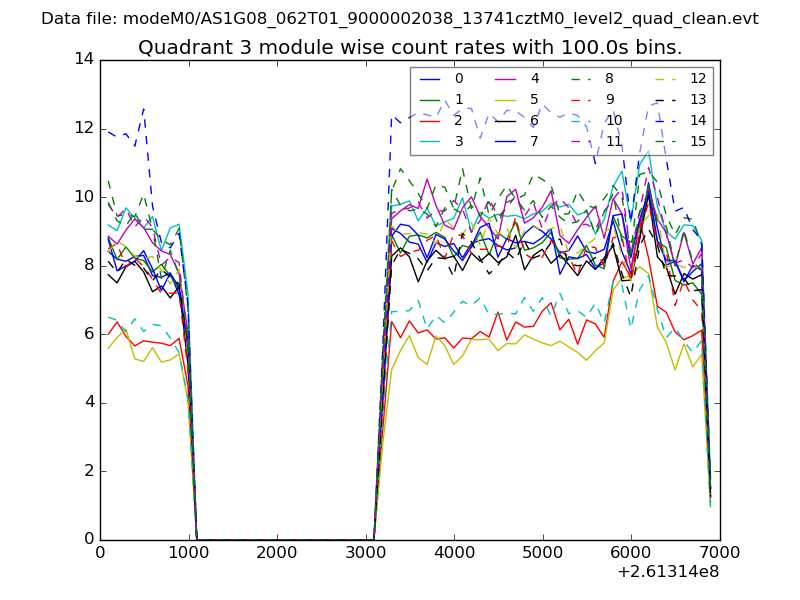
| Module-wise count rates for Quadrant A Data is divided into 100 sec bins |
 |
 |
| Module-wise count rates for Quadrant B Data is divided into 100 sec bins |
 |
 |
| Module-wise count rates for Quadrant C Data is divided into 100 sec bins |
 |
 |
| Module-wise count rates for Quadrant D Data is divided into 100 sec bins |
 |
 |
| Parameter | Plot |
|---|---|
| CZT HV Monitor |  |
| D_VDD | 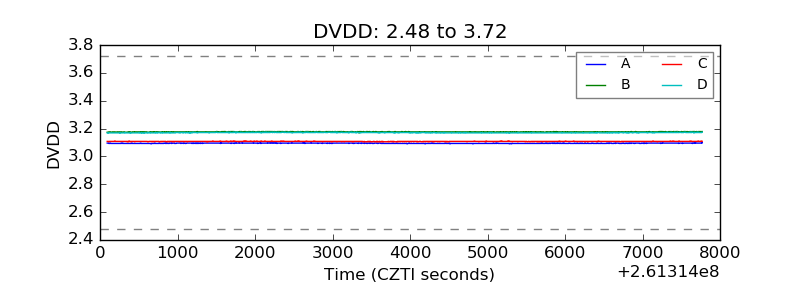 |
| Temperature 1 | 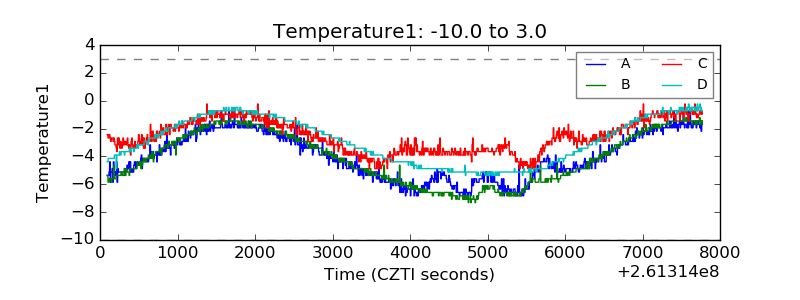 |
| Veto HV Monitor | 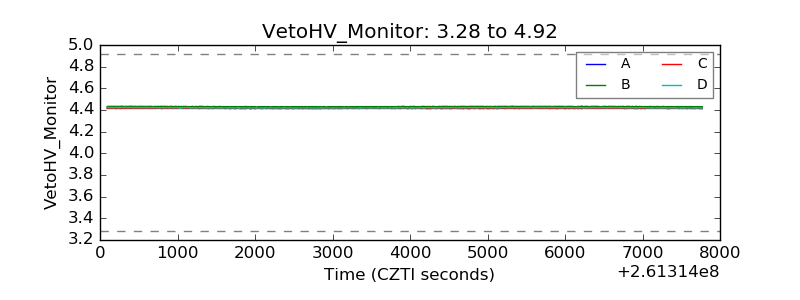 |
| Veto LLD | 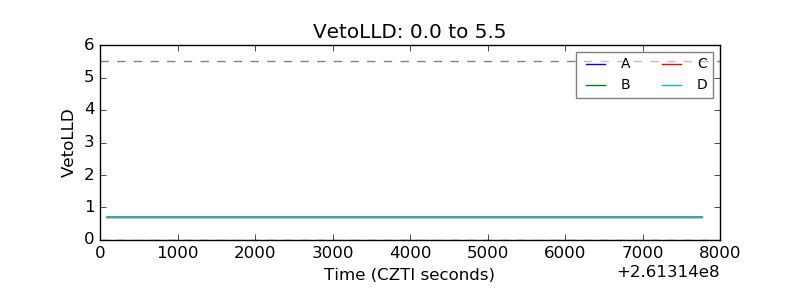 |
| Alpha Counter | 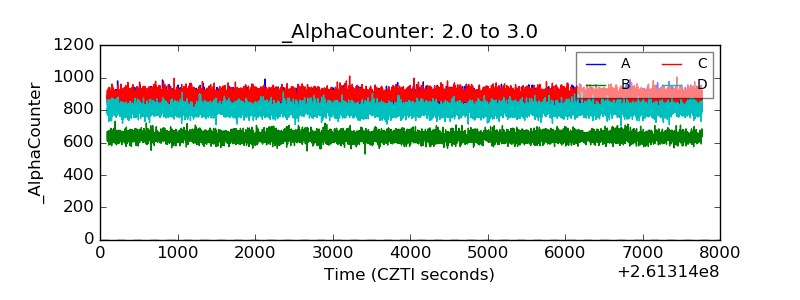 |
| _CPM_Rate | 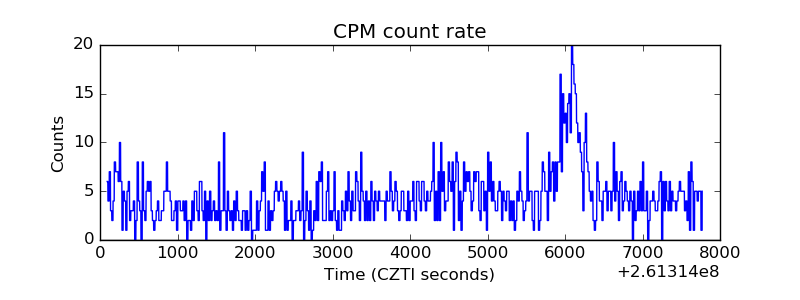 |
| CZT Counter | 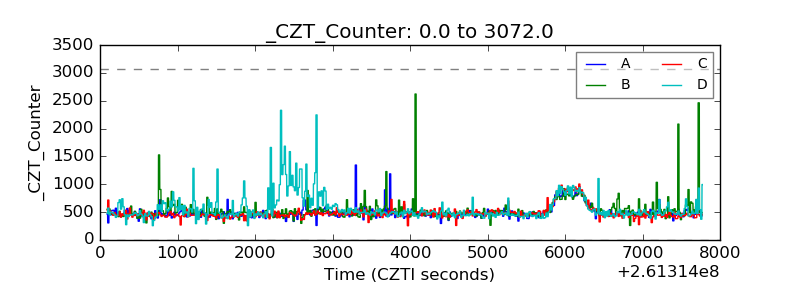 |
| +2.5 Volts monitor |  |
| +5 Volts monitor |  |
| _ROLL_ROT |  |
| _Roll_DEC | 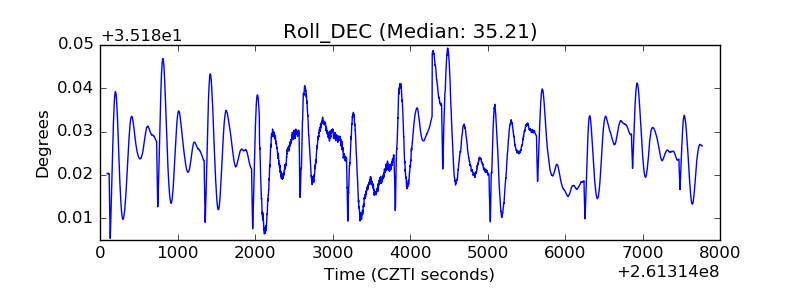 |
| _Roll_RA |  |
| Veto Counter | 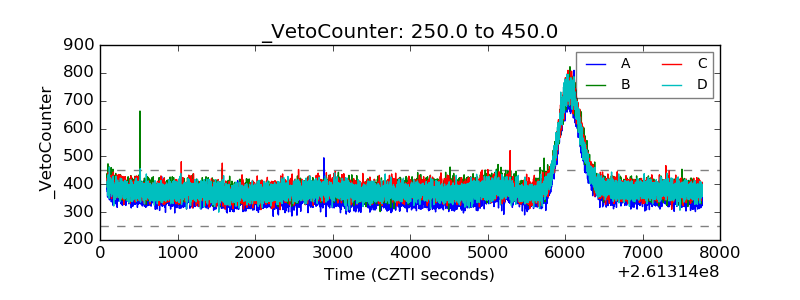 |