| Param | Original file | Final file |
|---|---|---|
| Filename | modeM0/AS1G08_062T01_9000002038_13744cztM0_level2.evt | modeM0/AS1G08_062T01_9000002038_13744cztM0_level2_quad_clean.evt |
| Size (bytes) | 1,369,301,760 | 231,336,000 |
| Size | 1.3 GB | 220.6 MB |
| Events in quadrant A | 9,208,002 | 1,437,667 |
| Events in quadrant B | 9,490,344 | 1,402,308 |
| Events in quadrant C | 9,760,461 | 1,471,458 |
| Events in quadrant D | 11,761,873 | 1,420,730 |
| Mode M9 | |||
|---|---|---|---|
| Quadrant | BADHDUFLAG | Total packets | Discarded packets |
| A | 0 | 17 | 0 |
| B | 0 | 17 | 0 |
| C | 0 | 17 | 0 |
| D | 0 | 17 | 0 |
| Mode M0 | |||
|---|---|---|---|
| Quadrant | BADHDUFLAG | Total packets | Discarded packets |
| A | 0 | 39176 | 4 |
| B | 0 | 39733 | 3 |
| C | 0 | 40466 | 3 |
| D | 0 | 47355 | 3 |
| Mode SS | |||
|---|---|---|---|
| Quadrant | BADHDUFLAG | Total packets | Discarded packets |
| A | 0 | 376 | 0 |
| B | 0 | 376 | 0 |
| C | 0 | 376 | 0 |
| D | 0 | 376 | 0 |
| Quadrant | Total seconds | Saturated seconds | Saturation percentage |
|---|---|---|---|
| A | 18489 | 294 | 1.590135% |
| B | 18489 | 278 | 1.503597% |
| C | 18489 | 397 | 2.147223% |
| D | 18489 | 393 | 2.125588% |
Noise dominated data is calculated using 1-second bins in cleaned event files. If a bin has >2000 counts, and if more than 50% of those come from <1% of pixels, then it is considered to be noise-dominated and hence unusable.
| Quadrant | # 1 sec bins | Bins with >0 counts | Bins with >2000 counts | High rate bins dominated by noise | Noise dominated (total time) | Noise dominated (detector-on time) | Marked lightcurve |
|---|---|---|---|---|---|---|---|
| A | 20200 | 18493 | 60 | 60 | 0.30% | 0.32% | 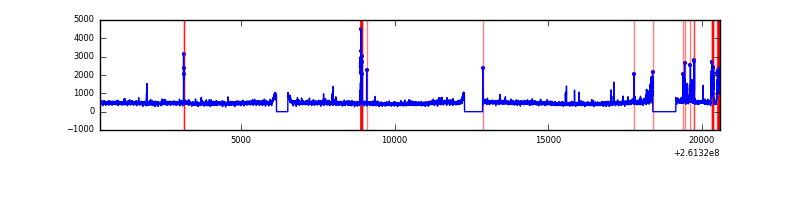 |
| B | 20200 | 18491 | 33 | 33 | 0.16% | 0.18% | 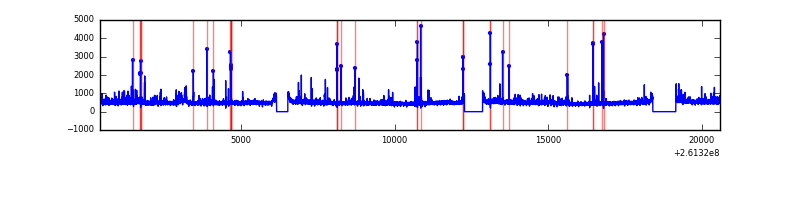 |
| C | 20200 | 18493 | 159 | 159 | 0.79% | 0.86% | 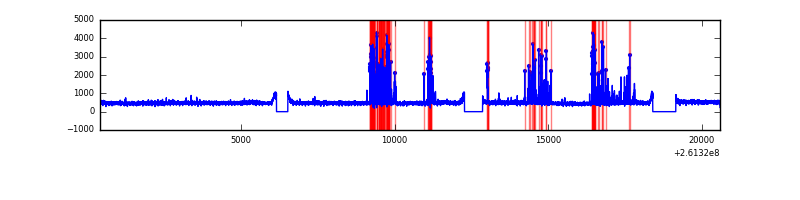 |
| D | 20200 | 18493 | 173 | 173 | 0.86% | 0.94% | 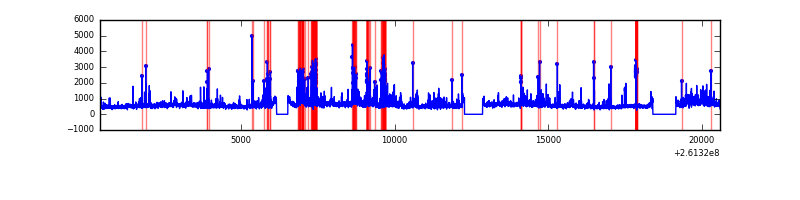 |
Top three noisy pixels from each quadrant. If the there are fewer than three noisy pixels in the level2.evt file, extra rows are filled as -1
| Pixel properties | Quadrant properties | ||||||
|---|---|---|---|---|---|---|---|
| Quadrant | DetID | PixID | Counts | Sigma | Mean | Median | Sigma |
| A | 9 | 143 | 340185 | 743.45 | 2248 | 2200 | 454.6 |
| A | 15 | 69 | 127821 | 276.32 | 2248 | 2200 | 454.6 |
| A | 1 | 162 | 50009 | 105.16 | 2248 | 2200 | 454.6 |
| B | 4 | 173 | 166537 | 387.62 | 2229 | 2176 | 424.0 |
| B | 3 | 64 | 139916 | 324.84 | 2229 | 2176 | 424.0 |
| B | 0 | 219 | 138991 | 322.66 | 2229 | 2176 | 424.0 |
| C | 4 | 254 | 957142 | 1870.07 | 2193 | 2205 | 510.6 |
| C | 3 | 233 | 209372 | 405.7 | 2193 | 2205 | 510.6 |
| C | 13 | 61 | 15960 | 26.94 | 2193 | 2205 | 510.6 |
| D | 13 | 168 | 1188715 | 2222.77 | 2194 | 2132 | 533.8 |
| D | 10 | 157 | 834212 | 1558.7 | 2194 | 2132 | 533.8 |
| D | 5 | 222 | 684382 | 1278.03 | 2194 | 2132 | 533.8 |
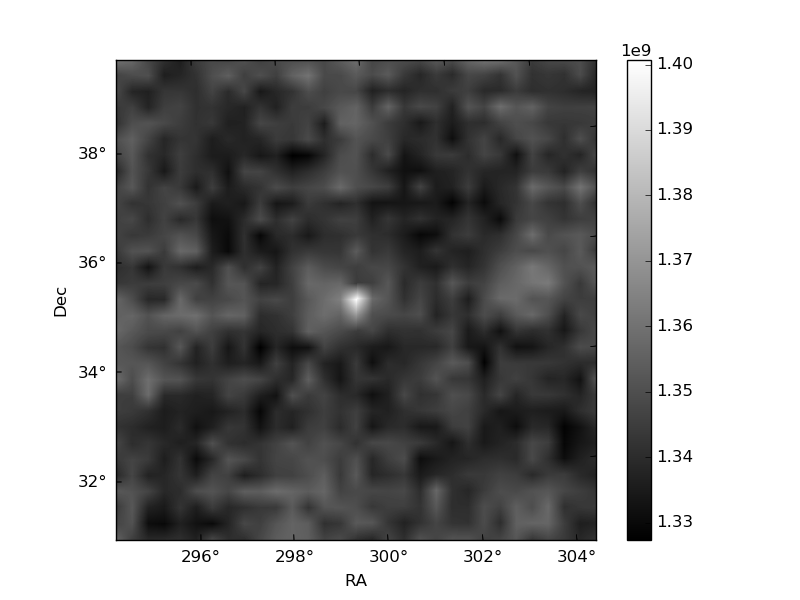
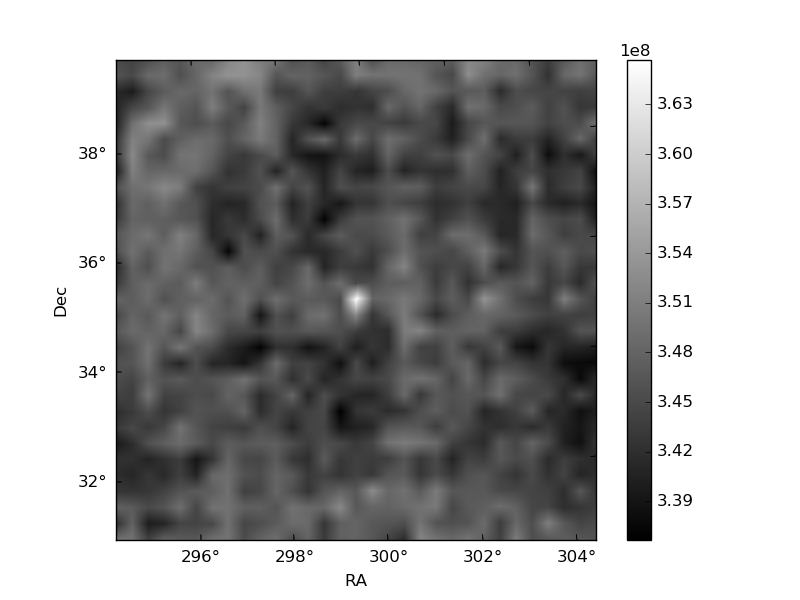
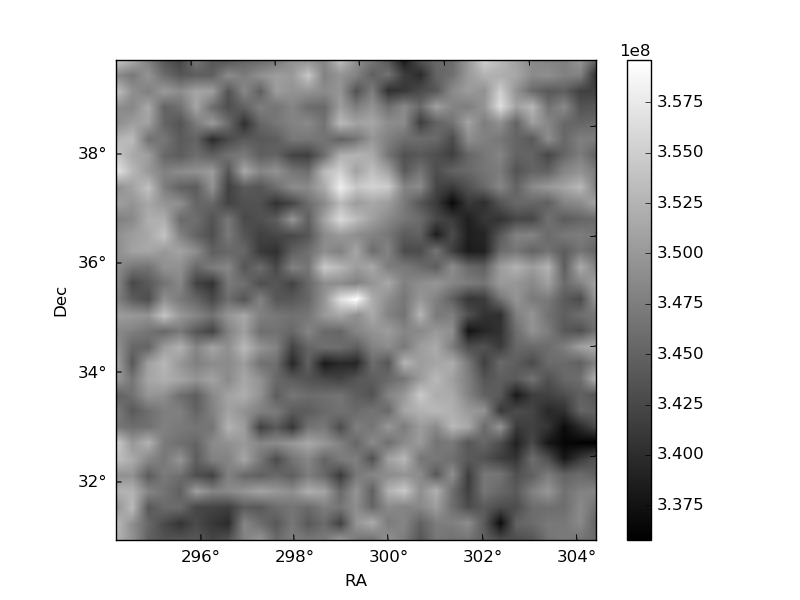
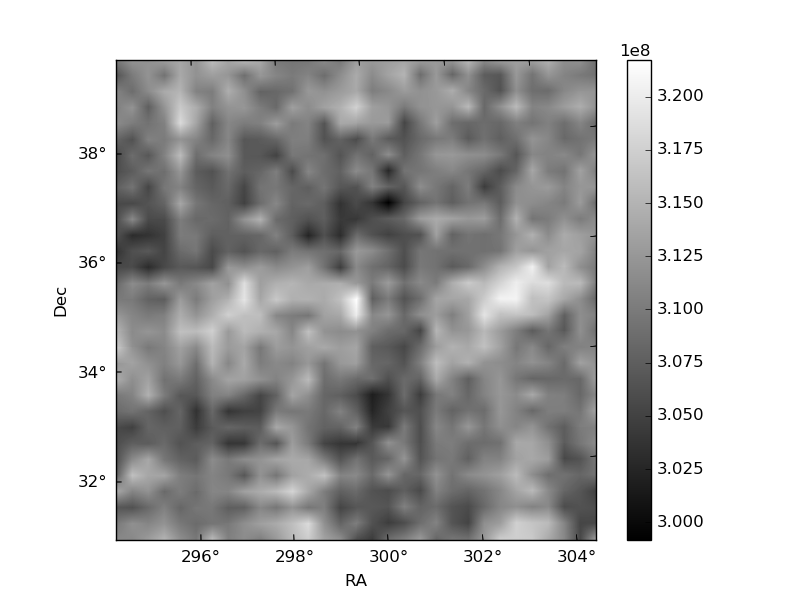
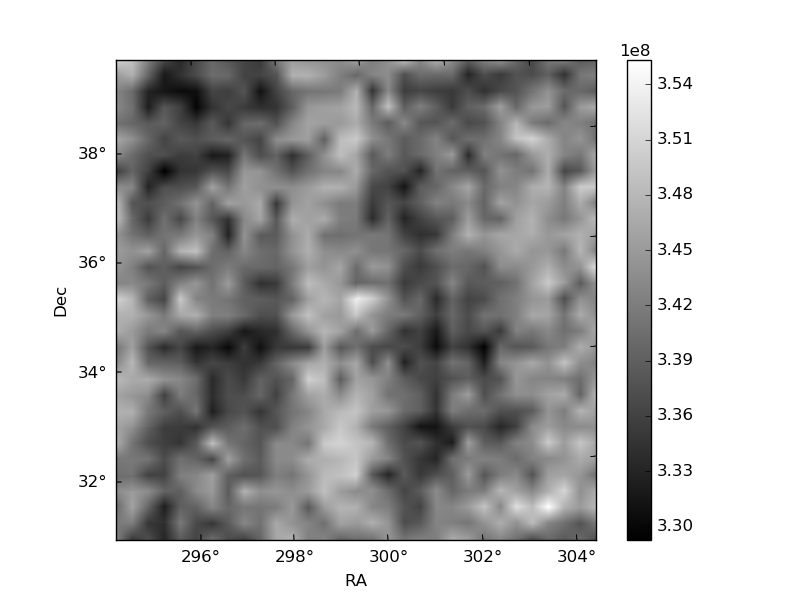
Histogram calculated using DETX and DETY for each event in the final _common_clean file
| Quadrant A | 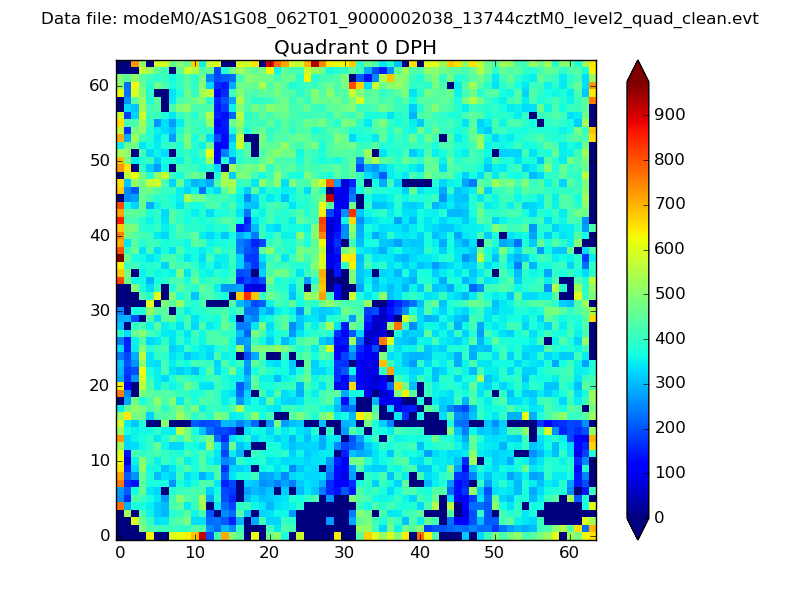 |
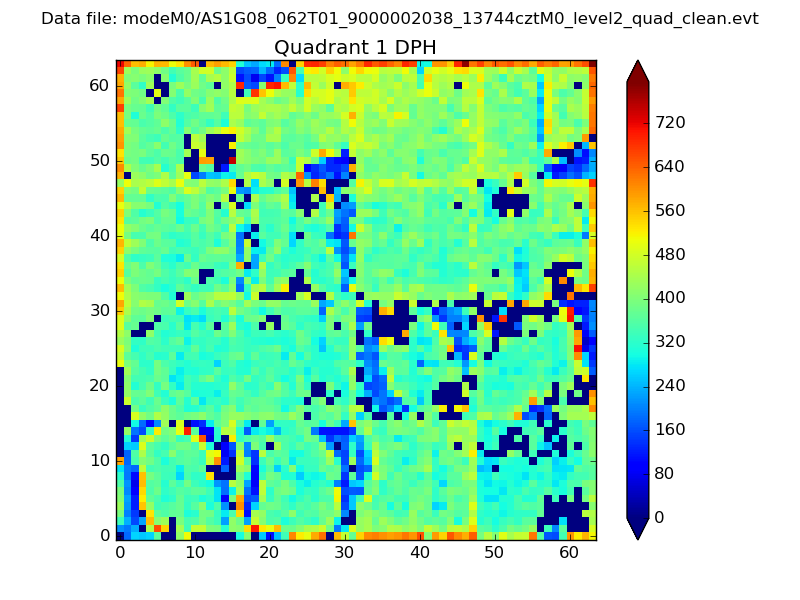 |
Quadrant B |
|---|---|---|---|
| Quadrant D | 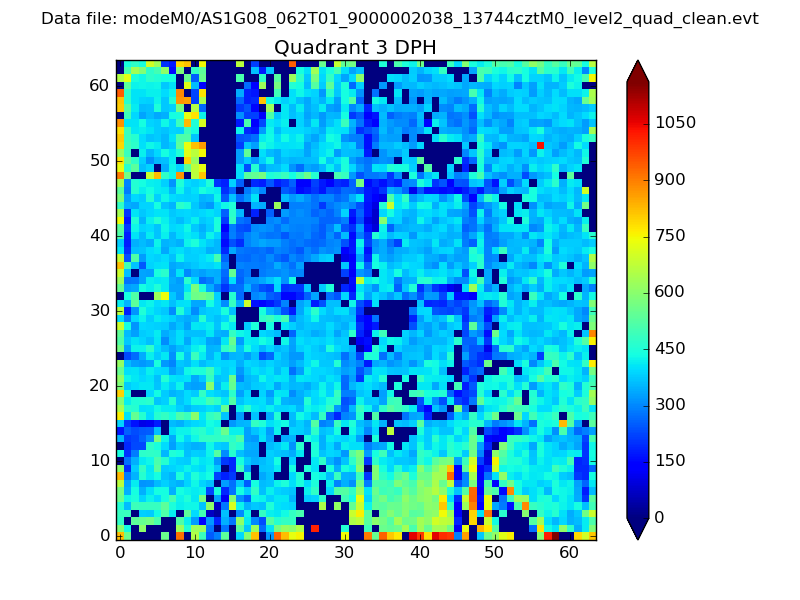 |
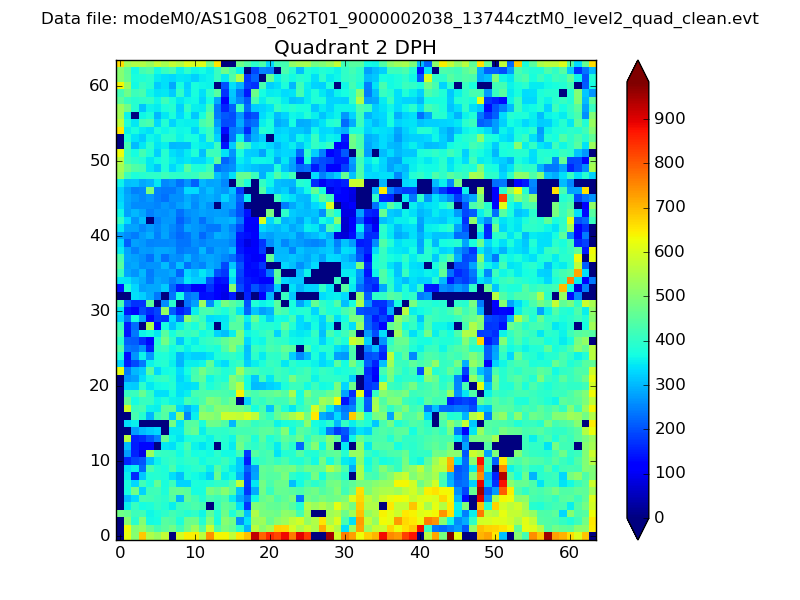 |
Quadrant C |
| Plot type | Count rate plots | Images |
|---|---|---|
| Comparison with Poisson distribution Blue bars denote a histogram of data divided into 1 sec bins. Red curve is a Poisson curve with rate = median count rate of data. |
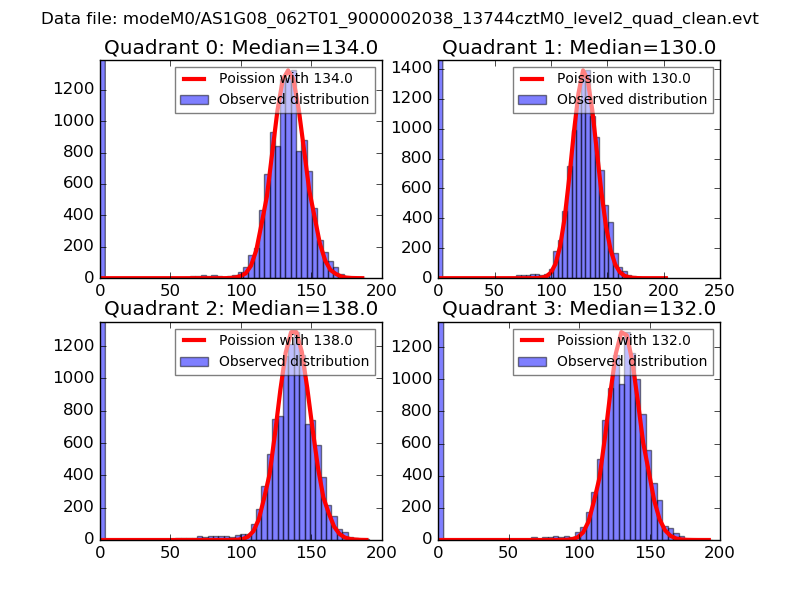 |
 |
| Quadrant-wise count rates Data is divided into 100 sec bins |
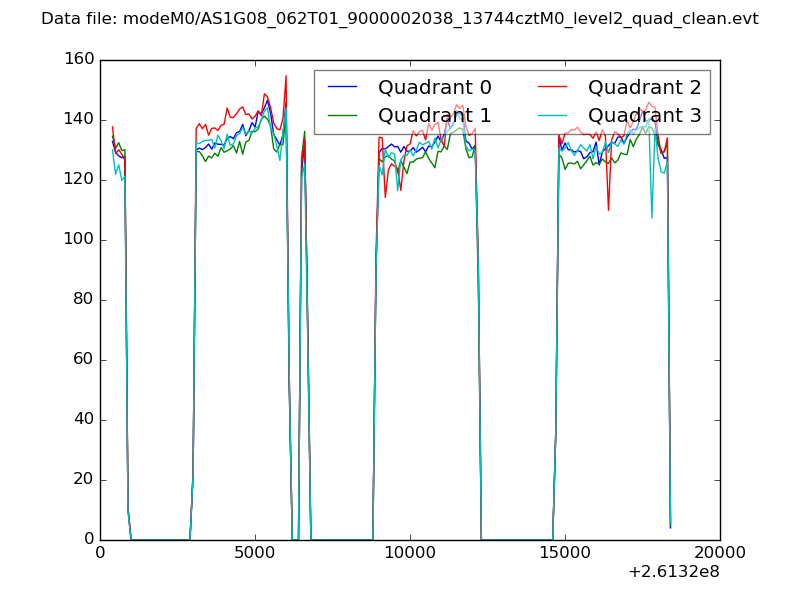 |
|
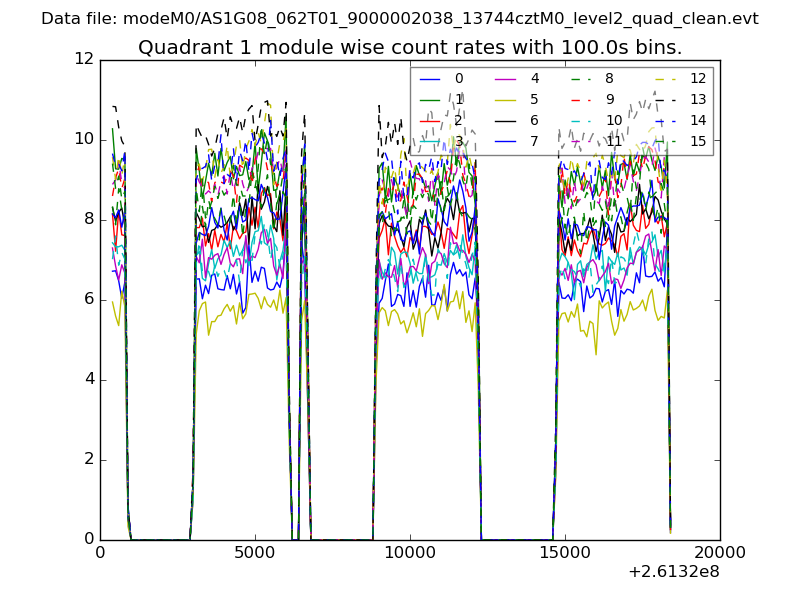
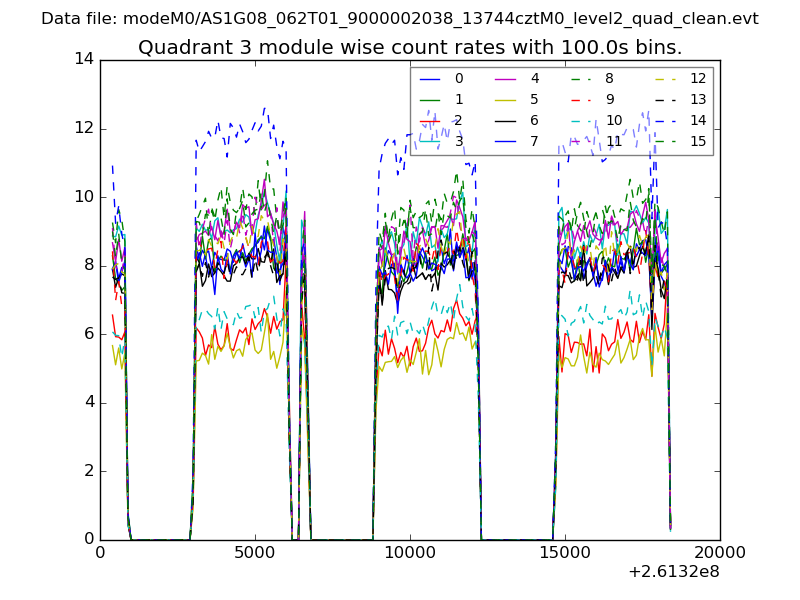
| Module-wise count rates for Quadrant A Data is divided into 100 sec bins |
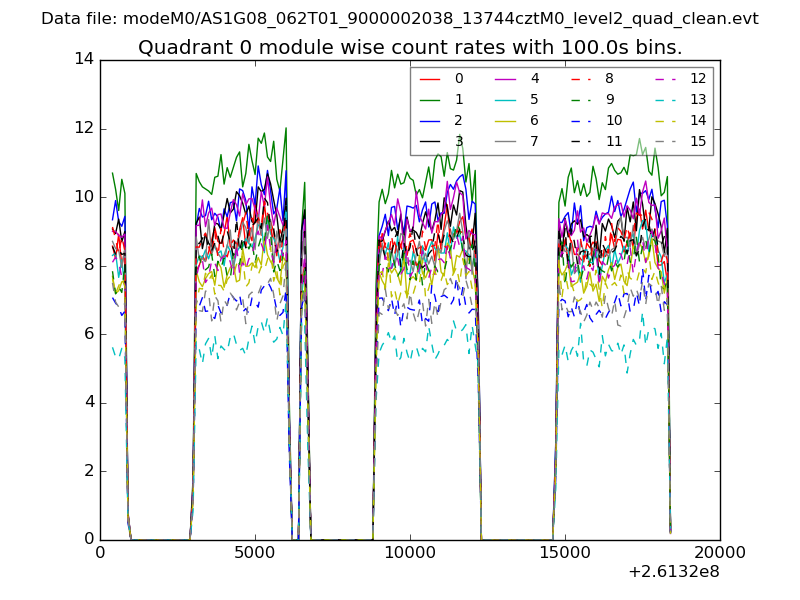 |
 |
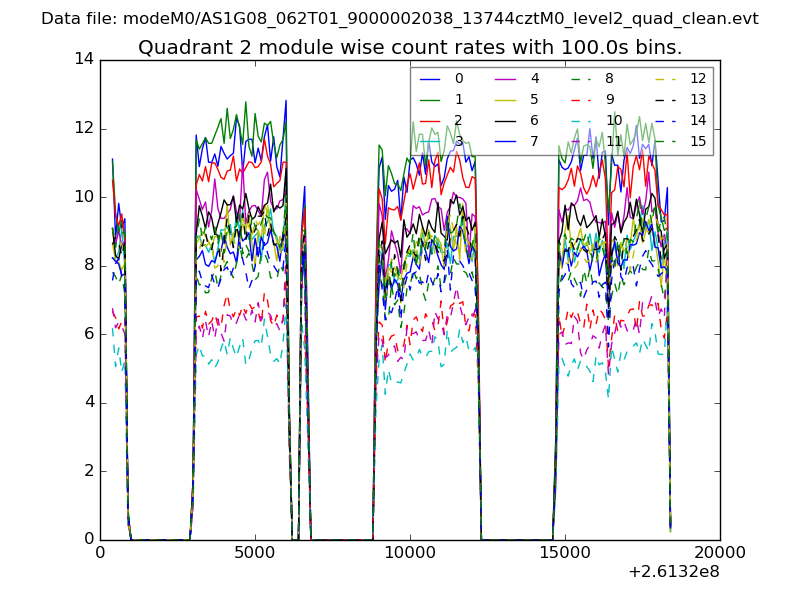
| Module-wise count rates for Quadrant B Data is divided into 100 sec bins |
 |
 |
| Module-wise count rates for Quadrant C Data is divided into 100 sec bins |
 |
 |
| Module-wise count rates for Quadrant D Data is divided into 100 sec bins |
 |
 |
| Parameter | Plot |
|---|---|
| CZT HV Monitor | 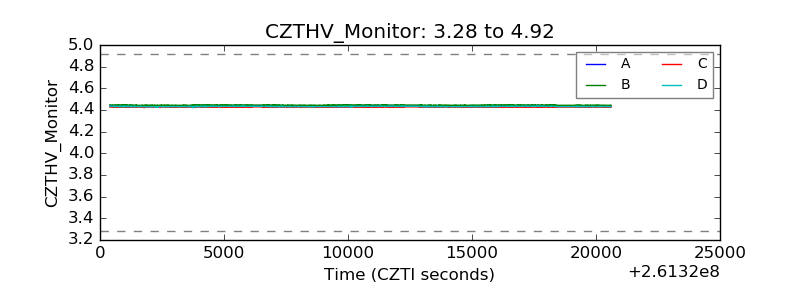 |
| D_VDD | 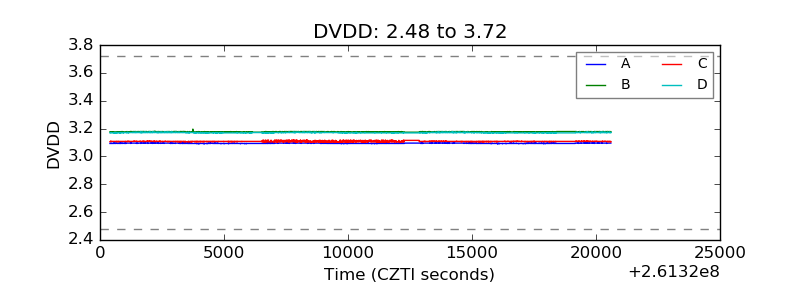 |
| Temperature 1 | 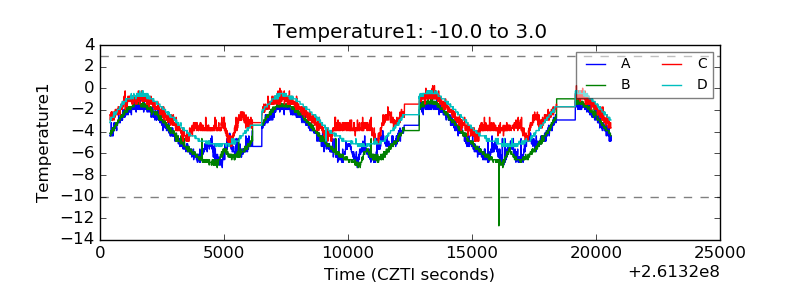 |
| Veto HV Monitor | 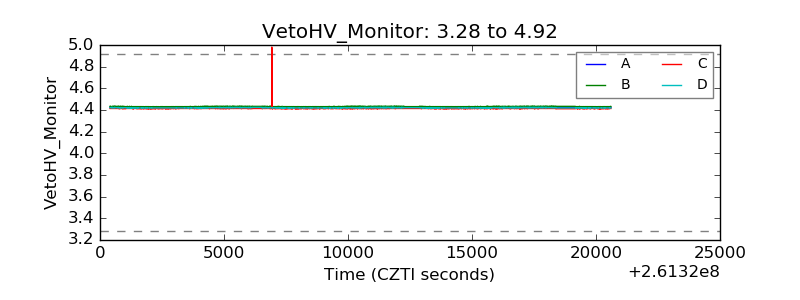 |
| Veto LLD | 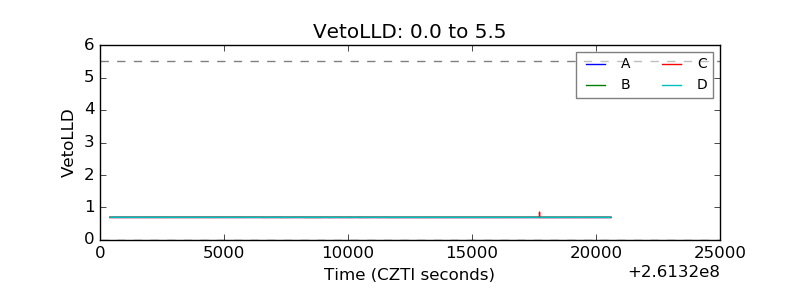 |
| Alpha Counter | 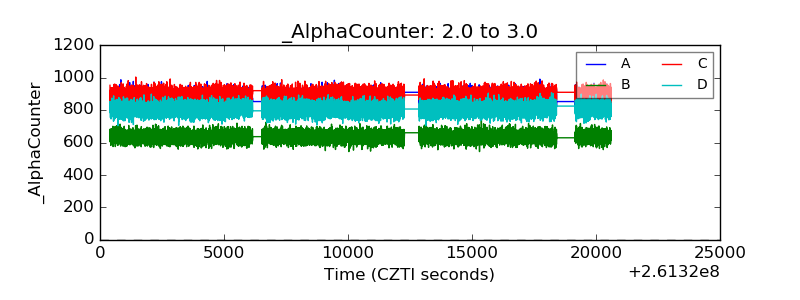 |
| _CPM_Rate | 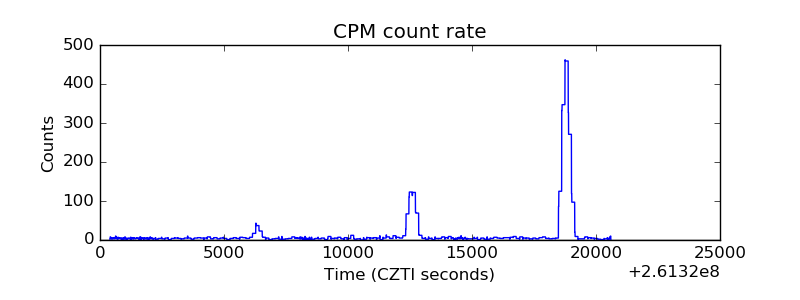 |
| CZT Counter | 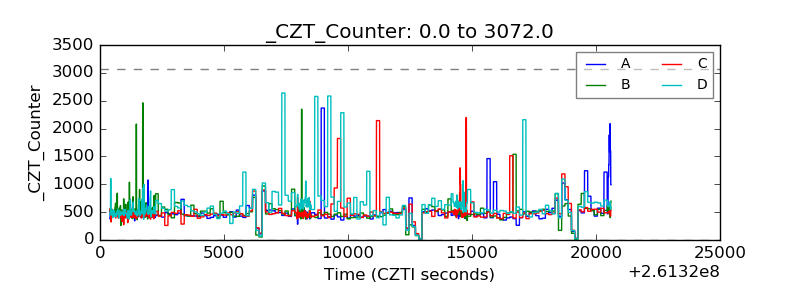 |
| +2.5 Volts monitor |  |
| +5 Volts monitor | 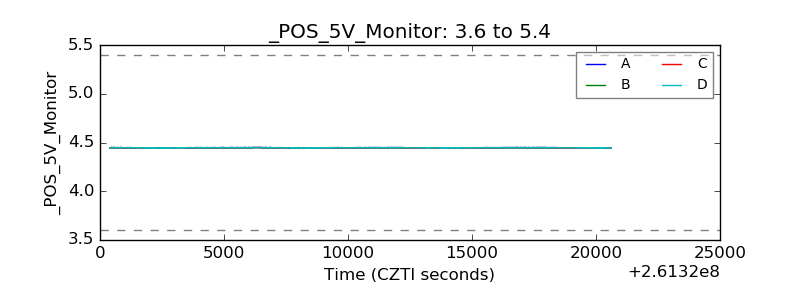 |
| _ROLL_ROT | 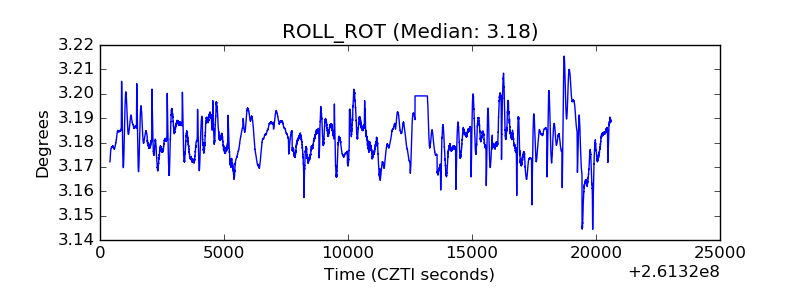 |
| _Roll_DEC | 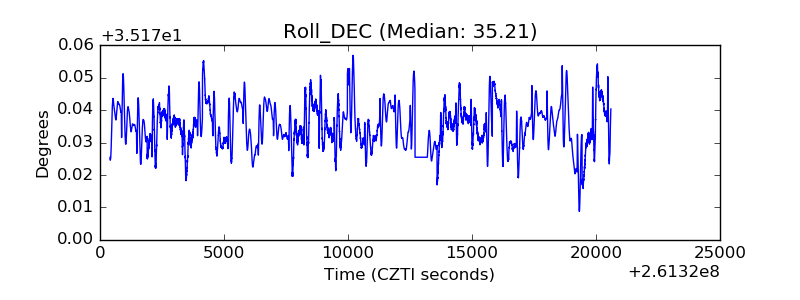 |
| _Roll_RA | 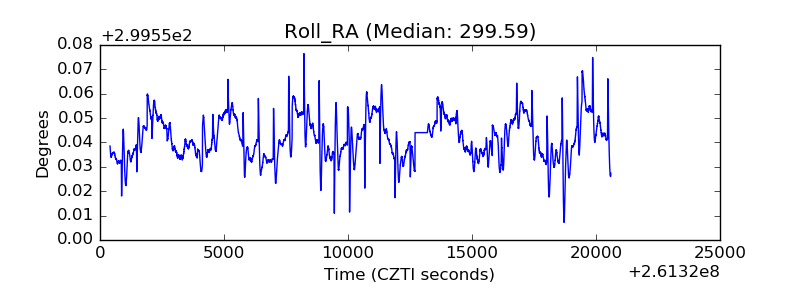 |
| Veto Counter | 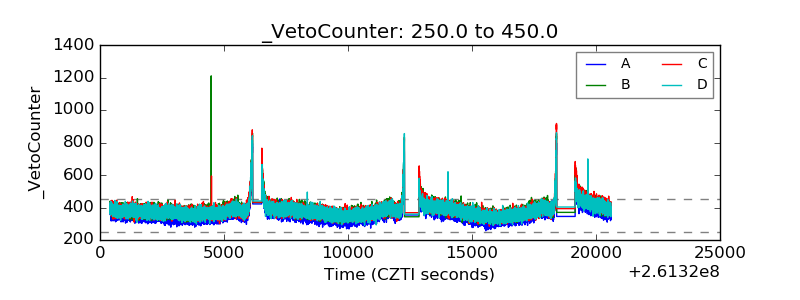 |