| Param | Original file | Final file |
|---|---|---|
| Filename | modeM0/AS1G08_062T01_9000002038_13745cztM0_level2.evt | modeM0/AS1G08_062T01_9000002038_13745cztM0_level2_quad_clean.evt |
| Size (bytes) | 558,325,440 | 85,677,120 |
| Size | 532.5 MB | 81.7 MB |
| Events in quadrant A | 3,767,798 | 530,122 |
| Events in quadrant B | 3,591,120 | 520,132 |
| Events in quadrant C | 3,314,535 | 554,024 |
| Events in quadrant D | 5,780,611 | 522,093 |
| Mode M9 | |||
|---|---|---|---|
| Quadrant | BADHDUFLAG | Total packets | Discarded packets |
| A | 0 | 13 | 0 |
| B | 0 | 13 | 0 |
| C | 0 | 13 | 0 |
| D | 0 | 14 | 0 |
| Mode M0 | |||
|---|---|---|---|
| Quadrant | BADHDUFLAG | Total packets | Discarded packets |
| A | 0 | 15501 | 3 |
| B | 0 | 14984 | 2 |
| C | 0 | 13905 | 2 |
| D | 0 | 21979 | 2 |
| Mode SS | |||
|---|---|---|---|
| Quadrant | BADHDUFLAG | Total packets | Discarded packets |
| A | 0 | 138 | 0 |
| B | 0 | 138 | 0 |
| C | 0 | 138 | 0 |
| D | 0 | 138 | 0 |
| Quadrant | Total seconds | Saturated seconds | Saturation percentage |
|---|---|---|---|
| A | 6709 | 119 | 1.773737% |
| B | 6709 | 99 | 1.475630% |
| C | 6709 | 33 | 0.491877% |
| D | 6709 | 155 | 2.310329% |
Noise dominated data is calculated using 1-second bins in cleaned event files. If a bin has >2000 counts, and if more than 50% of those come from <1% of pixels, then it is considered to be noise-dominated and hence unusable.
| Quadrant | # 1 sec bins | Bins with >0 counts | Bins with >2000 counts | High rate bins dominated by noise | Noise dominated (total time) | Noise dominated (detector-on time) | Marked lightcurve |
|---|---|---|---|---|---|---|---|
| A | 7645 | 6711 | 55 | 55 | 0.72% | 0.82% | 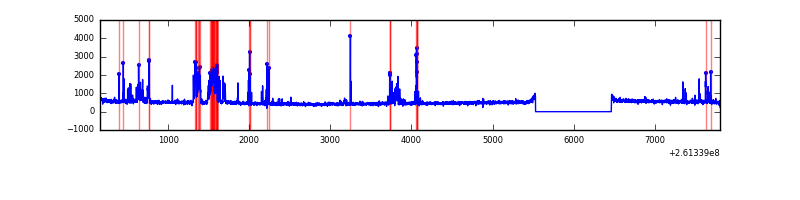 |
| B | 7645 | 6711 | 18 | 18 | 0.24% | 0.27% | 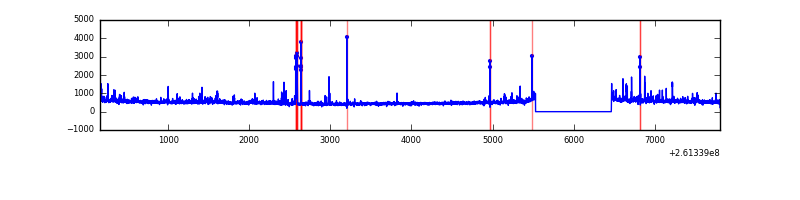 |
| C | 7645 | 6711 | 0 | 0 | 0.00% | 0.00% | 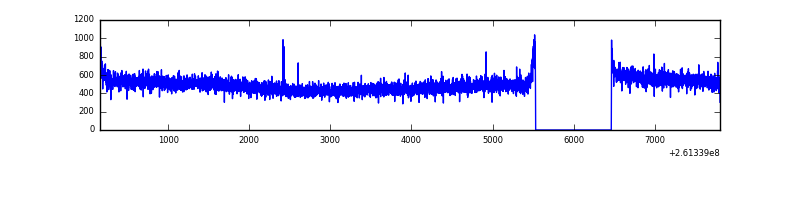 |
| D | 7645 | 6711 | 65 | 65 | 0.85% | 0.97% | 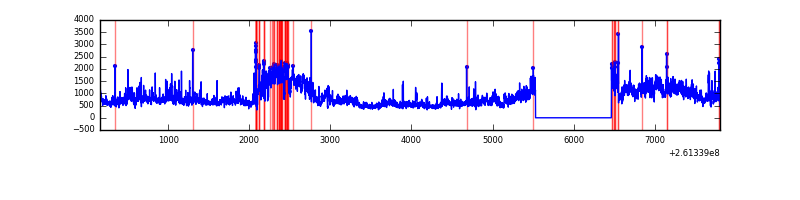 |
Top three noisy pixels from each quadrant. If the there are fewer than three noisy pixels in the level2.evt file, extra rows are filled as -1
| Pixel properties | Quadrant properties | ||||||
|---|---|---|---|---|---|---|---|
| Quadrant | DetID | PixID | Counts | Sigma | Mean | Median | Sigma |
| A | 9 | 143 | 459813 | 2681.98 | 833 | 813 | 171.1 |
| A | 15 | 69 | 57372 | 330.48 | 833 | 813 | 171.1 |
| A | 0 | 23 | 23225 | 130.96 | 833 | 813 | 171.1 |
| B | 0 | 219 | 114586 | 715.99 | 829 | 809 | 158.9 |
| B | 3 | 64 | 89888 | 560.57 | 829 | 809 | 158.9 |
| B | 4 | 173 | 50847 | 314.89 | 829 | 809 | 158.9 |
| C | 3 | 233 | 102474 | 529.62 | 823 | 828 | 191.9 |
| C | 13 | 61 | 5865 | 26.24 | 823 | 828 | 191.9 |
| C | 14 | 234 | 1940 | 5.79 | 823 | 828 | 191.9 |
| D | 13 | 168 | 2106435 | 10576.64 | 816 | 792 | 199.1 |
| D | 5 | 222 | 155110 | 775.14 | 816 | 792 | 199.1 |
| D | 1 | 3 | 148257 | 740.72 | 816 | 792 | 199.1 |
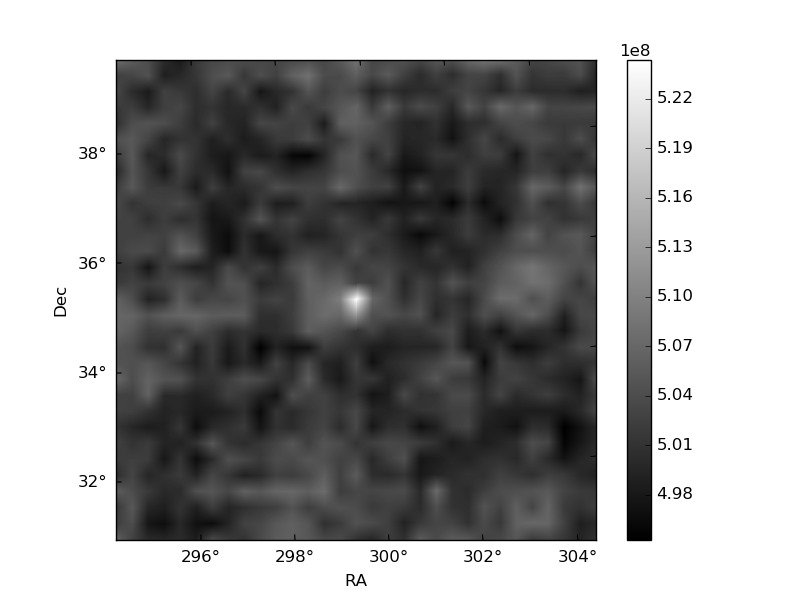
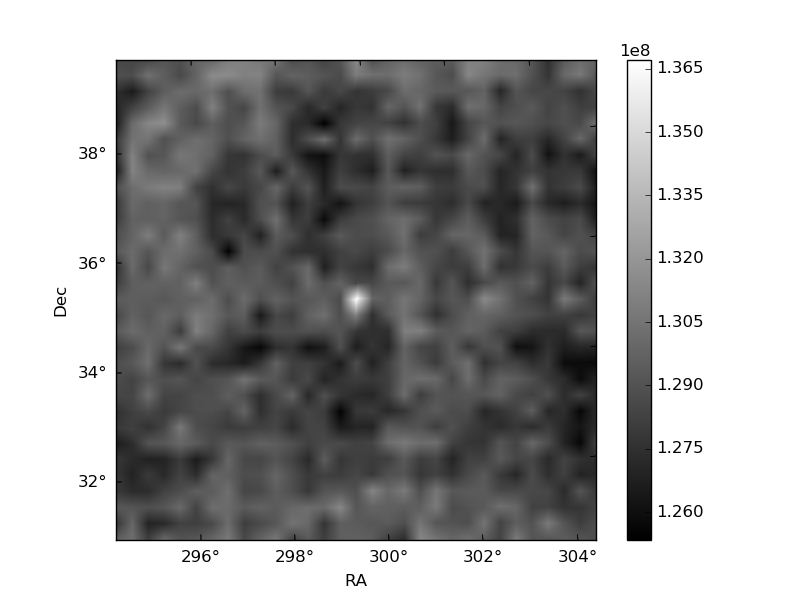
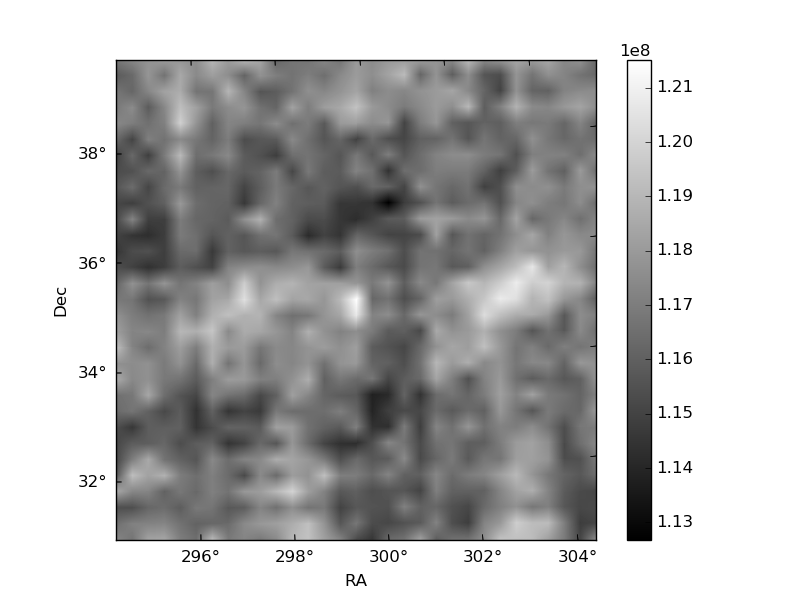
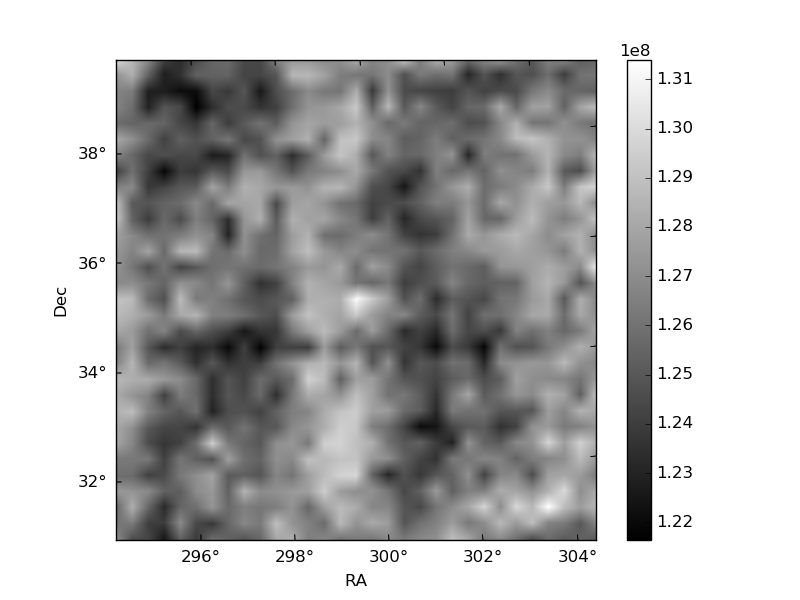
Histogram calculated using DETX and DETY for each event in the final _common_clean file
| Quadrant A | 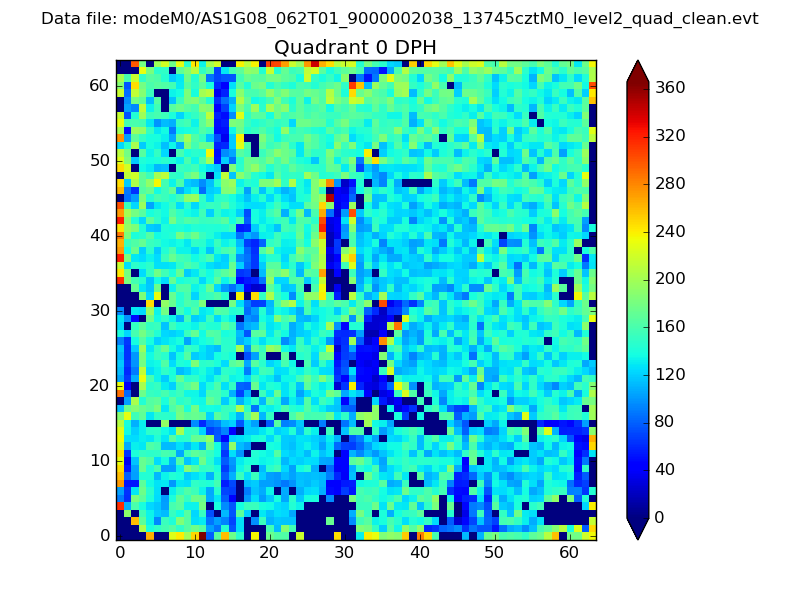 |
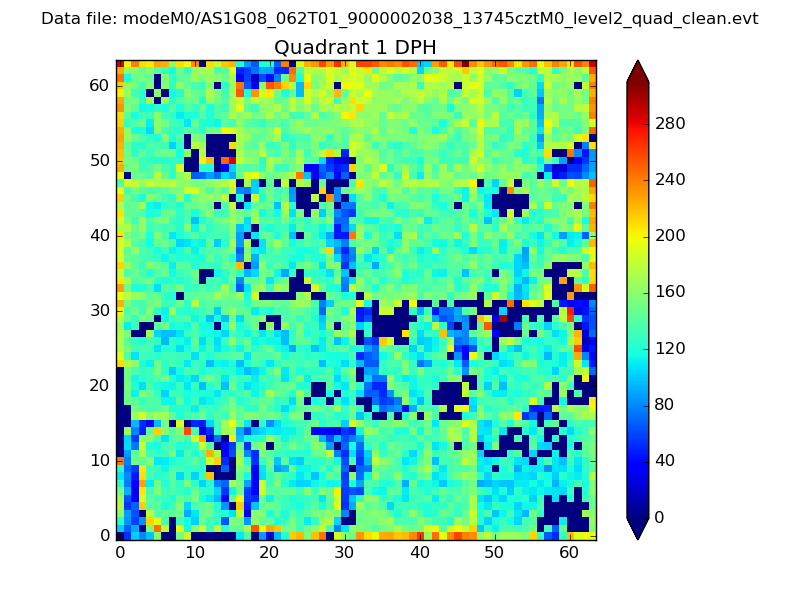 |
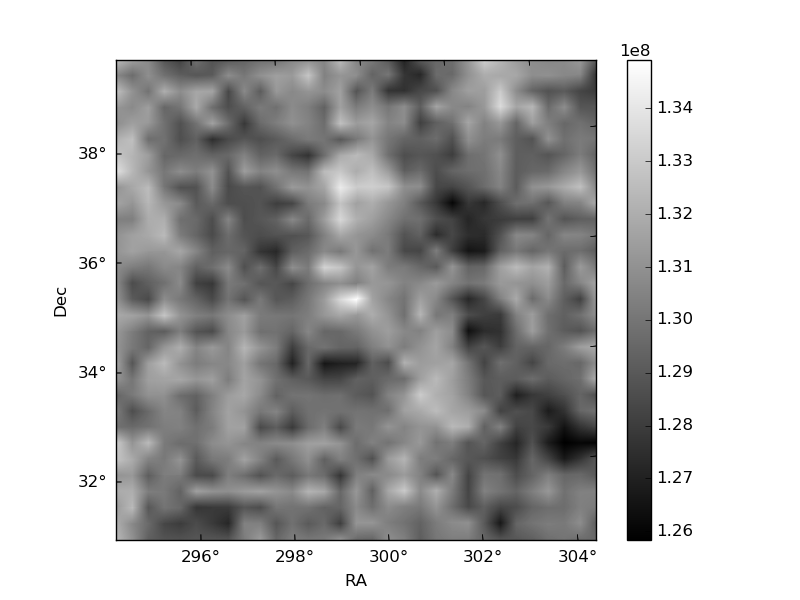
Quadrant B |
|---|---|---|---|
| Quadrant D | 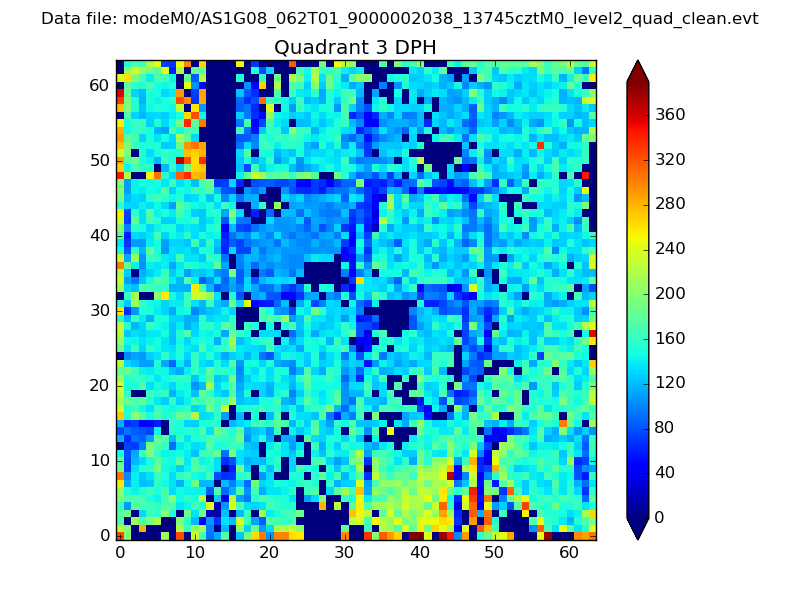 |
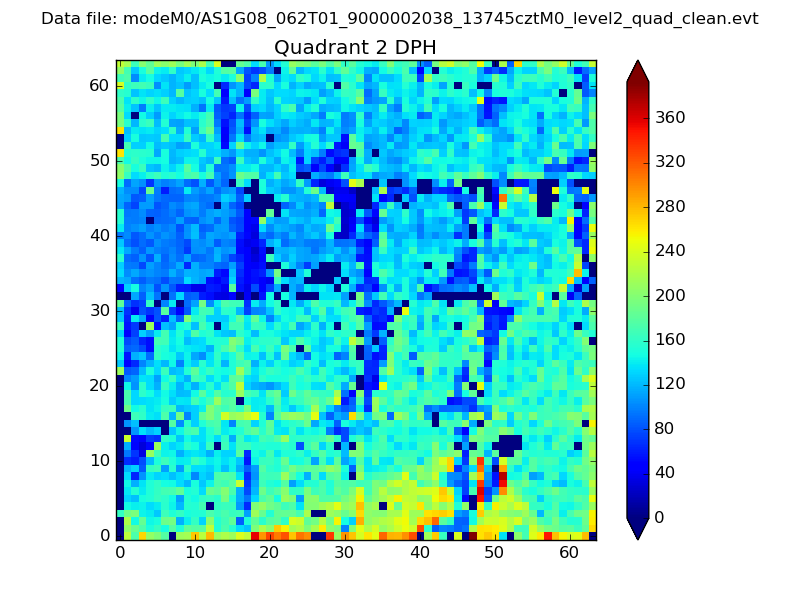 |
Quadrant C |
| Plot type | Count rate plots | Images |
|---|---|---|
| Comparison with Poisson distribution Blue bars denote a histogram of data divided into 1 sec bins. Red curve is a Poisson curve with rate = median count rate of data. |
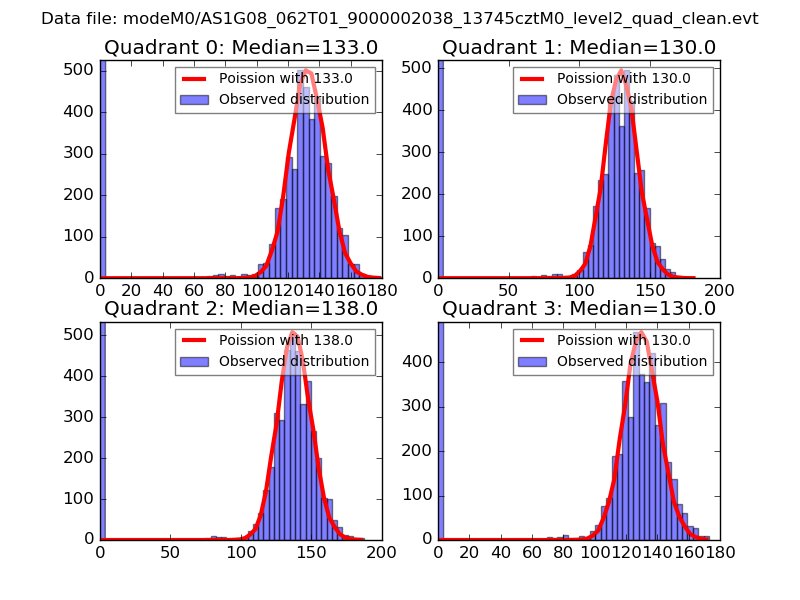 |
 |
| Quadrant-wise count rates Data is divided into 100 sec bins |
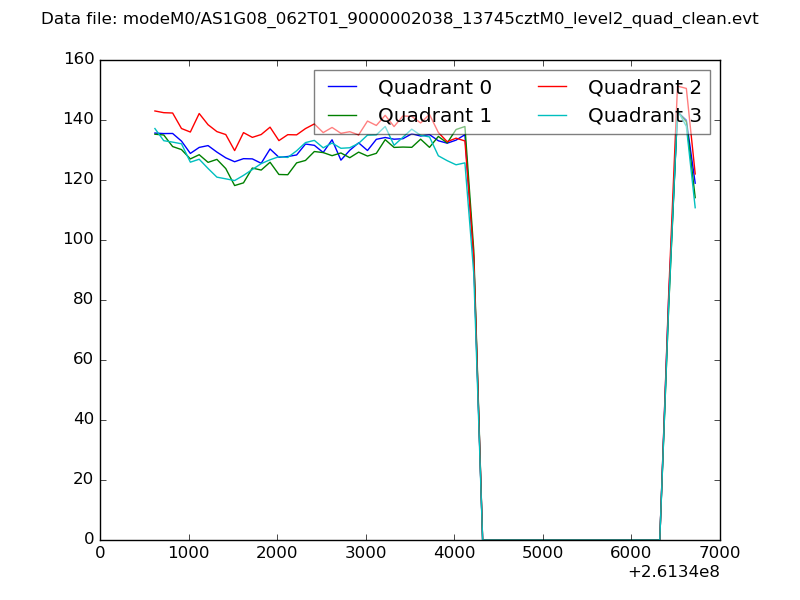 |
|
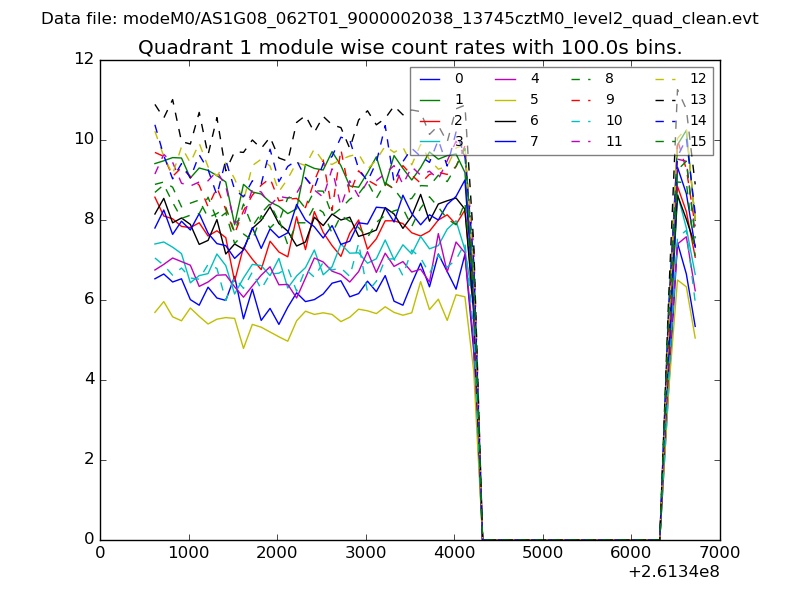
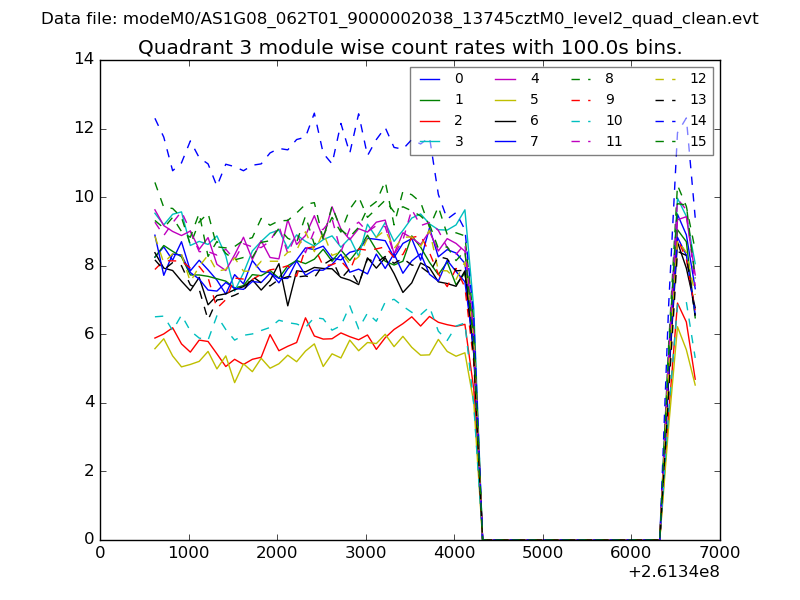
| Module-wise count rates for Quadrant A Data is divided into 100 sec bins |
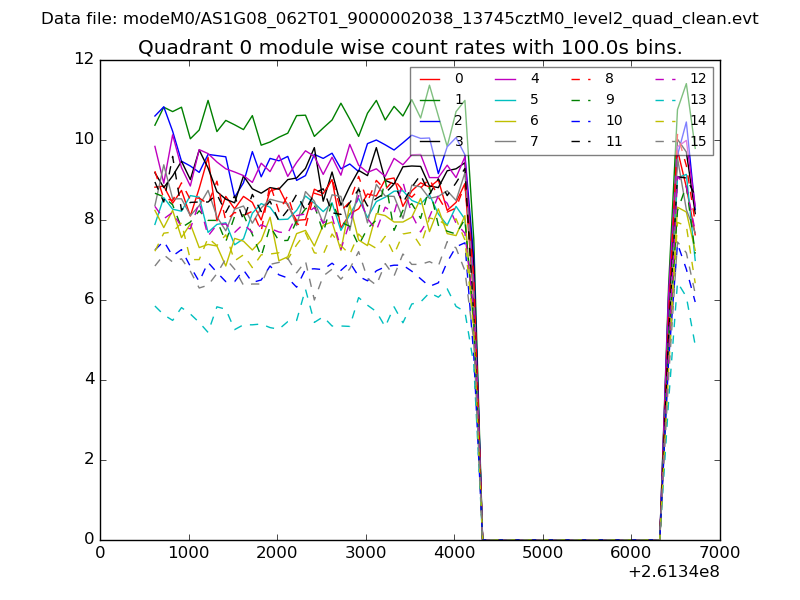 |
 |
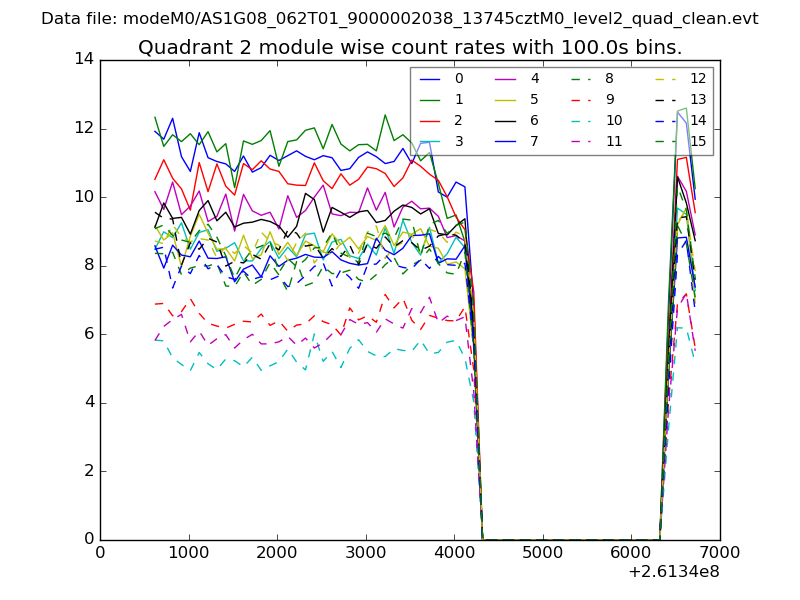
| Module-wise count rates for Quadrant B Data is divided into 100 sec bins |
 |
 |
| Module-wise count rates for Quadrant C Data is divided into 100 sec bins |
 |
 |
| Module-wise count rates for Quadrant D Data is divided into 100 sec bins |
 |
 |
| Parameter | Plot |
|---|---|
| CZT HV Monitor | 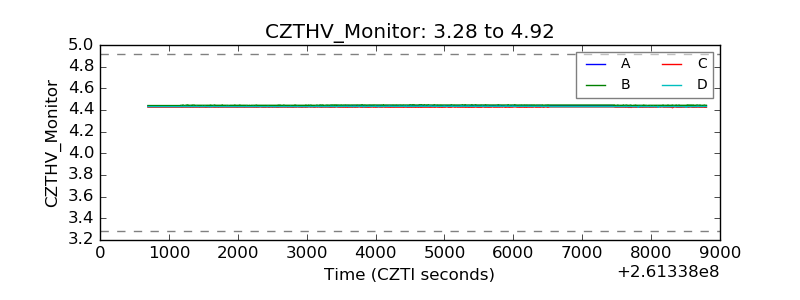 |
| D_VDD | 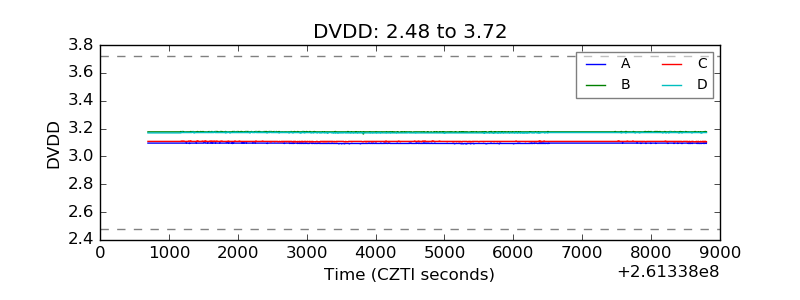 |
| Temperature 1 | 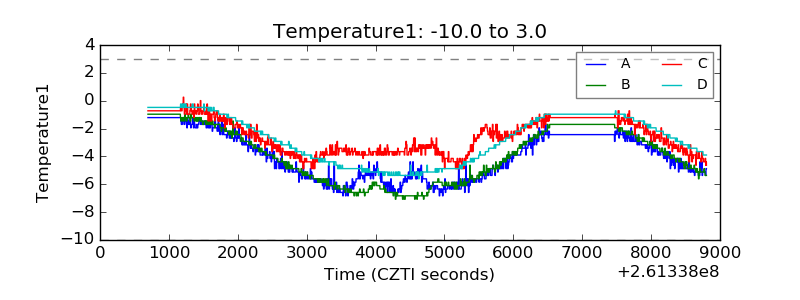 |
| Veto HV Monitor | 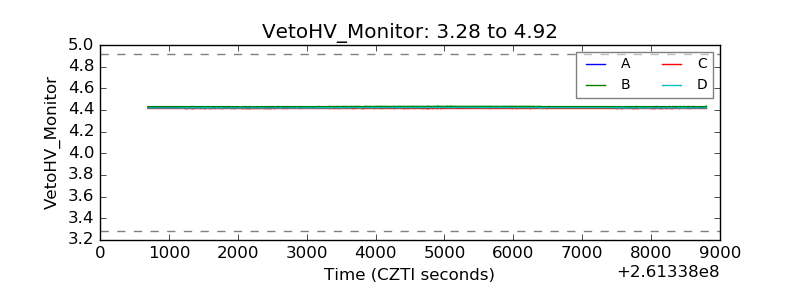 |
| Veto LLD | 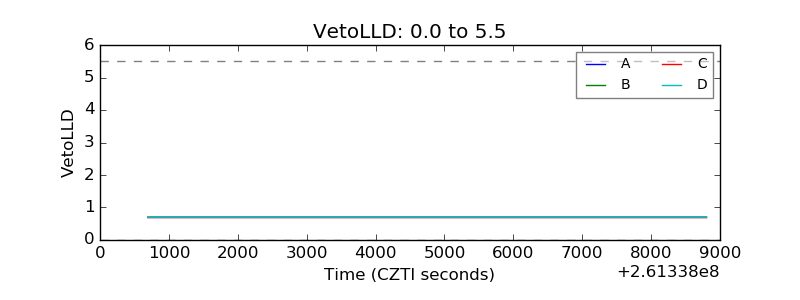 |
| Alpha Counter | 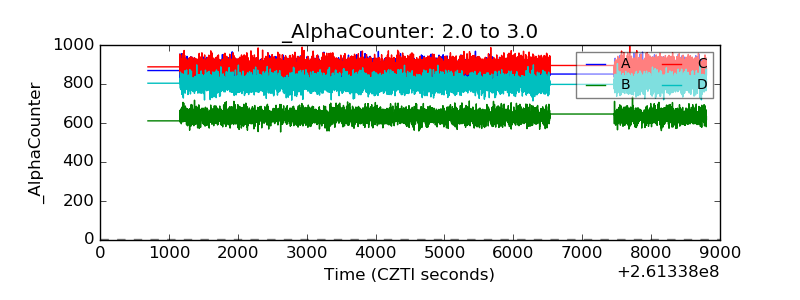 |
| _CPM_Rate | 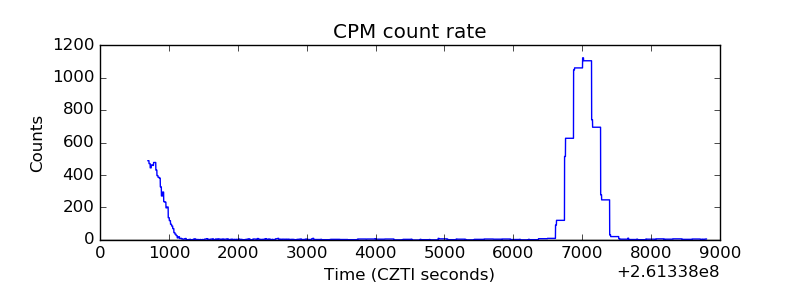 |
| CZT Counter | 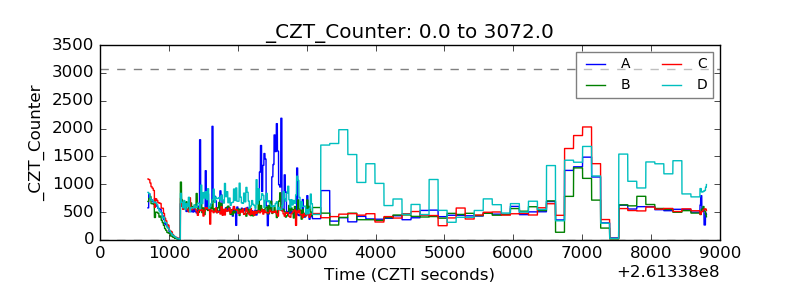 |
| +2.5 Volts monitor |  |
| +5 Volts monitor |  |
| _ROLL_ROT | 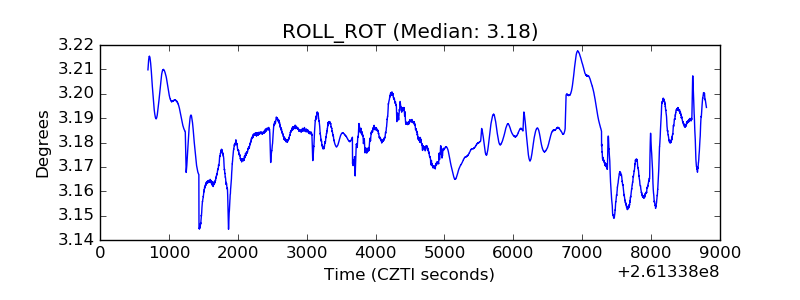 |
| _Roll_DEC | 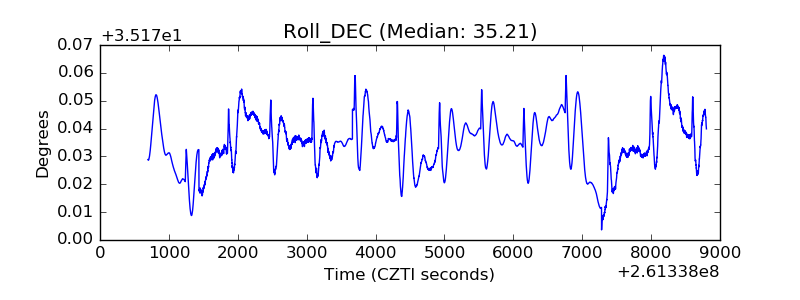 |
| _Roll_RA | 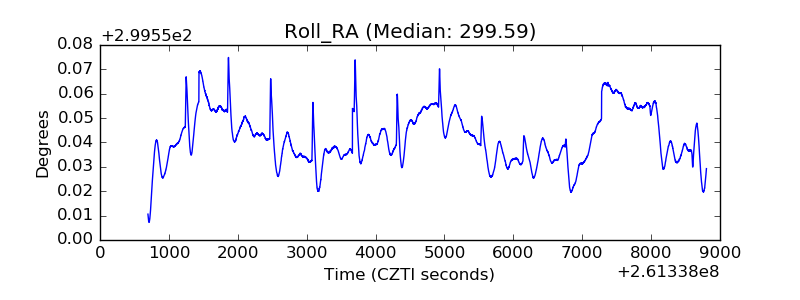 |
| Veto Counter | 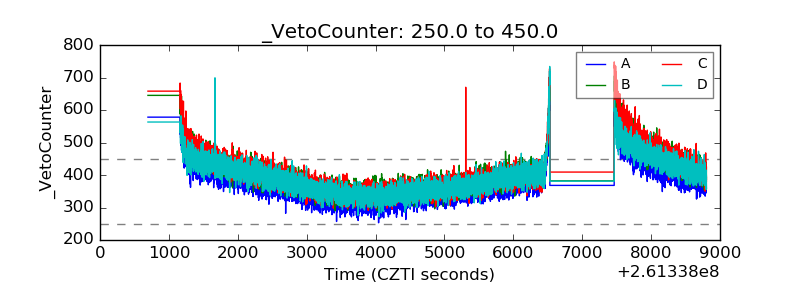 |