| Param | Original file | Final file |
|---|---|---|
| Filename | modeM0/AS1G08_062T01_9000002038_13748cztM0_level2.evt | modeM0/AS1G08_062T01_9000002038_13748cztM0_level2_quad_clean.evt |
| Size (bytes) | 491,673,600 | 104,670,720 |
| Size | 468.9 MB | 99.8 MB |
| Events in quadrant A | 3,162,133 | 679,078 |
| Events in quadrant B | 3,422,560 | 673,582 |
| Events in quadrant C | 3,216,630 | 710,760 |
| Events in quadrant D | 4,661,458 | 666,648 |
| Mode M9 | |||
|---|---|---|---|
| Quadrant | BADHDUFLAG | Total packets | Discarded packets |
| A | 0 | 15 | 0 |
| B | 0 | 15 | 0 |
| C | 0 | 15 | 0 |
| D | 0 | 16 | 0 |
| Mode M0 | |||
|---|---|---|---|
| Quadrant | BADHDUFLAG | Total packets | Discarded packets |
| A | 0 | 13536 | 3 |
| B | 0 | 14352 | 2 |
| C | 0 | 13593 | 2 |
| D | 0 | 18040 | 2 |
| Mode SS | |||
|---|---|---|---|
| Quadrant | BADHDUFLAG | Total packets | Discarded packets |
| A | 0 | 128 | 0 |
| B | 0 | 128 | 0 |
| C | 0 | 128 | 0 |
| D | 0 | 128 | 0 |
| Quadrant | Total seconds | Saturated seconds | Saturation percentage |
|---|---|---|---|
| A | 6304 | 34 | 0.539340% |
| B | 6304 | 71 | 1.126269% |
| C | 6304 | 36 | 0.571066% |
| D | 6304 | 120 | 1.903553% |
Noise dominated data is calculated using 1-second bins in cleaned event files. If a bin has >2000 counts, and if more than 50% of those come from <1% of pixels, then it is considered to be noise-dominated and hence unusable.
| Quadrant | # 1 sec bins | Bins with >0 counts | Bins with >2000 counts | High rate bins dominated by noise | Noise dominated (total time) | Noise dominated (detector-on time) | Marked lightcurve |
|---|---|---|---|---|---|---|---|
| A | 7510 | 6306 | 6 | 6 | 0.08% | 0.10% | 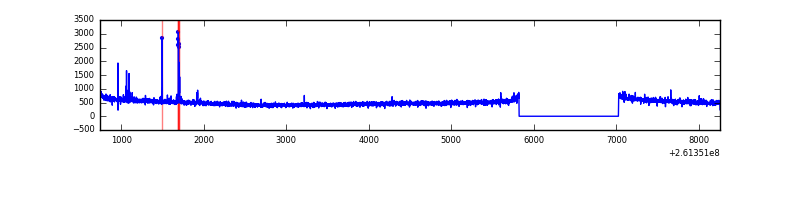 |
| B | 7510 | 6306 | 14 | 14 | 0.19% | 0.22% | 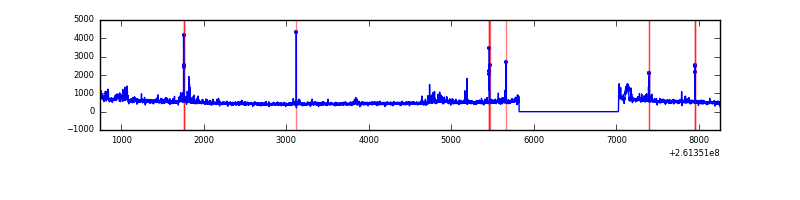 |
| C | 7510 | 6306 | 0 | 0 | 0.00% | 0.00% | 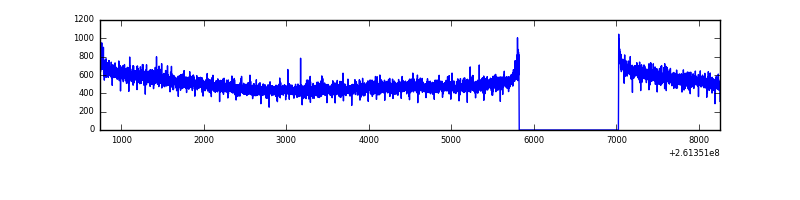 |
| D | 7510 | 6306 | 85 | 85 | 1.13% | 1.35% | 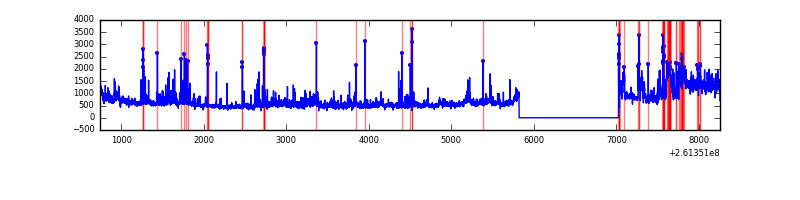 |
Top three noisy pixels from each quadrant. If the there are fewer than three noisy pixels in the level2.evt file, extra rows are filled as -1
| Pixel properties | Quadrant properties | ||||||
|---|---|---|---|---|---|---|---|
| Quadrant | DetID | PixID | Counts | Sigma | Mean | Median | Sigma |
| A | 15 | 69 | 37649 | 229.72 | 800 | 785 | 160.5 |
| A | 9 | 143 | 16293 | 96.64 | 800 | 785 | 160.5 |
| A | 1 | 162 | 12834 | 75.08 | 800 | 785 | 160.5 |
| B | 0 | 219 | 112706 | 740.38 | 801 | 782 | 151.2 |
| B | 4 | 173 | 65419 | 427.57 | 801 | 782 | 151.2 |
| B | 8 | 250 | 27553 | 177.09 | 801 | 782 | 151.2 |
| C | 3 | 233 | 108147 | 574.8 | 797 | 802 | 186.8 |
| C | 13 | 61 | 5518 | 25.25 | 797 | 802 | 186.8 |
| C | 14 | 234 | 2070 | 6.79 | 797 | 802 | 186.8 |
| D | 5 | 222 | 1084306 | 5391.18 | 778 | 760 | 201.0 |
| D | 13 | 168 | 370000 | 1837.15 | 778 | 760 | 201.0 |
| D | 13 | 249 | 86344 | 425.82 | 778 | 760 | 201.0 |
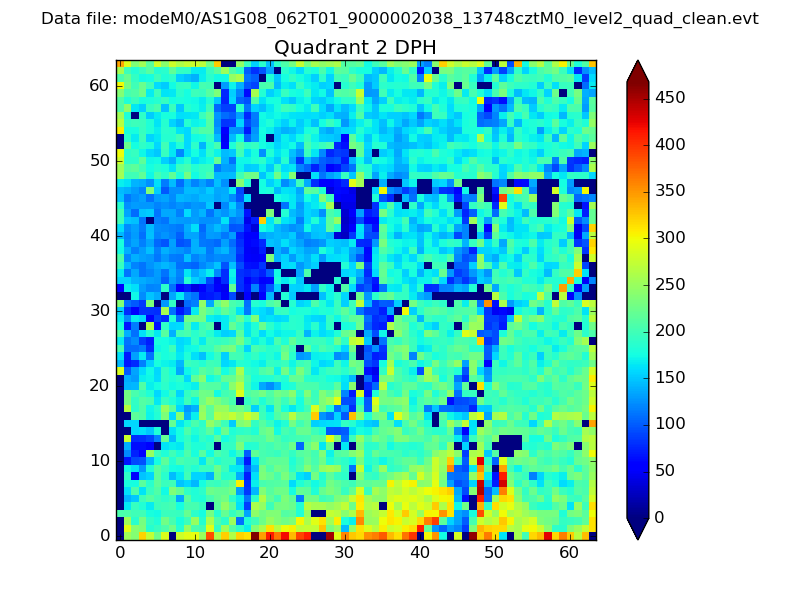
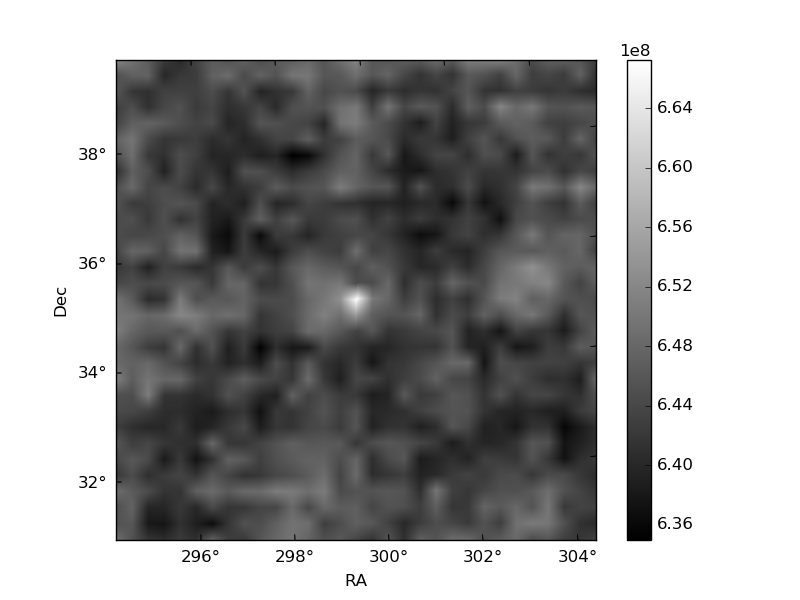
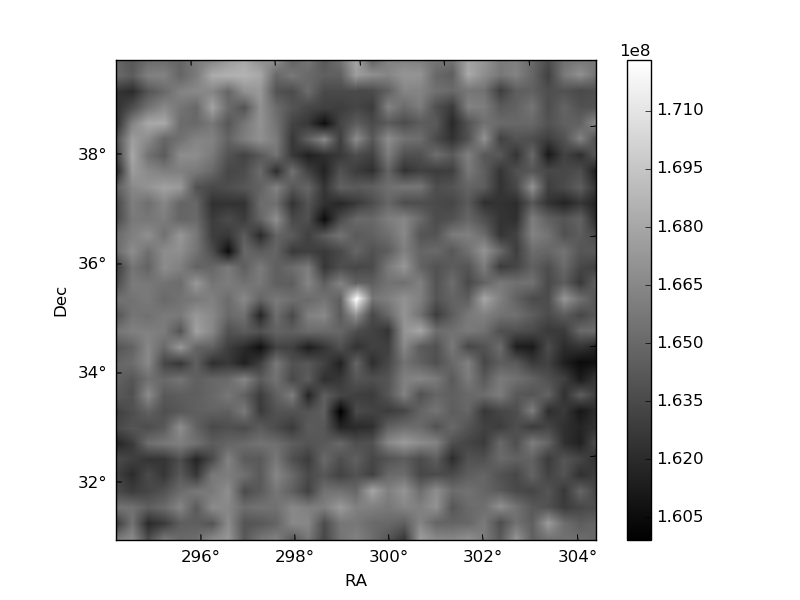
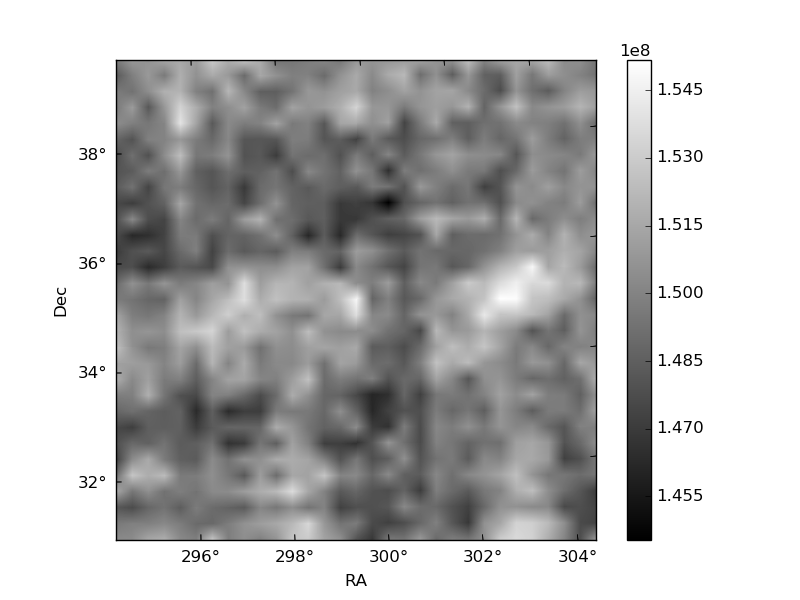
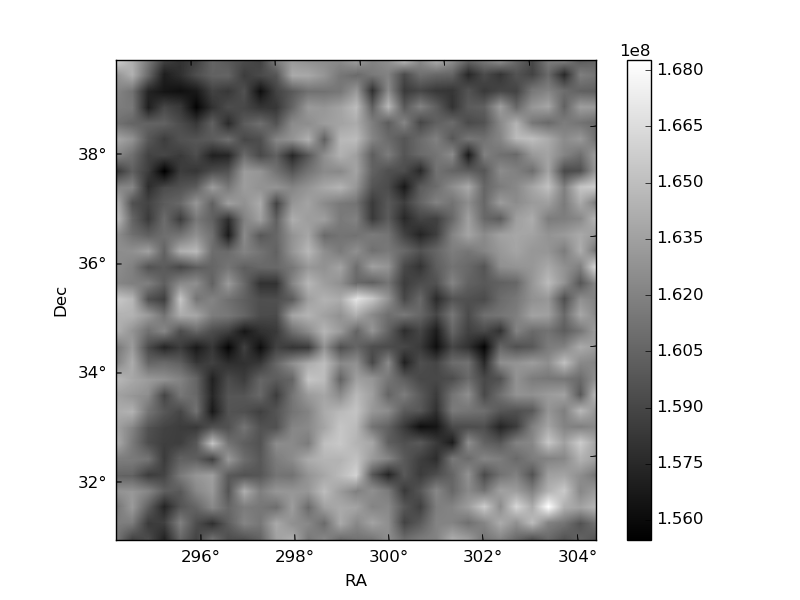
Histogram calculated using DETX and DETY for each event in the final _common_clean file
| Quadrant A | 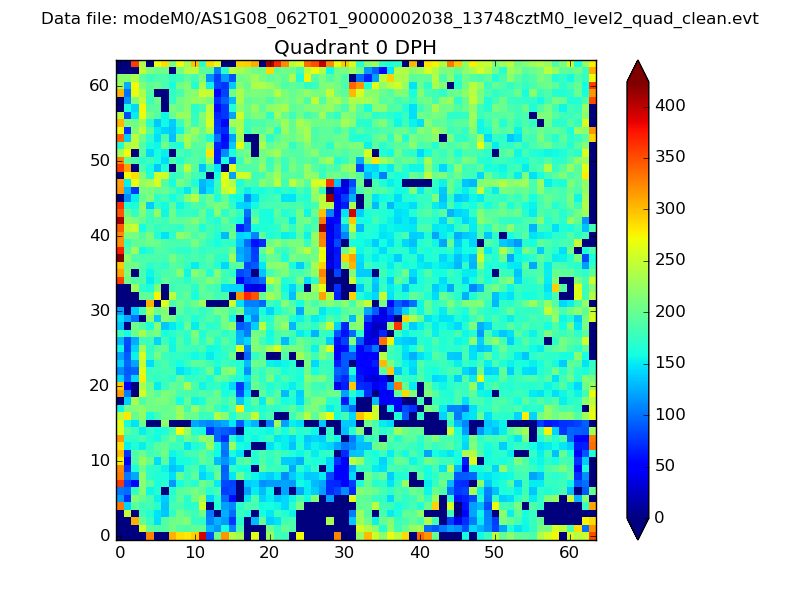 |
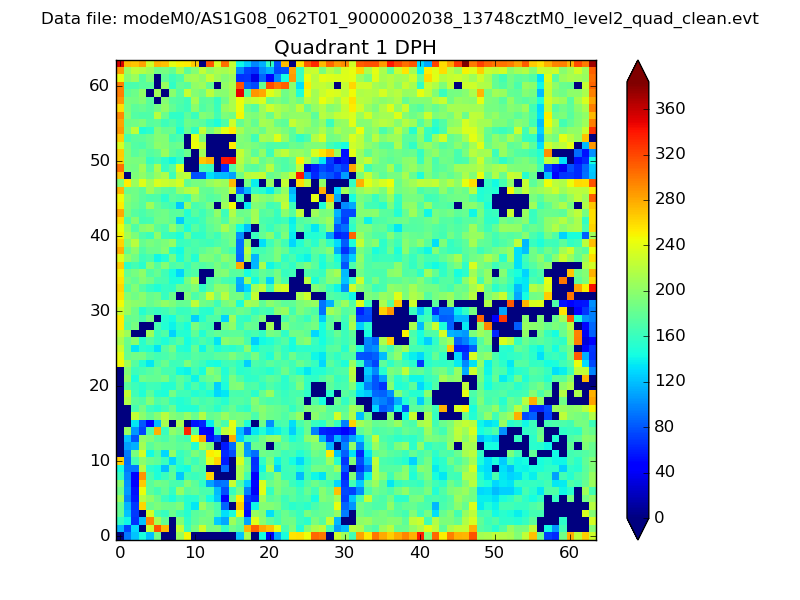 |
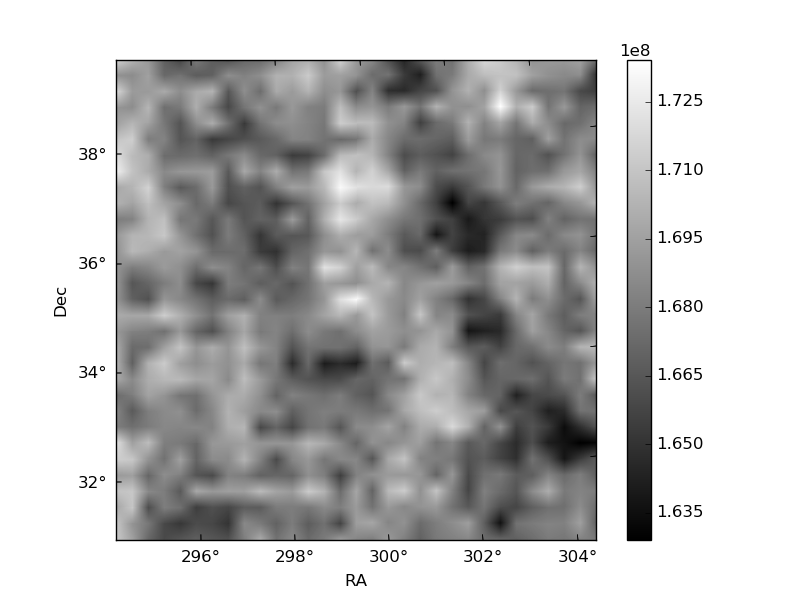
Quadrant B |
|---|---|---|---|
| Quadrant D | 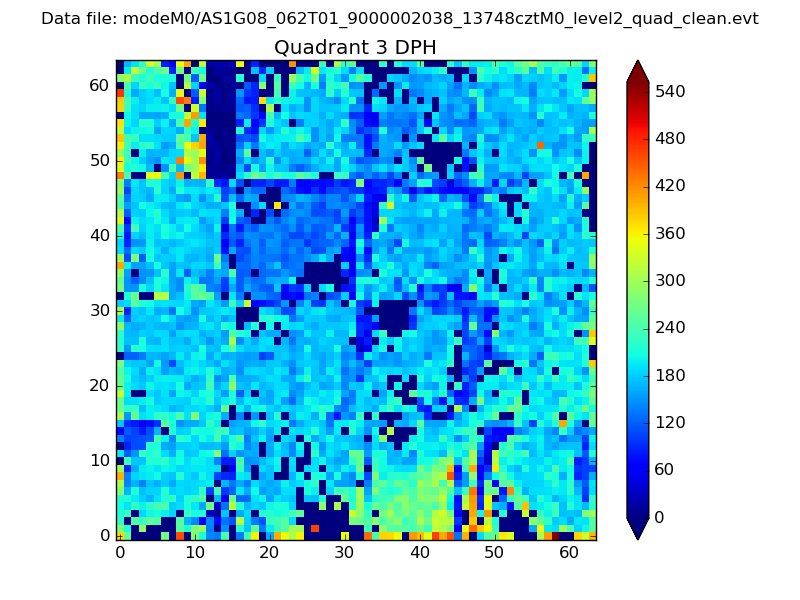 |
 |
Quadrant C |
| Plot type | Count rate plots | Images |
|---|---|---|
| Comparison with Poisson distribution Blue bars denote a histogram of data divided into 1 sec bins. Red curve is a Poisson curve with rate = median count rate of data. |
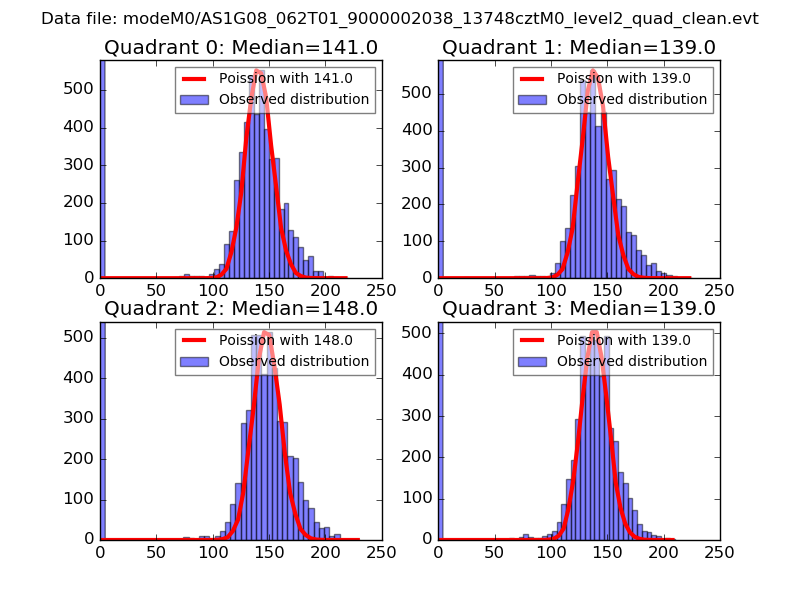 |
 |
| Quadrant-wise count rates Data is divided into 100 sec bins |
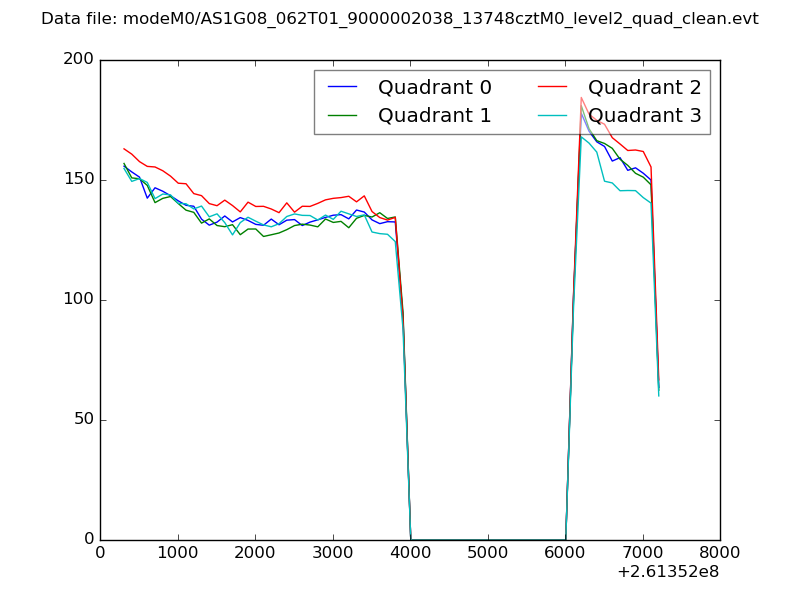 |
|
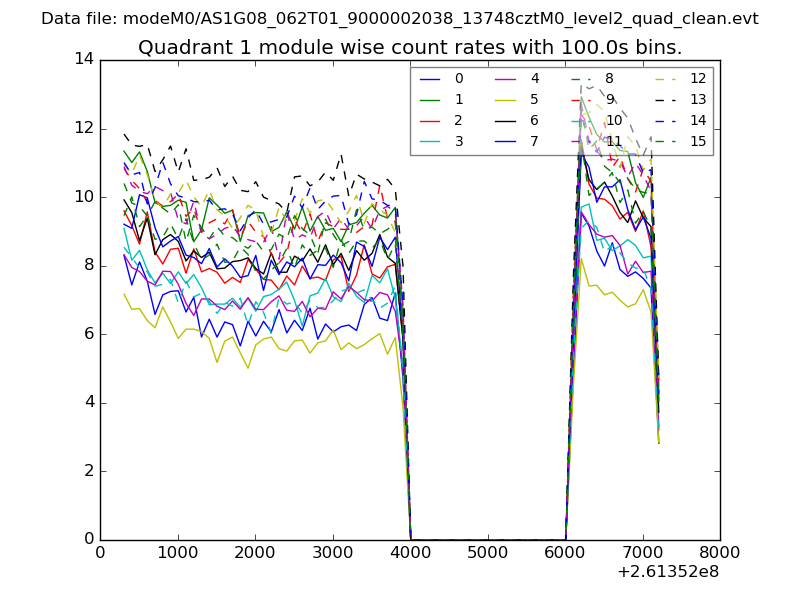
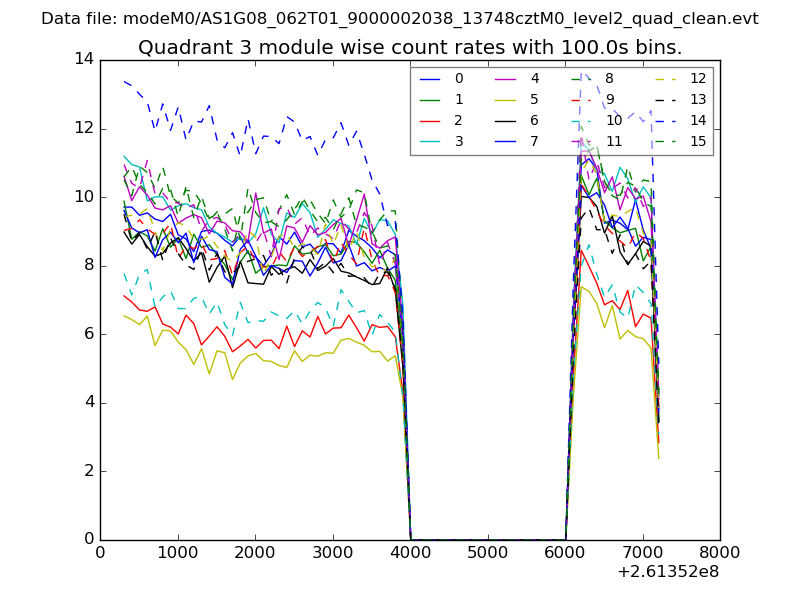
| Module-wise count rates for Quadrant A Data is divided into 100 sec bins |
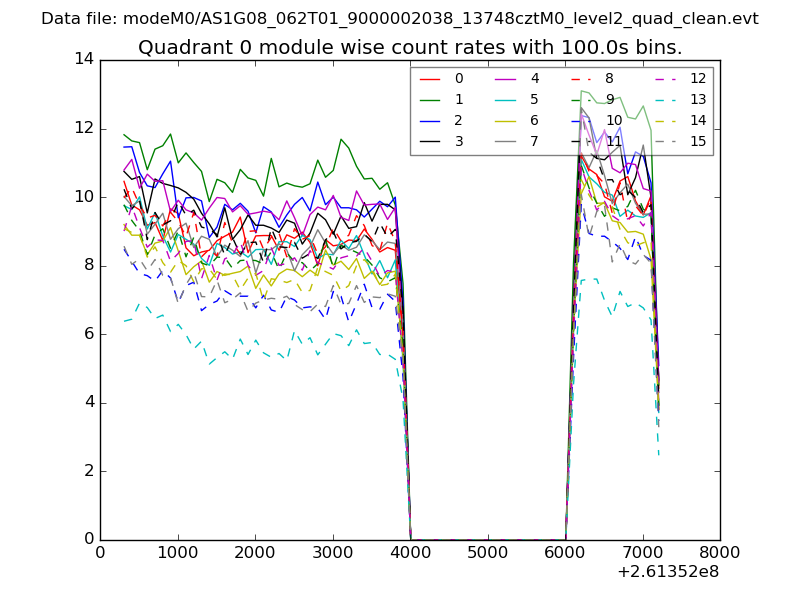 |
 |
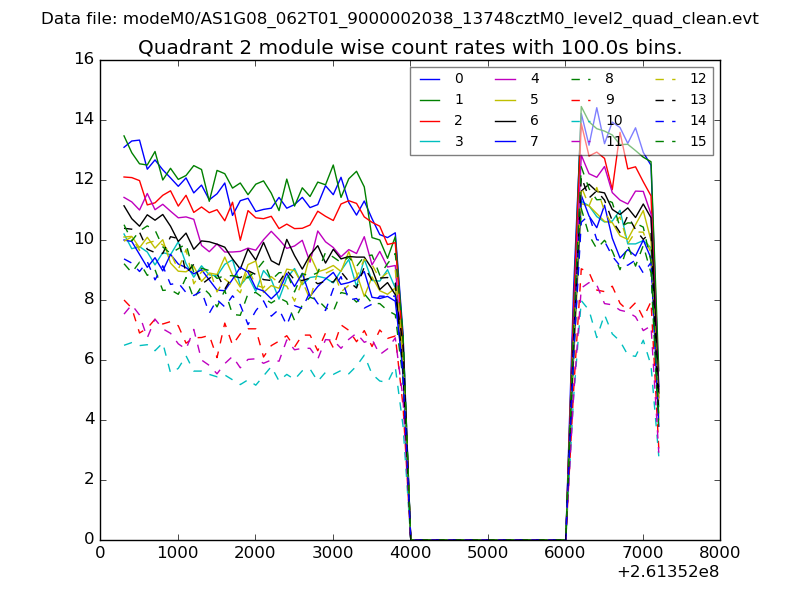
| Module-wise count rates for Quadrant B Data is divided into 100 sec bins |
 |
 |
| Module-wise count rates for Quadrant C Data is divided into 100 sec bins |
 |
 |
| Module-wise count rates for Quadrant D Data is divided into 100 sec bins |
 |
 |
| Parameter | Plot |
|---|---|
| CZT HV Monitor | 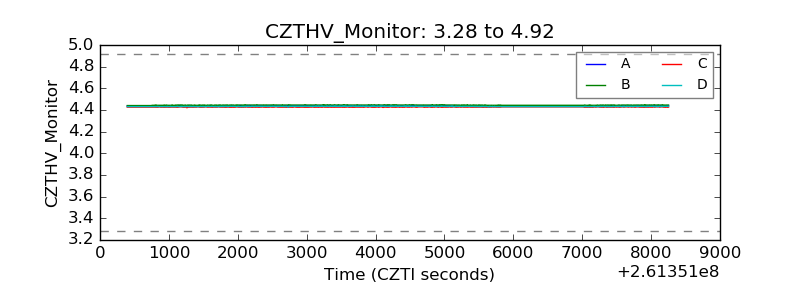 |
| D_VDD | 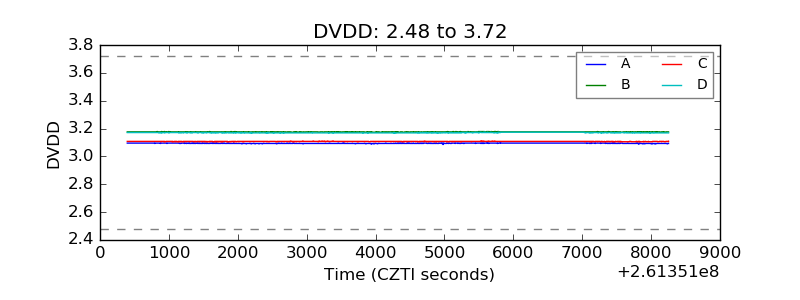 |
| Temperature 1 | 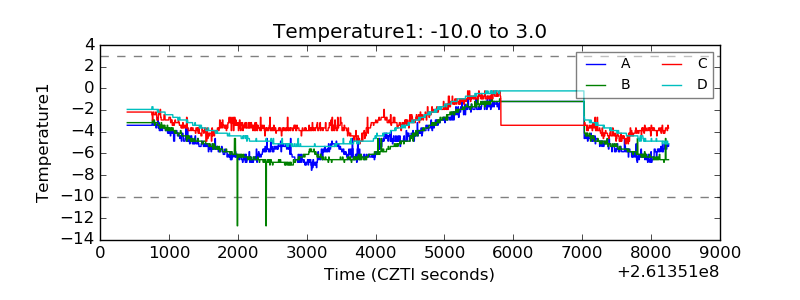 |
| Veto HV Monitor | 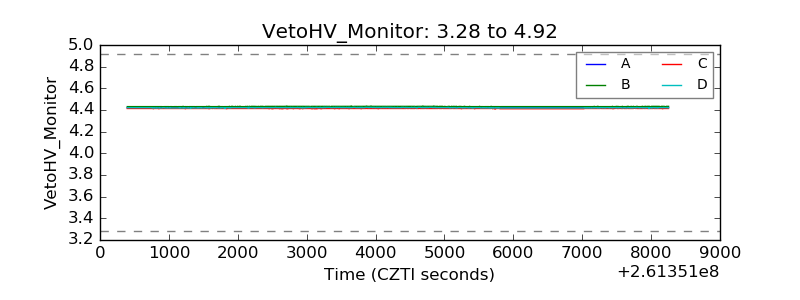 |
| Veto LLD | 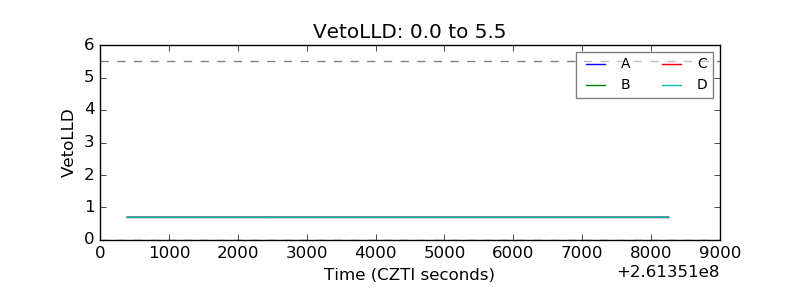 |
| Alpha Counter | 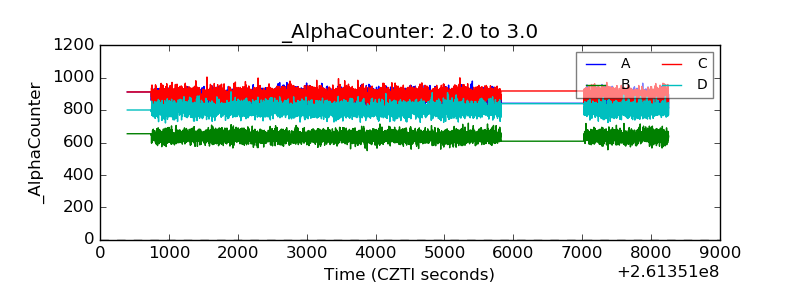 |
| _CPM_Rate | 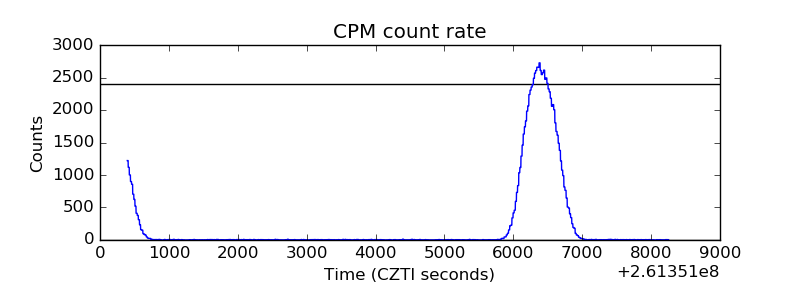 |
| CZT Counter | 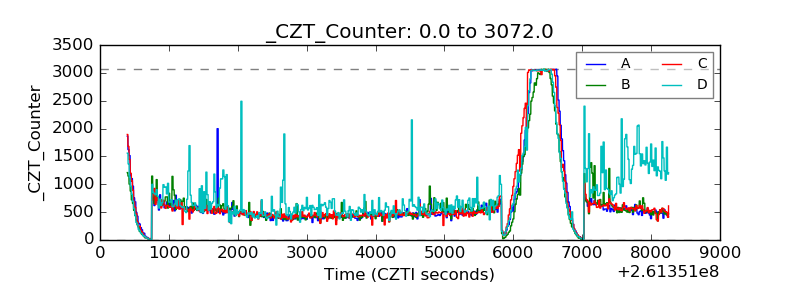 |
| +2.5 Volts monitor |  |
| +5 Volts monitor |  |
| _ROLL_ROT | 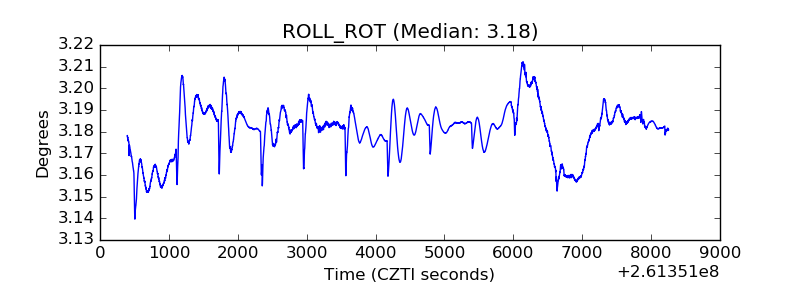 |
| _Roll_DEC | 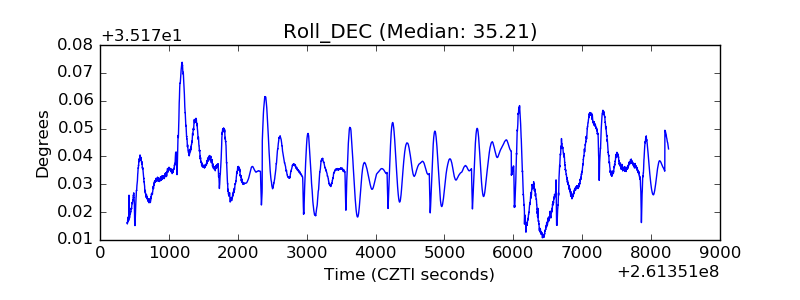 |
| _Roll_RA | 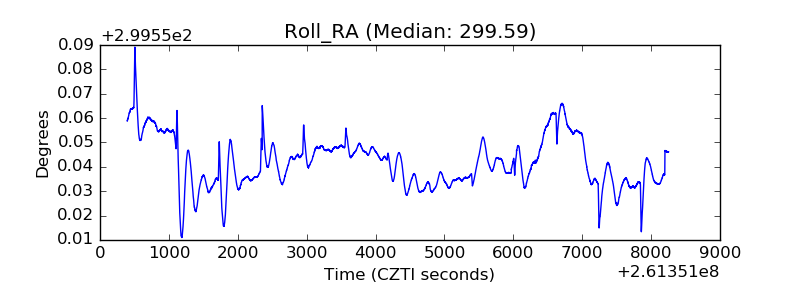 |
| Veto Counter | 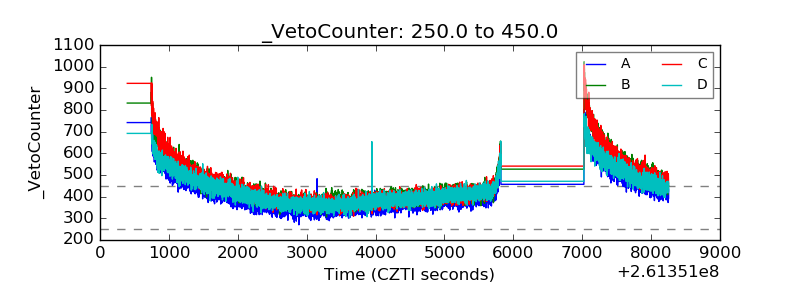 |