| Param | Original file | Final file |
|---|---|---|
| Filename | modeM0/AS1G08_062T01_9000002038_13749cztM0_level2.evt | modeM0/AS1G08_062T01_9000002038_13749cztM0_level2_quad_clean.evt |
| Size (bytes) | 593,688,960 | 111,646,080 |
| Size | 566.2 MB | 106.5 MB |
| Events in quadrant A | 3,115,773 | 738,495 |
| Events in quadrant B | 3,452,490 | 736,242 |
| Events in quadrant C | 3,208,385 | 770,479 |
| Events in quadrant D | 7,783,107 | 702,209 |
| Mode M9 | |||
|---|---|---|---|
| Quadrant | BADHDUFLAG | Total packets | Discarded packets |
| A | 0 | 21 | 0 |
| B | 0 | 21 | 0 |
| C | 0 | 21 | 0 |
| D | 0 | 22 | 0 |
| Mode M0 | |||
|---|---|---|---|
| Quadrant | BADHDUFLAG | Total packets | Discarded packets |
| A | 0 | 13231 | 3 |
| B | 0 | 14333 | 2 |
| C | 0 | 13415 | 2 |
| D | 0 | 27459 | 2 |
| Mode SS | |||
|---|---|---|---|
| Quadrant | BADHDUFLAG | Total packets | Discarded packets |
| A | 0 | 126 | 0 |
| B | 0 | 126 | 0 |
| C | 0 | 126 | 0 |
| D | 0 | 126 | 0 |
| Quadrant | Total seconds | Saturated seconds | Saturation percentage |
|---|---|---|---|
| A | 6219 | 28 | 0.450233% |
| B | 6219 | 119 | 1.913491% |
| C | 6219 | 29 | 0.466313% |
| D | 6219 | 536 | 8.618749% |
Noise dominated data is calculated using 1-second bins in cleaned event files. If a bin has >2000 counts, and if more than 50% of those come from <1% of pixels, then it is considered to be noise-dominated and hence unusable.
| Quadrant | # 1 sec bins | Bins with >0 counts | Bins with >2000 counts | High rate bins dominated by noise | Noise dominated (total time) | Noise dominated (detector-on time) | Marked lightcurve |
|---|---|---|---|---|---|---|---|
| A | 7515 | 6221 | 3 | 3 | 0.04% | 0.05% | 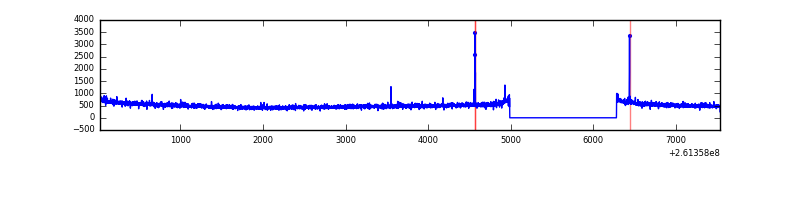 |
| B | 7515 | 6221 | 39 | 39 | 0.52% | 0.63% | 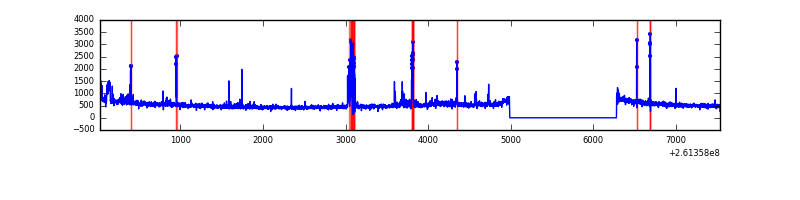 |
| C | 7515 | 6221 | 0 | 0 | 0.00% | 0.00% | 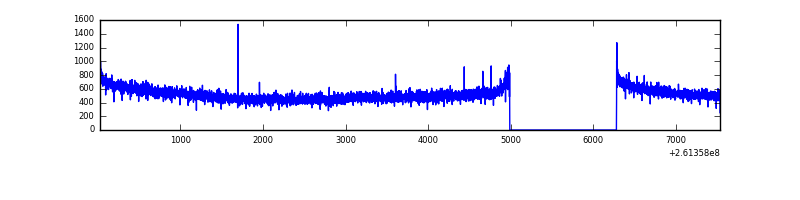 |
| D | 7515 | 6221 | 445 | 445 | 5.92% | 7.15% | 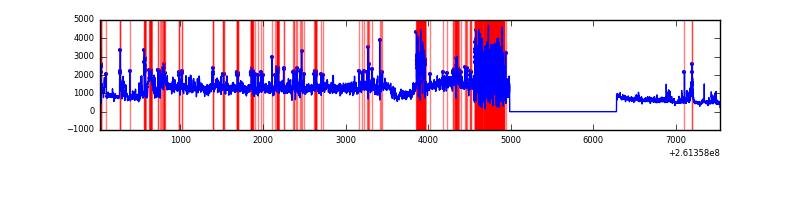 |
Top three noisy pixels from each quadrant. If the there are fewer than three noisy pixels in the level2.evt file, extra rows are filled as -1
| Pixel properties | Quadrant properties | ||||||
|---|---|---|---|---|---|---|---|
| Quadrant | DetID | PixID | Counts | Sigma | Mean | Median | Sigma |
| A | 9 | 143 | 14046 | 81.77 | 798 | 784 | 162.2 |
| A | 1 | 162 | 12540 | 72.48 | 798 | 784 | 162.2 |
| A | 15 | 69 | 10141 | 57.69 | 798 | 784 | 162.2 |
| B | 3 | 64 | 172200 | 1133.79 | 798 | 780 | 151.2 |
| B | 0 | 219 | 77209 | 505.51 | 798 | 780 | 151.2 |
| B | 4 | 173 | 38312 | 248.24 | 798 | 780 | 151.2 |
| C | 3 | 233 | 117844 | 639.85 | 791 | 799 | 182.9 |
| C | 13 | 61 | 5736 | 26.99 | 791 | 799 | 182.9 |
| C | 12 | 4 | 3423 | 14.34 | 791 | 799 | 182.9 |
| D | 5 | 222 | 4279577 | 23946.53 | 743 | 725 | 178.7 |
| D | 13 | 168 | 338298 | 1889.22 | 743 | 725 | 178.7 |
| D | 1 | 52 | 253412 | 1414.16 | 743 | 725 | 178.7 |
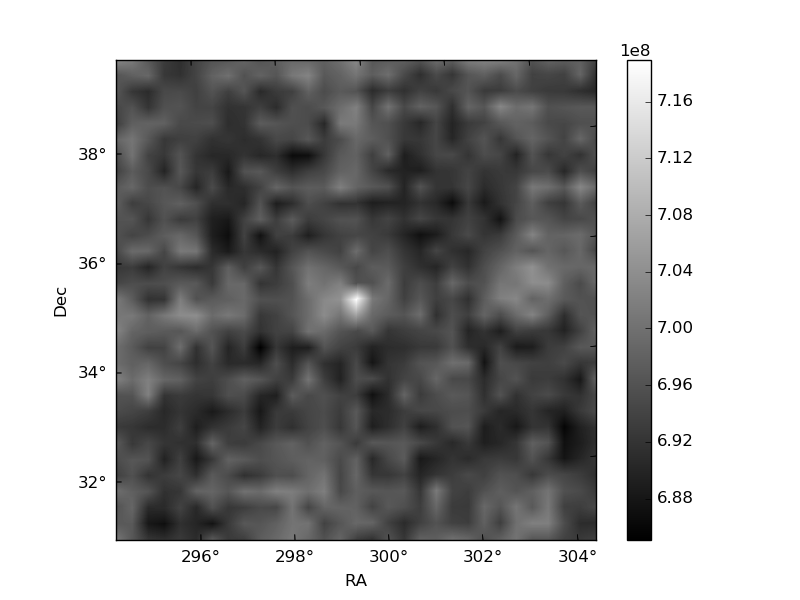
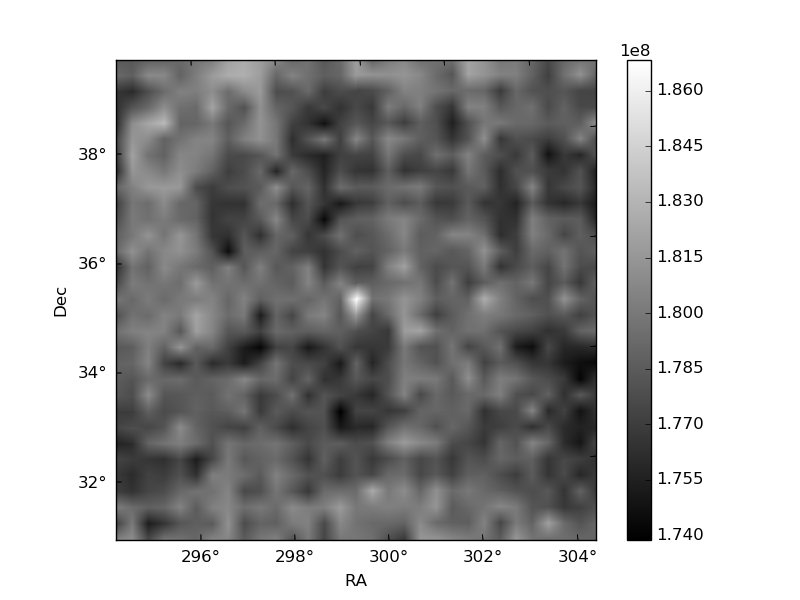
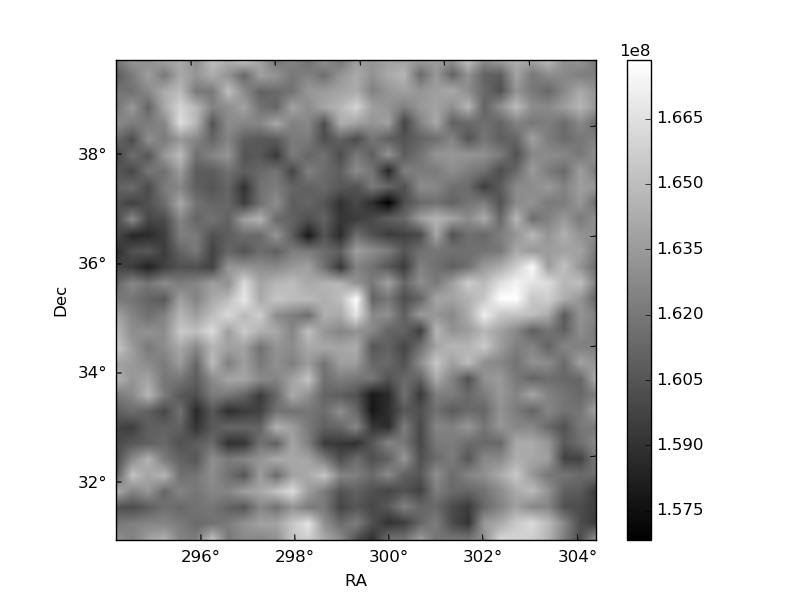
Histogram calculated using DETX and DETY for each event in the final _common_clean file
| Quadrant A | 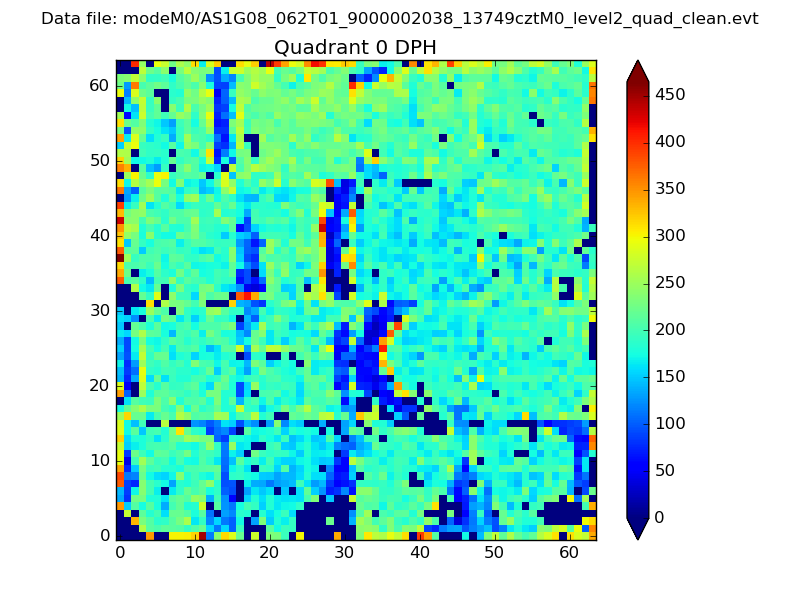 |
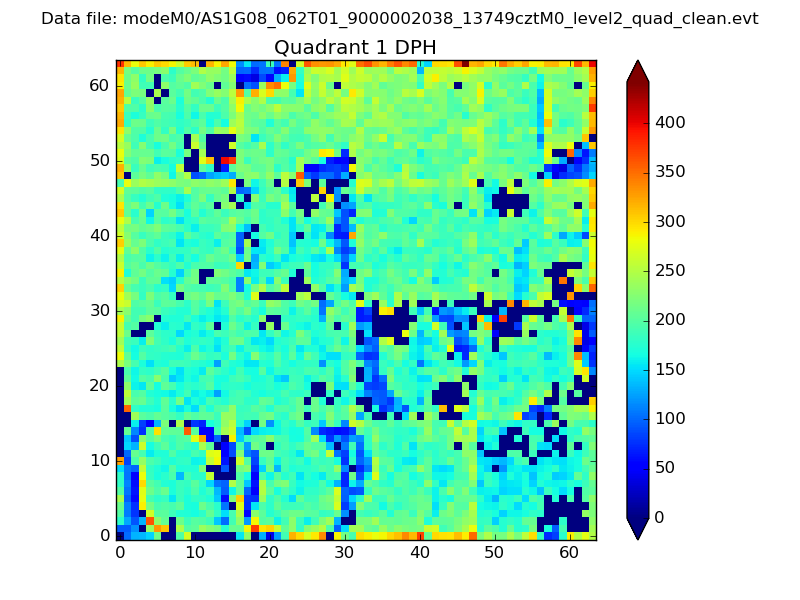 |
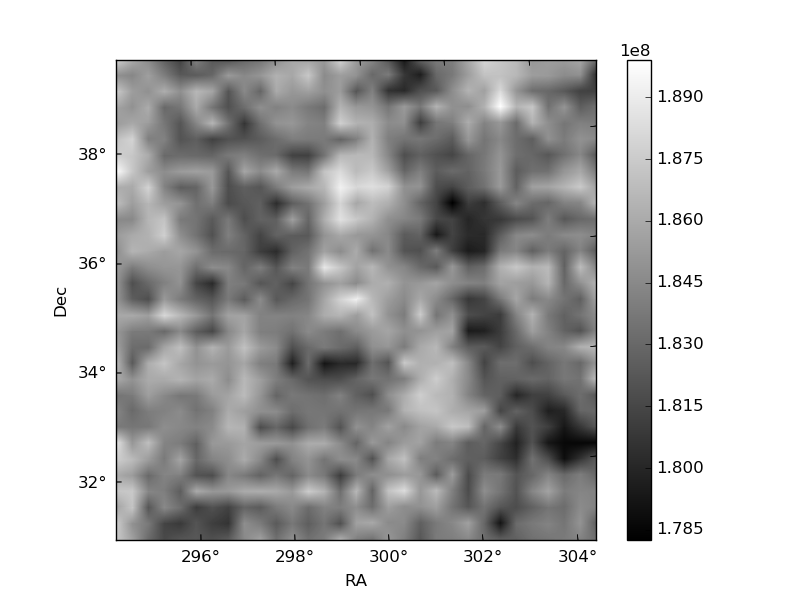
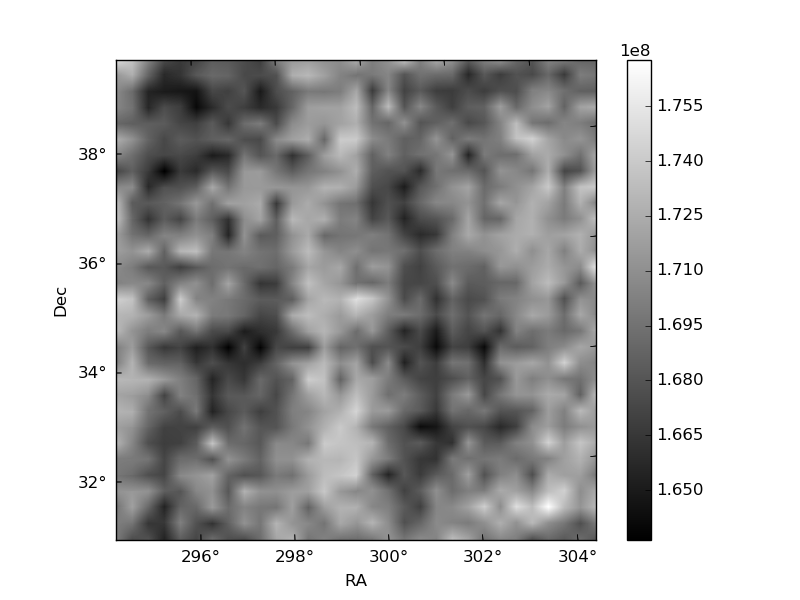
Quadrant B |
|---|---|---|---|
| Quadrant D | 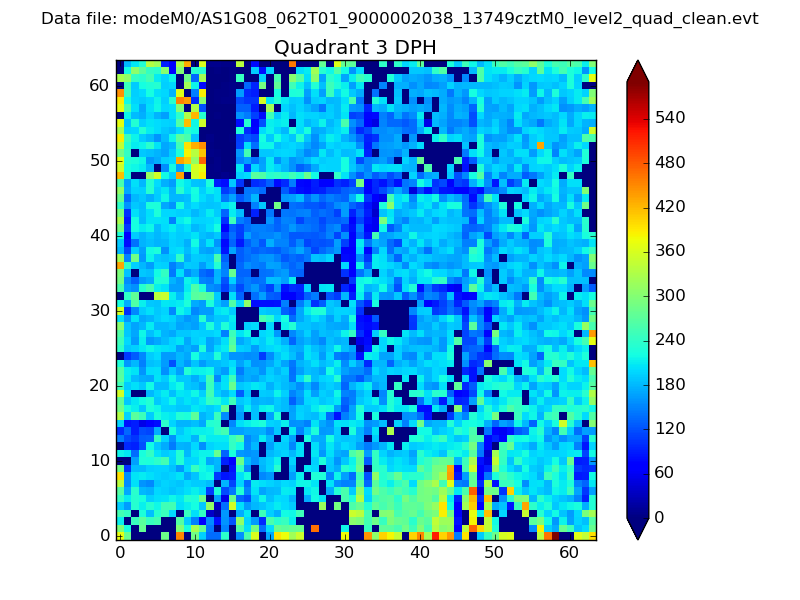 |
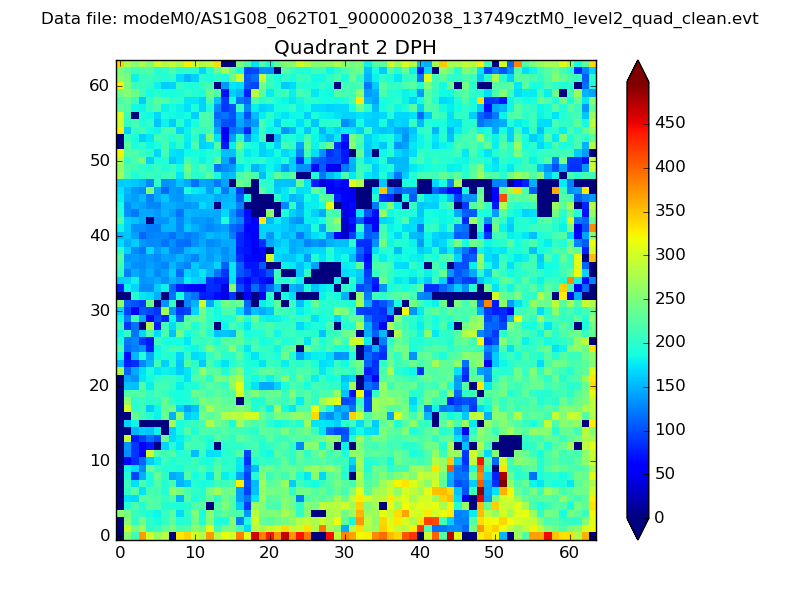 |
Quadrant C |
| Plot type | Count rate plots | Images |
|---|---|---|
| Comparison with Poisson distribution Blue bars denote a histogram of data divided into 1 sec bins. Red curve is a Poisson curve with rate = median count rate of data. |
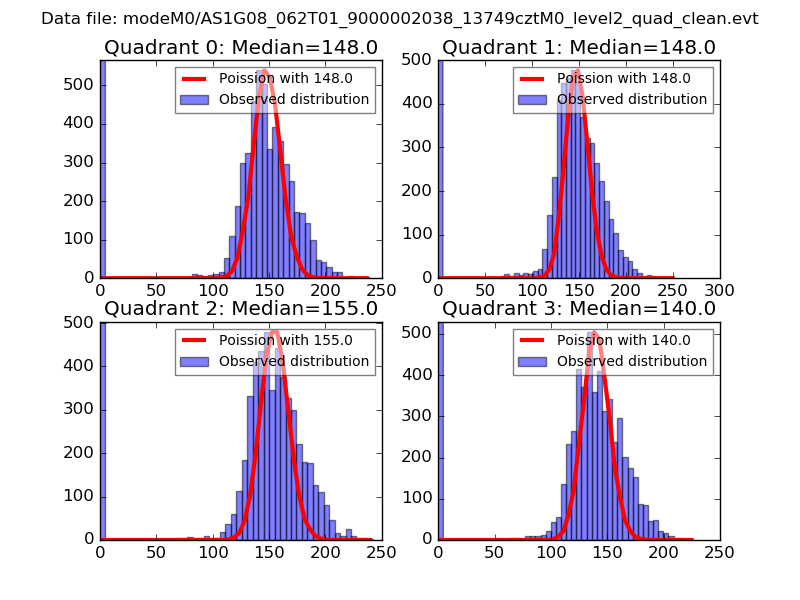 |
 |
| Quadrant-wise count rates Data is divided into 100 sec bins |
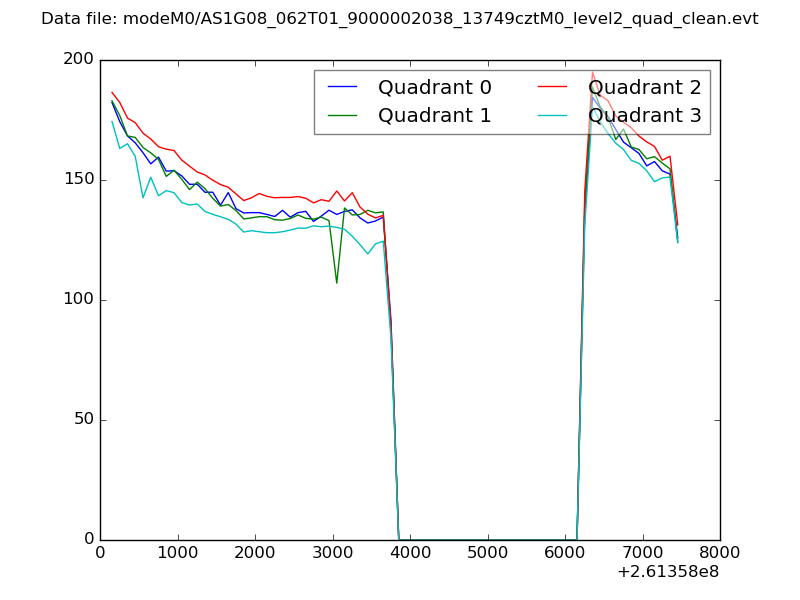 |
|
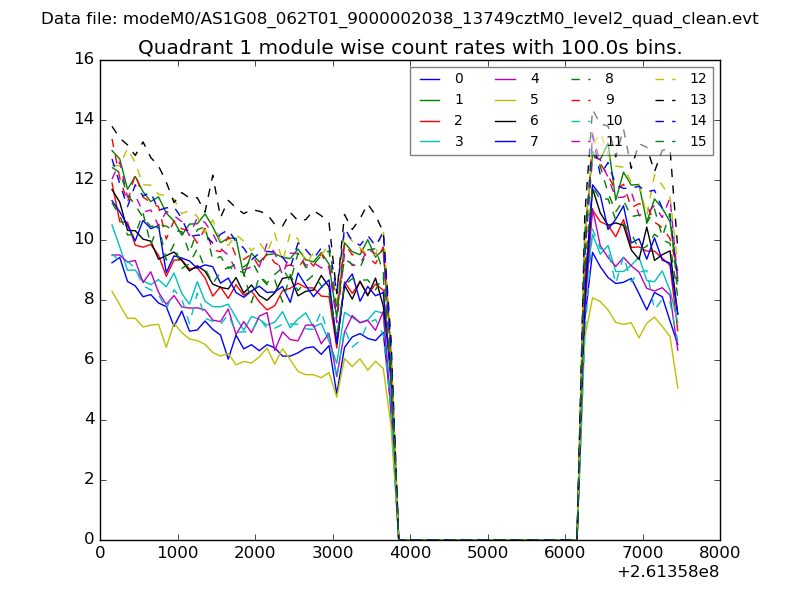
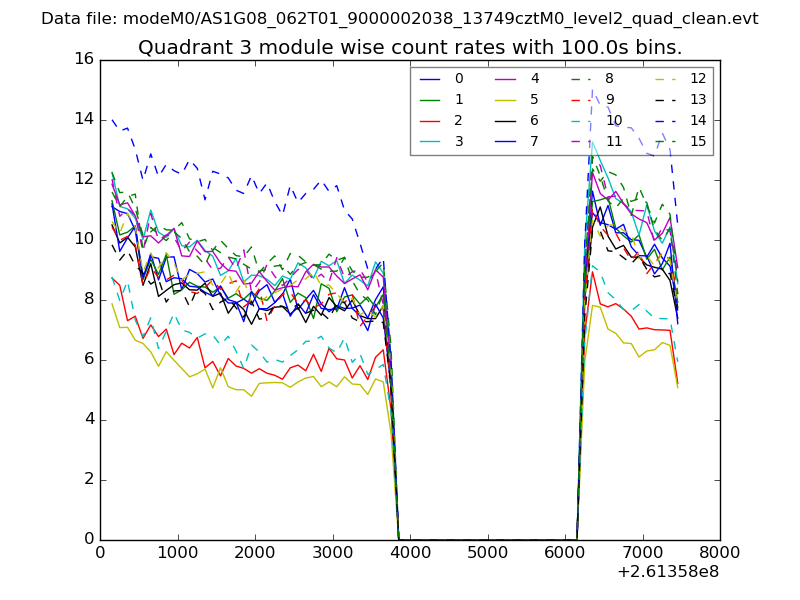
| Module-wise count rates for Quadrant A Data is divided into 100 sec bins |
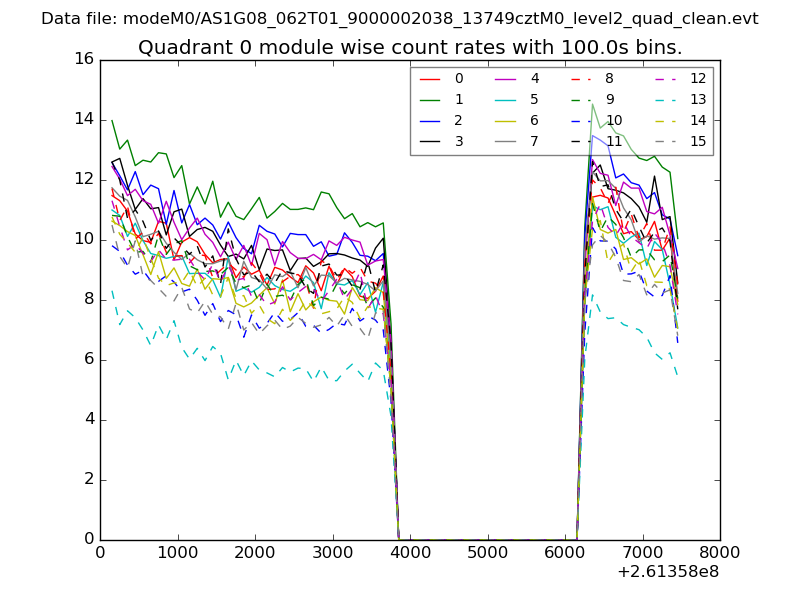 |
 |
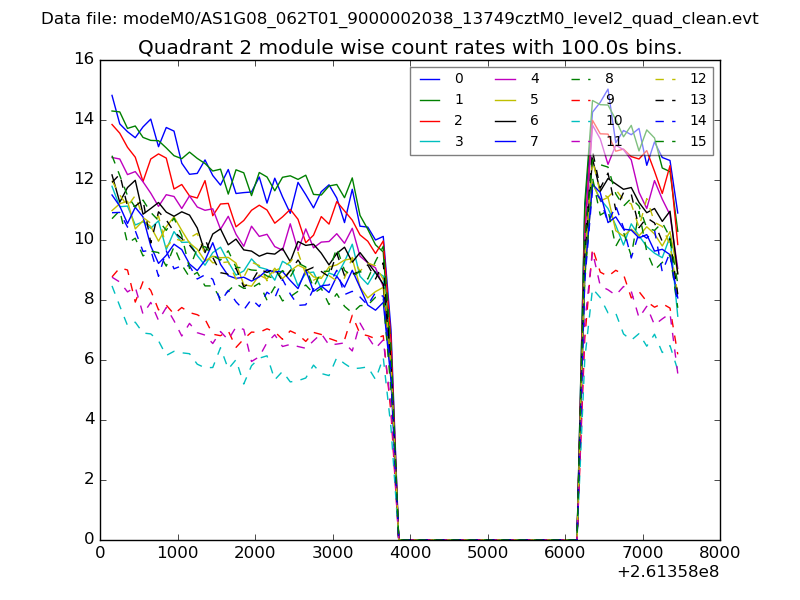
| Module-wise count rates for Quadrant B Data is divided into 100 sec bins |
 |
 |
| Module-wise count rates for Quadrant C Data is divided into 100 sec bins |
 |
 |
| Module-wise count rates for Quadrant D Data is divided into 100 sec bins |
 |
 |
| Parameter | Plot |
|---|---|
| CZT HV Monitor | 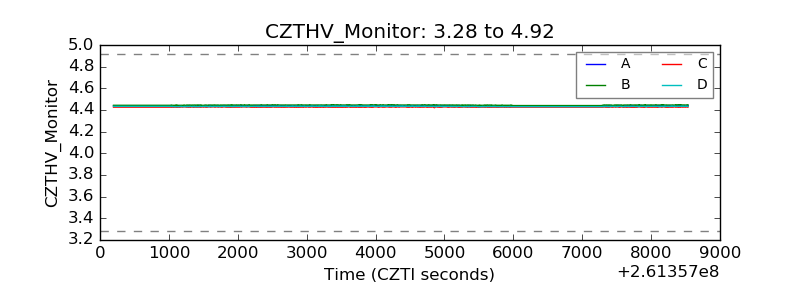 |
| D_VDD | 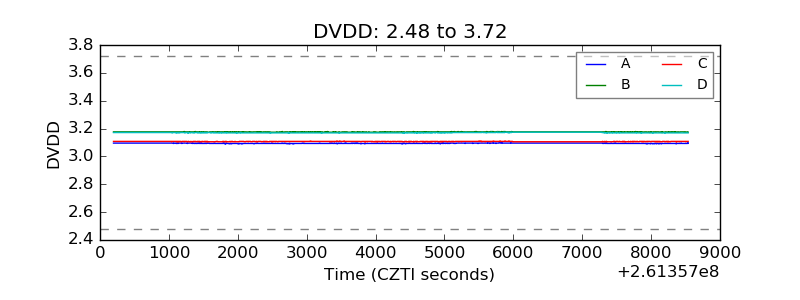 |
| Temperature 1 | 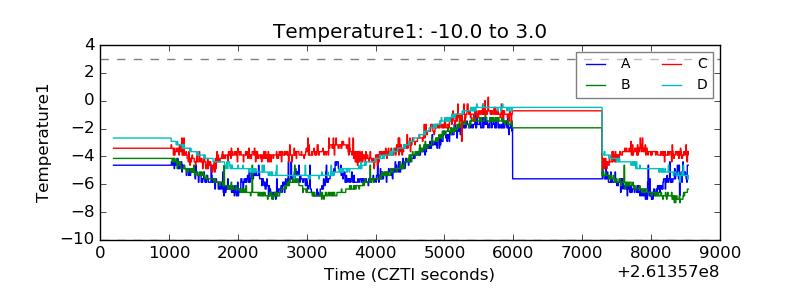 |
| Veto HV Monitor | 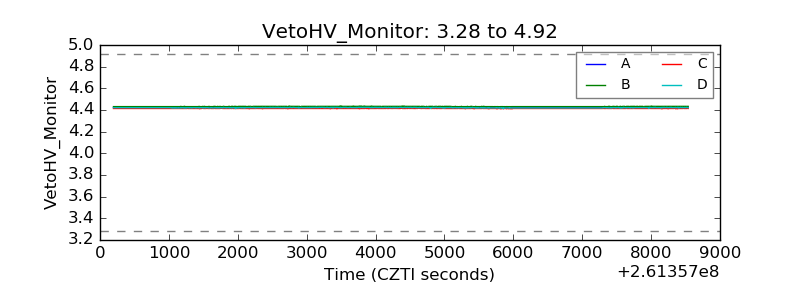 |
| Veto LLD | 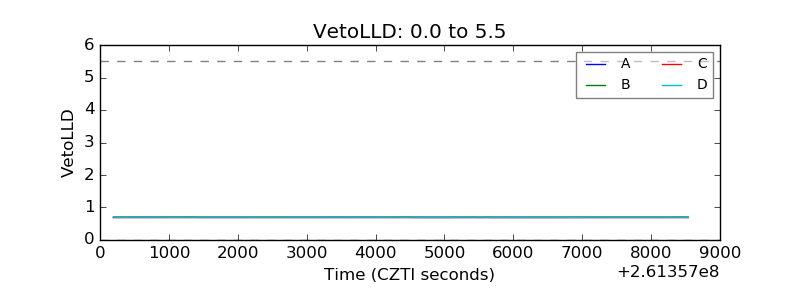 |
| Alpha Counter | 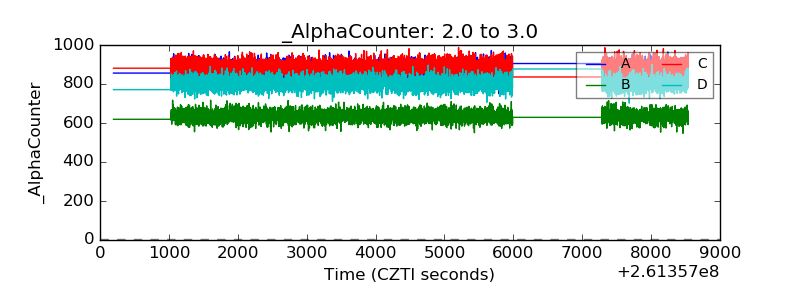 |
| _CPM_Rate | 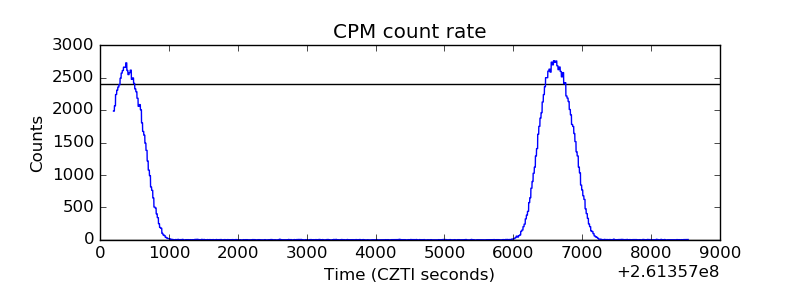 |
| CZT Counter | 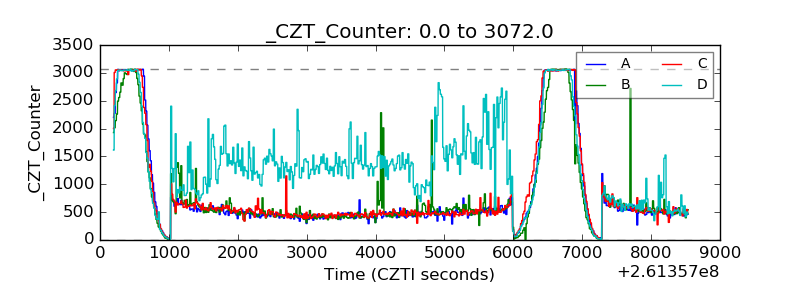 |
| +2.5 Volts monitor | 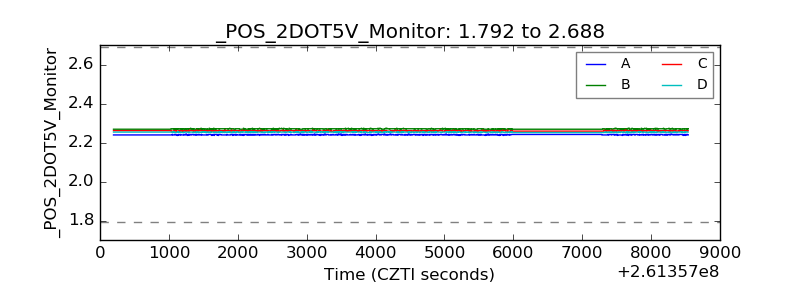 |
| +5 Volts monitor | 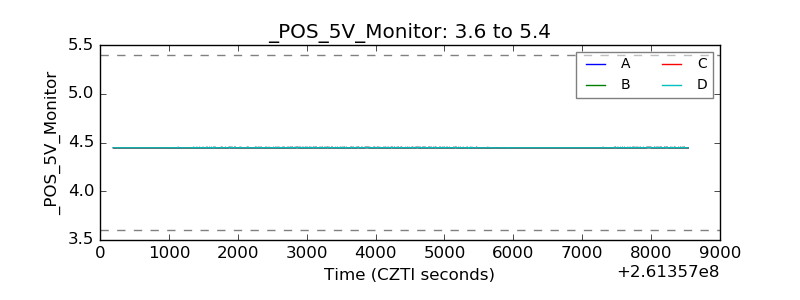 |
| _ROLL_ROT | 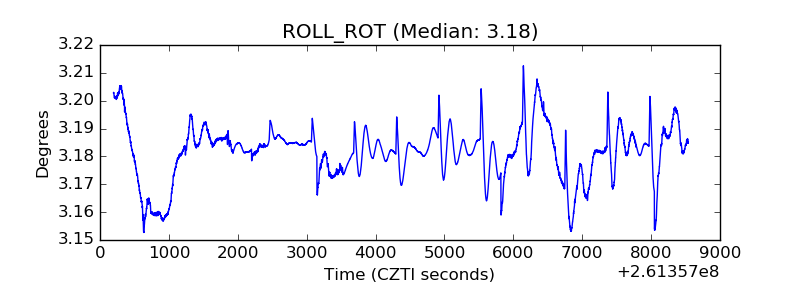 |
| _Roll_DEC | 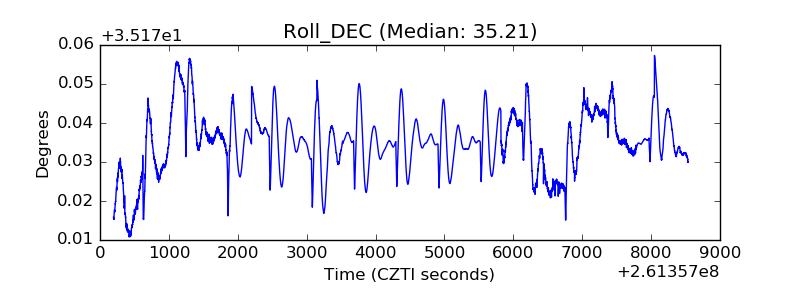 |
| _Roll_RA | 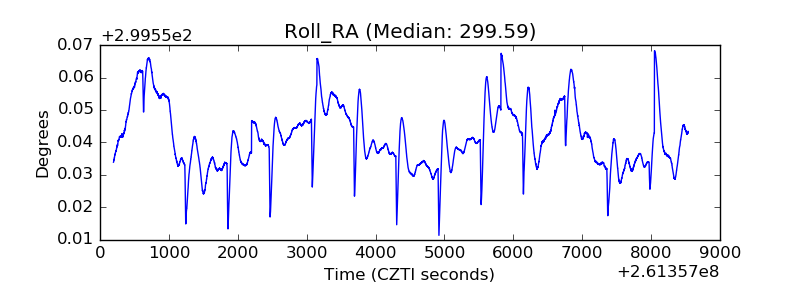 |
| Veto Counter | 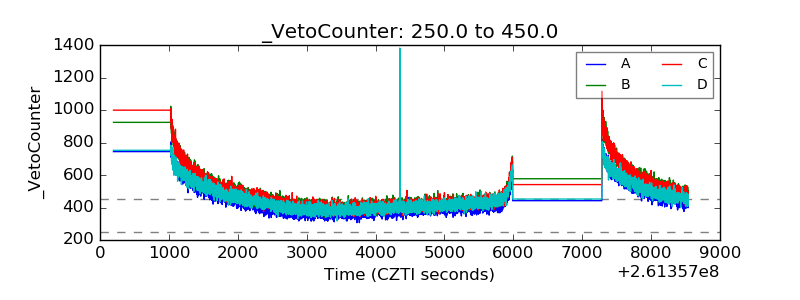 |