| Param | Original file | Final file |
|---|---|---|
| Filename | modeM0/AS1G08_062T01_9000002038_13753cztM0_level2.evt | modeM0/AS1G08_062T01_9000002038_13753cztM0_level2_quad_clean.evt |
| Size (bytes) | 495,190,080 | 95,984,640 |
| Size | 472.3 MB | 91.5 MB |
| Events in quadrant A | 3,141,014 | 608,186 |
| Events in quadrant B | 3,458,138 | 602,614 |
| Events in quadrant C | 3,177,950 | 632,263 |
| Events in quadrant D | 4,770,417 | 602,317 |
| Mode M9 | |||
|---|---|---|---|
| Quadrant | BADHDUFLAG | Total packets | Discarded packets |
| A | 0 | 8 | 0 |
| B | 0 | 8 | 0 |
| C | 0 | 8 | 0 |
| D | 0 | 8 | 0 |
| Mode M0 | |||
|---|---|---|---|
| Quadrant | BADHDUFLAG | Total packets | Discarded packets |
| A | 0 | 13591 | 2 |
| B | 0 | 14604 | 1 |
| C | 0 | 13577 | 1 |
| D | 0 | 18516 | 1 |
| Mode SS | |||
|---|---|---|---|
| Quadrant | BADHDUFLAG | Total packets | Discarded packets |
| A | 0 | 134 | 0 |
| B | 0 | 134 | 0 |
| C | 0 | 134 | 0 |
| D | 0 | 134 | 0 |
| Quadrant | Total seconds | Saturated seconds | Saturation percentage |
|---|---|---|---|
| A | 6614 | 50 | 0.755972% |
| B | 6614 | 82 | 1.239794% |
| C | 6614 | 13 | 0.196553% |
| D | 6614 | 282 | 4.263683% |
Noise dominated data is calculated using 1-second bins in cleaned event files. If a bin has >2000 counts, and if more than 50% of those come from <1% of pixels, then it is considered to be noise-dominated and hence unusable.
| Quadrant | # 1 sec bins | Bins with >0 counts | Bins with >2000 counts | High rate bins dominated by noise | Noise dominated (total time) | Noise dominated (detector-on time) | Marked lightcurve |
|---|---|---|---|---|---|---|---|
| A | 7435 | 6616 | 1 | 1 | 0.01% | 0.02% | 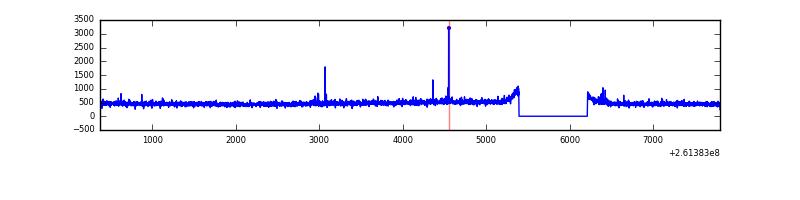 |
| B | 7435 | 6616 | 12 | 12 | 0.16% | 0.18% | 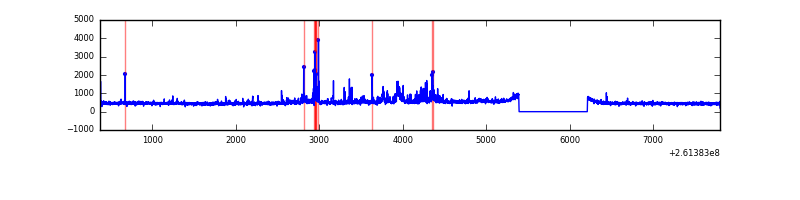 |
| C | 7435 | 6616 | 0 | 0 | 0.00% | 0.00% | 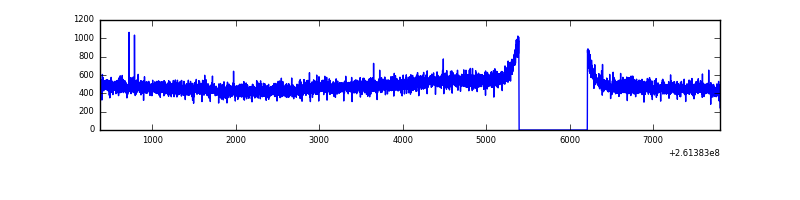 |
| D | 7435 | 6616 | 225 | 225 | 3.03% | 3.40% | 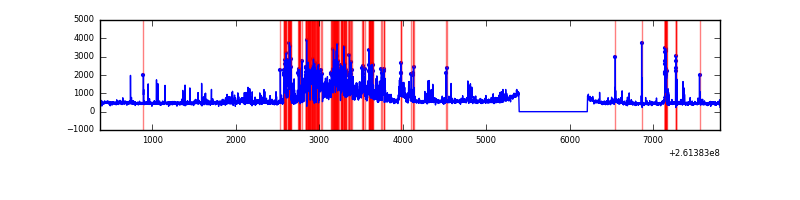 |
Top three noisy pixels from each quadrant. If the there are fewer than three noisy pixels in the level2.evt file, extra rows are filled as -1
| Pixel properties | Quadrant properties | ||||||
|---|---|---|---|---|---|---|---|
| Quadrant | DetID | PixID | Counts | Sigma | Mean | Median | Sigma |
| A | 1 | 162 | 16950 | 98.45 | 805 | 790 | 164.1 |
| A | 0 | 23 | 8998 | 50.01 | 805 | 790 | 164.1 |
| A | 15 | 69 | 7790 | 42.65 | 805 | 790 | 164.1 |
| B | 0 | 219 | 116940 | 766.84 | 795 | 777 | 151.5 |
| B | 0 | 182 | 66090 | 431.16 | 795 | 777 | 151.5 |
| B | 4 | 173 | 61688 | 402.1 | 795 | 777 | 151.5 |
| C | 3 | 233 | 119735 | 649.8 | 784 | 789 | 183.0 |
| C | 13 | 61 | 5641 | 26.51 | 784 | 789 | 183.0 |
| C | 14 | 220 | 4397 | 19.71 | 784 | 789 | 183.0 |
| D | 5 | 222 | 1104288 | 5660.4 | 772 | 757 | 195.0 |
| D | 10 | 157 | 329736 | 1687.45 | 772 | 757 | 195.0 |
| D | 1 | 52 | 305096 | 1561.06 | 772 | 757 | 195.0 |
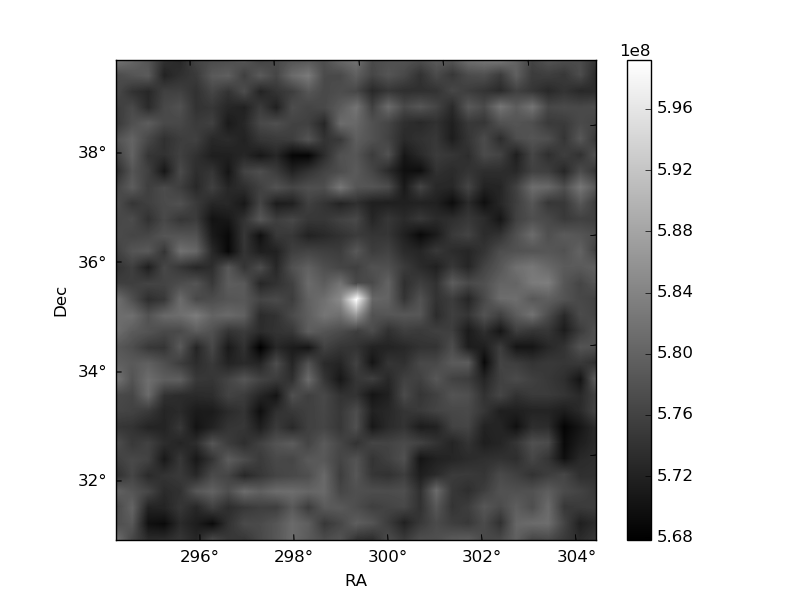
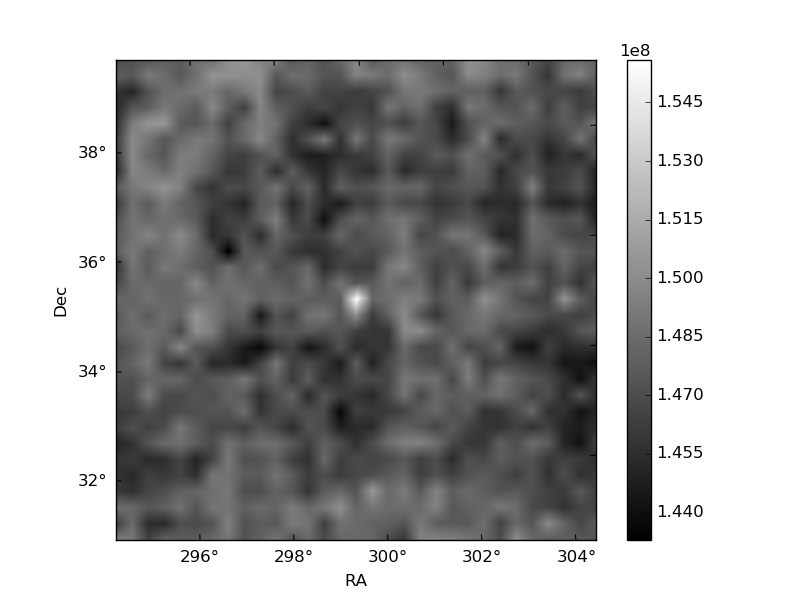
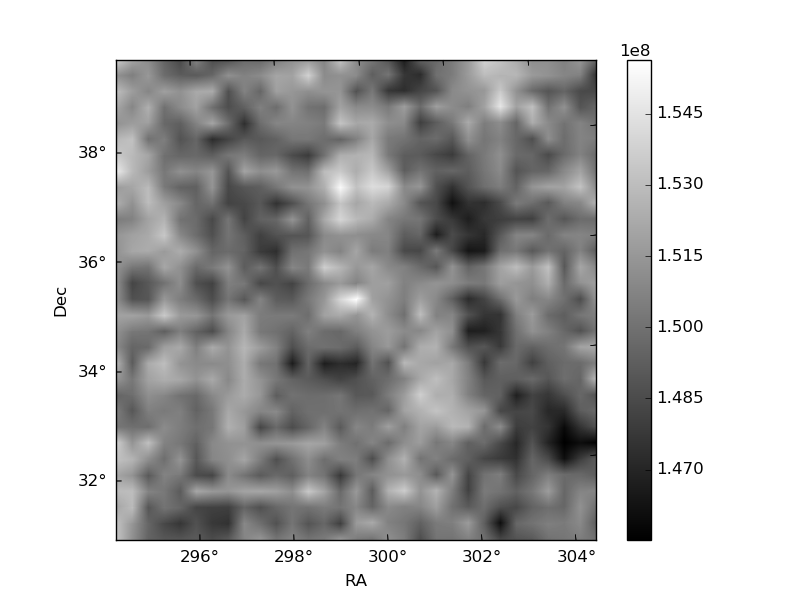
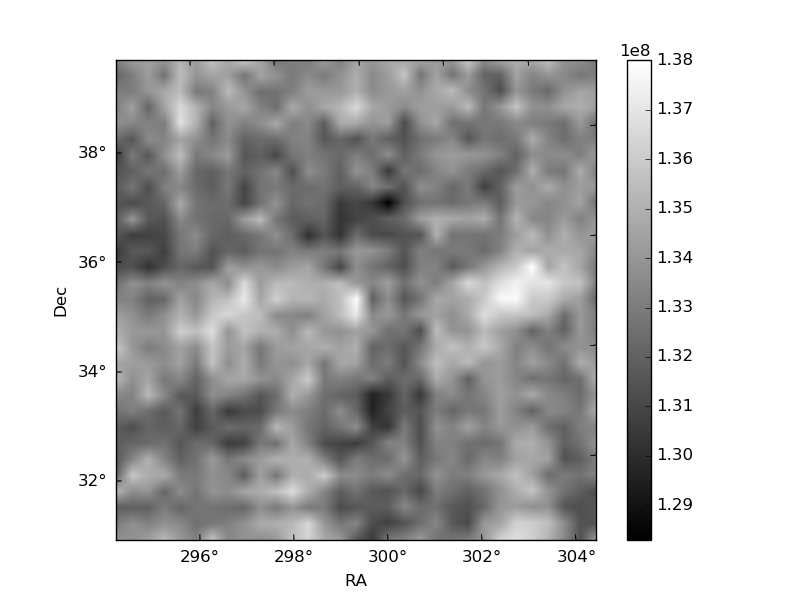
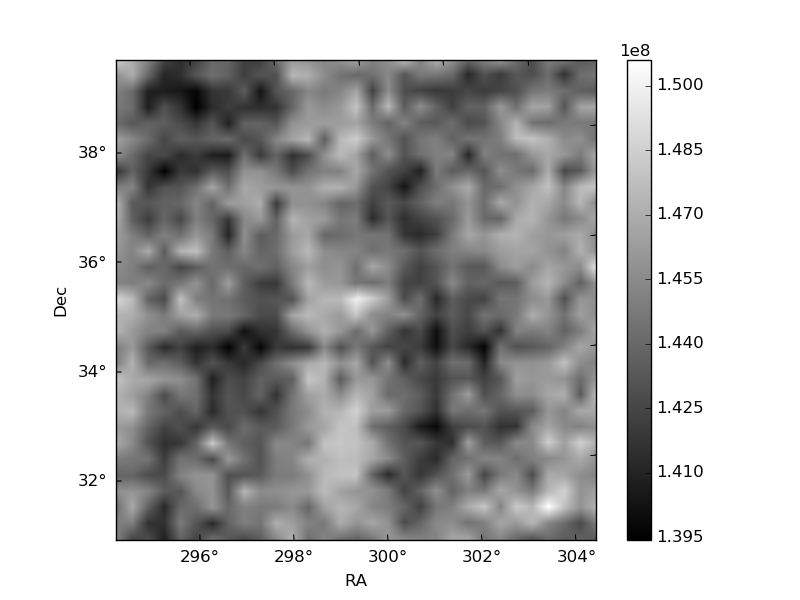
Histogram calculated using DETX and DETY for each event in the final _common_clean file
| Quadrant A | 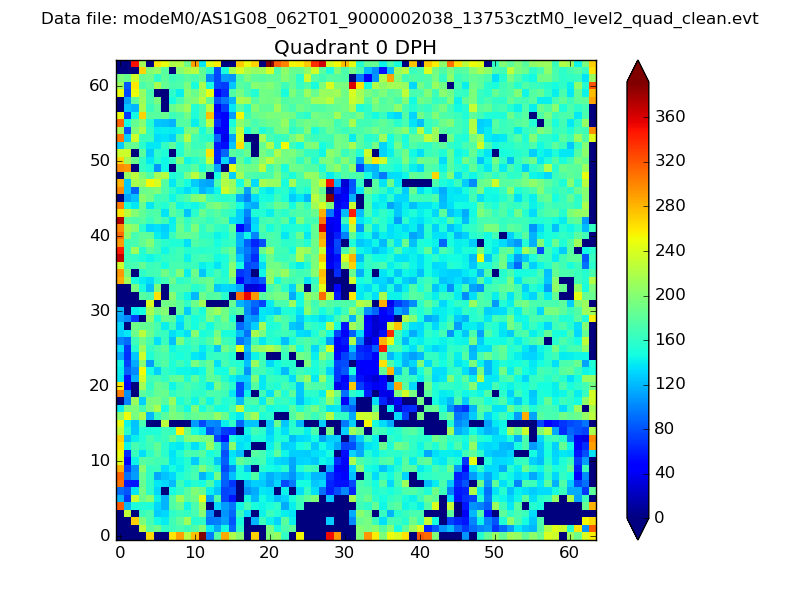 |
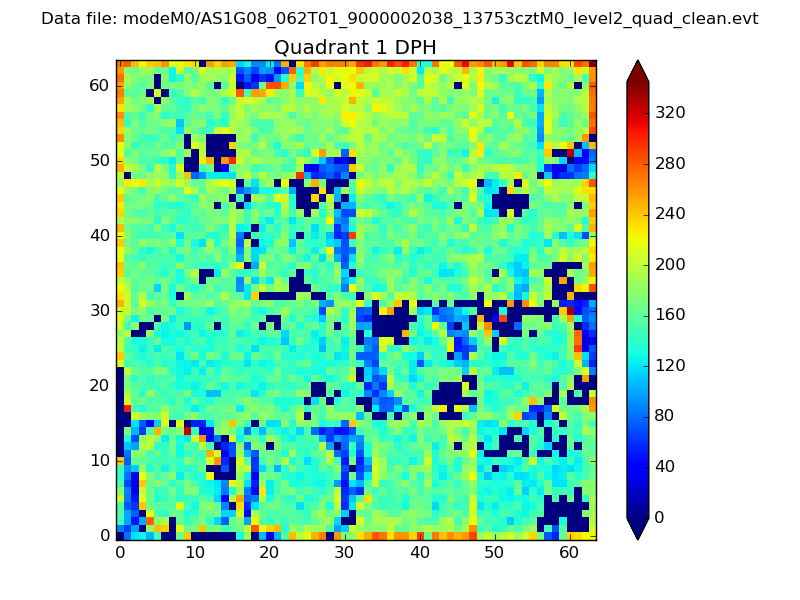 |
Quadrant B |
|---|---|---|---|
| Quadrant D | 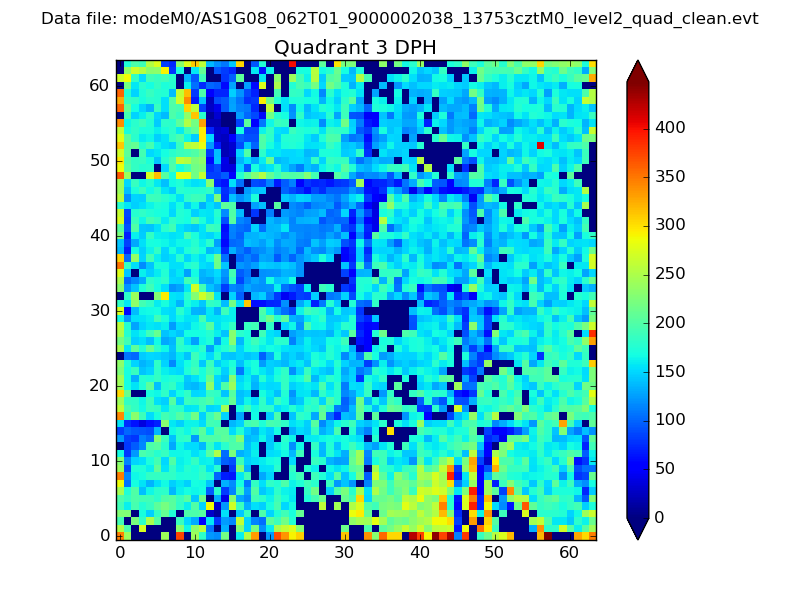 |
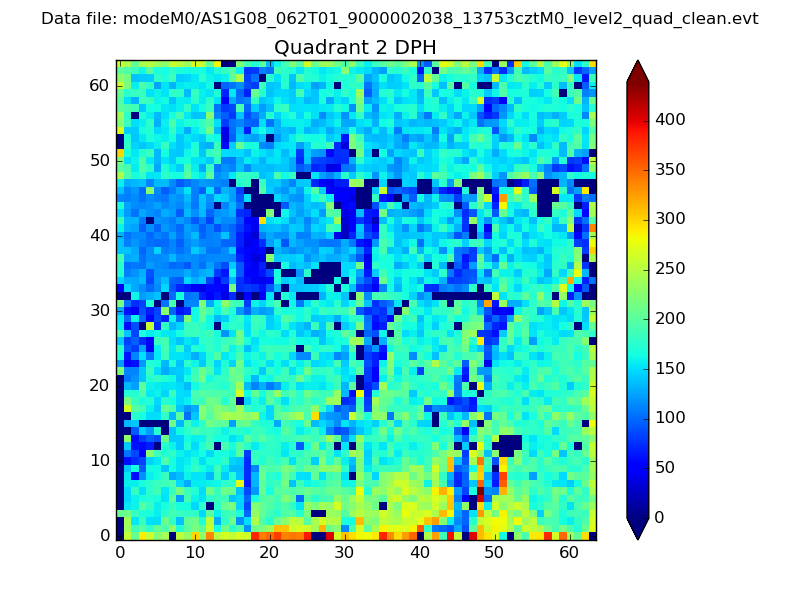 |
Quadrant C |
| Plot type | Count rate plots | Images |
|---|---|---|
| Comparison with Poisson distribution Blue bars denote a histogram of data divided into 1 sec bins. Red curve is a Poisson curve with rate = median count rate of data. |
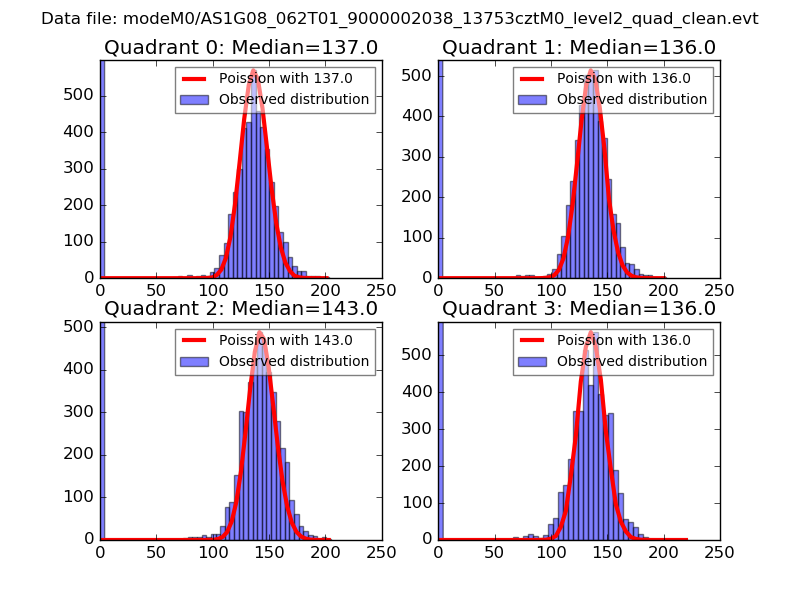 |
 |
| Quadrant-wise count rates Data is divided into 100 sec bins |
 |
|
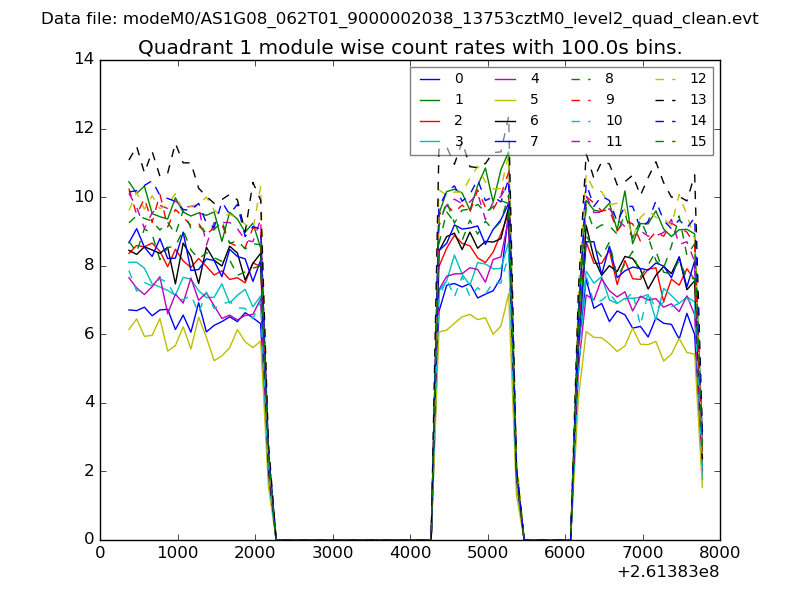
| Module-wise count rates for Quadrant A Data is divided into 100 sec bins |
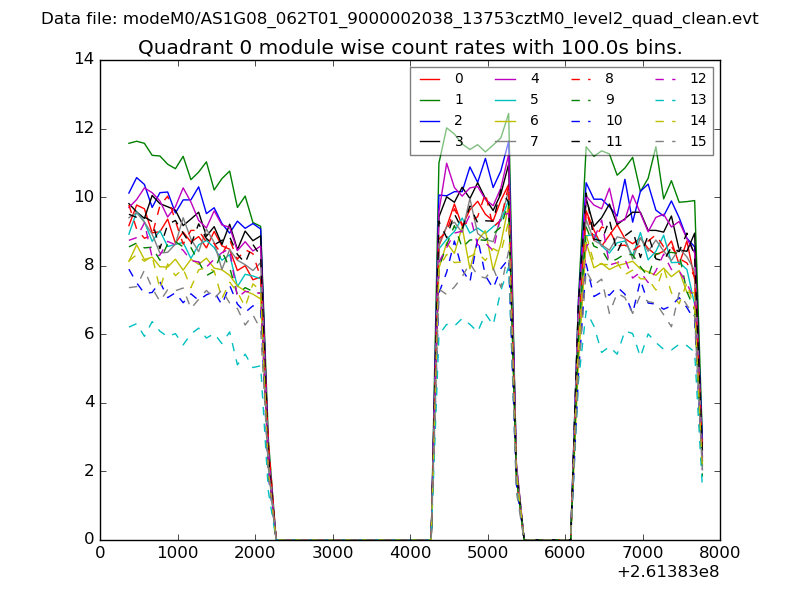 |
 |
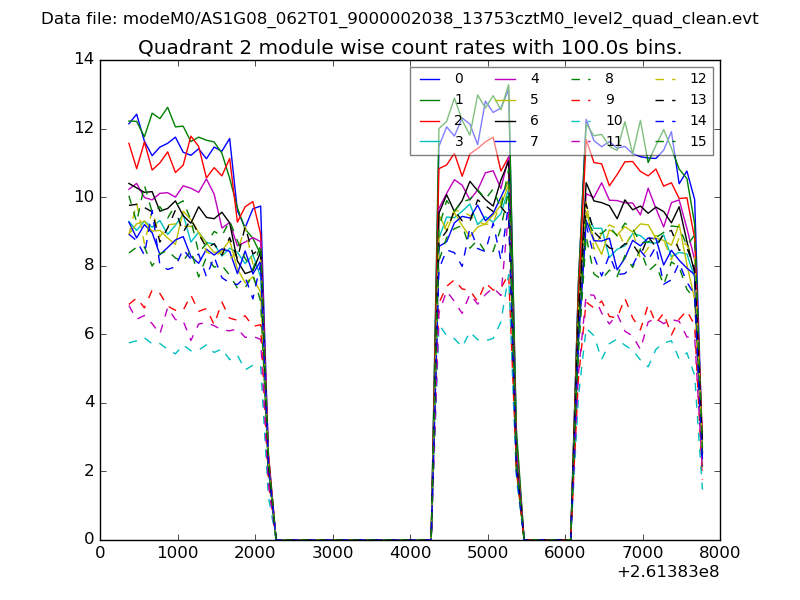
| Module-wise count rates for Quadrant B Data is divided into 100 sec bins |
 |
 |
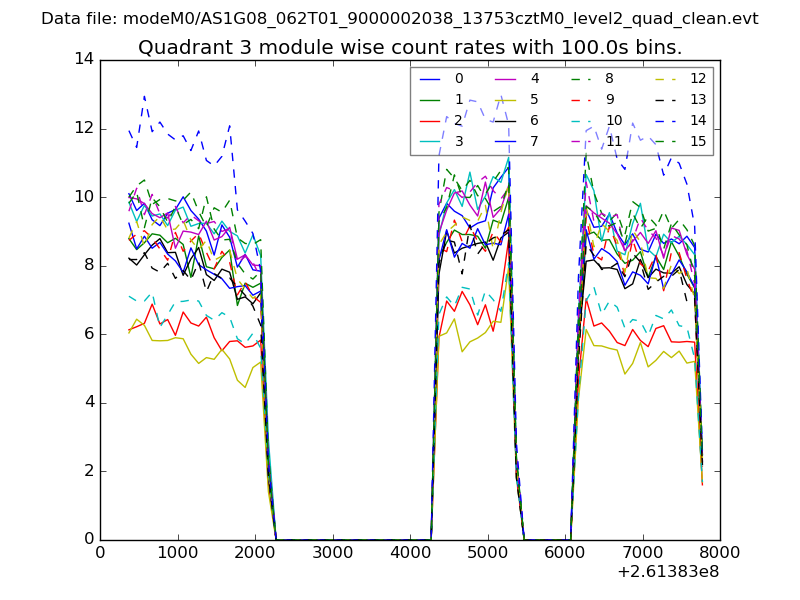
| Module-wise count rates for Quadrant C Data is divided into 100 sec bins |
 |
 |
| Module-wise count rates for Quadrant D Data is divided into 100 sec bins |
 |
 |
| Parameter | Plot |
|---|---|
| CZT HV Monitor | 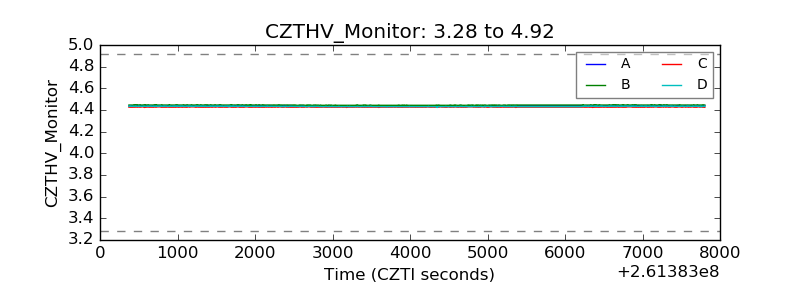 |
| D_VDD | 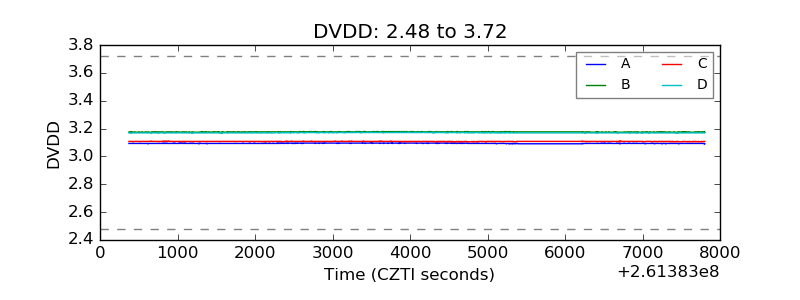 |
| Temperature 1 | 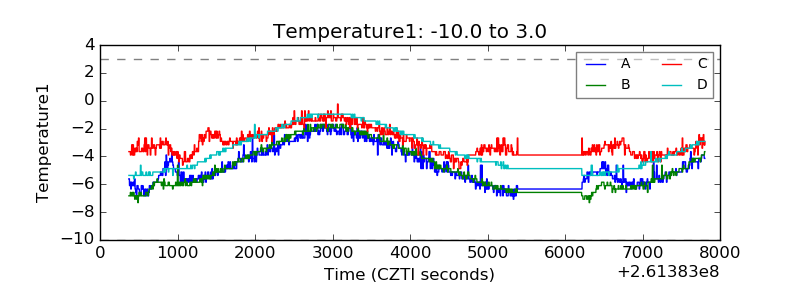 |
| Veto HV Monitor | 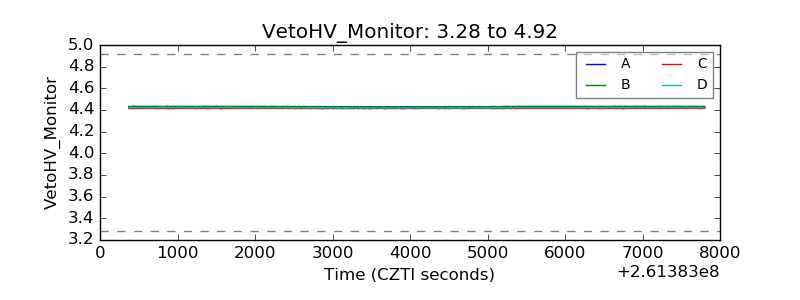 |
| Veto LLD | 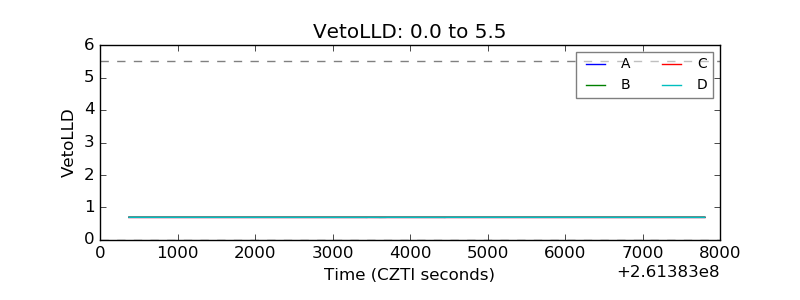 |
| Alpha Counter |  |
| _CPM_Rate | 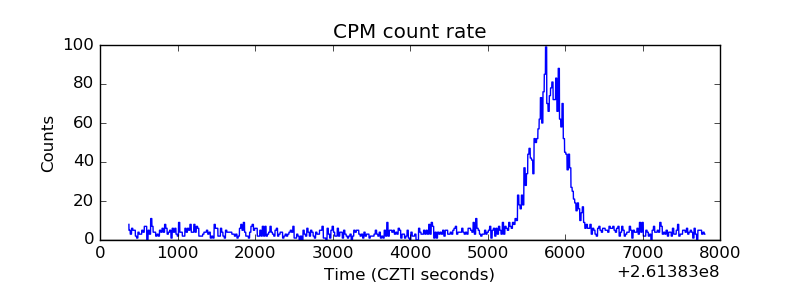 |
| CZT Counter | 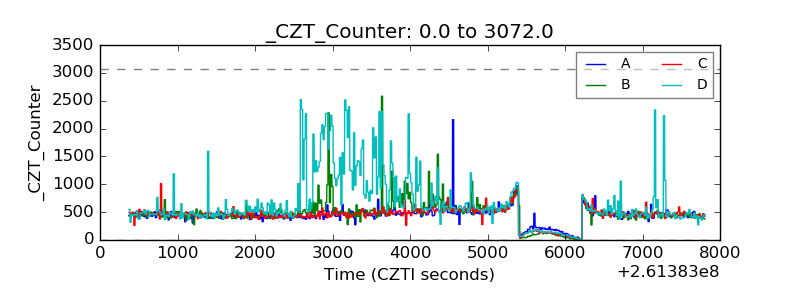 |
| +2.5 Volts monitor |  |
| +5 Volts monitor |  |
| _ROLL_ROT | 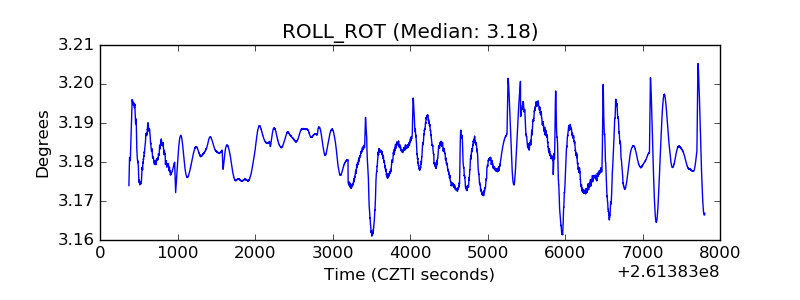 |
| _Roll_DEC | 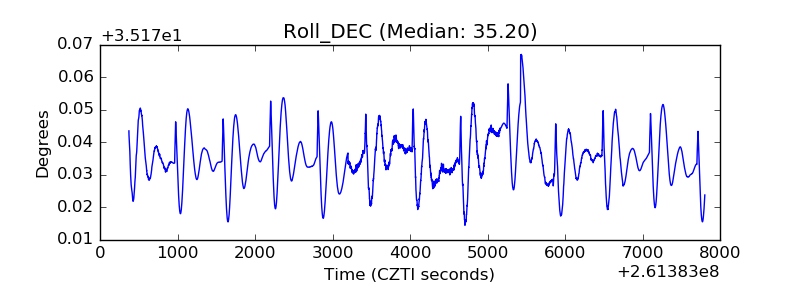 |
| _Roll_RA | 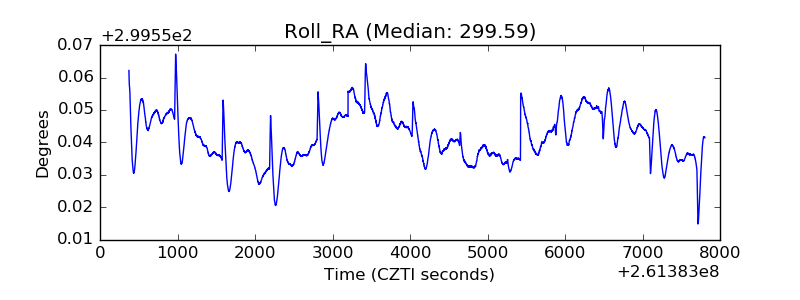 |
| Veto Counter | 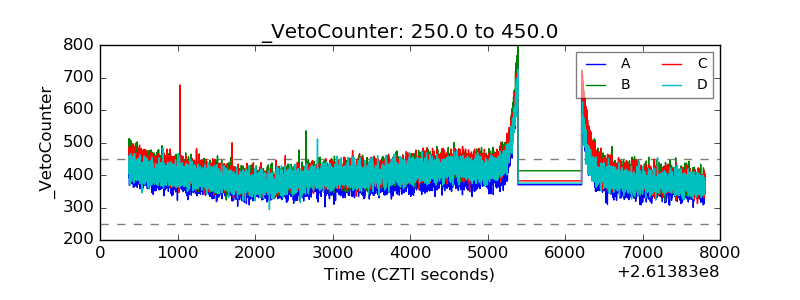 |