| Param | Original file | Final file |
|---|---|---|
| Filename | modeM0/AS1G08_062T01_9000002038_13754cztM0_level2.evt | modeM0/AS1G08_062T01_9000002038_13754cztM0_level2_quad_clean.evt |
| Size (bytes) | 474,036,480 | 91,906,560 |
| Size | 452.1 MB | 87.6 MB |
| Events in quadrant A | 3,156,299 | 578,512 |
| Events in quadrant B | 3,300,148 | 575,606 |
| Events in quadrant C | 3,169,916 | 605,529 |
| Events in quadrant D | 4,285,688 | 567,515 |
| Mode M9 | |||
|---|---|---|---|
| Quadrant | BADHDUFLAG | Total packets | Discarded packets |
| A | 0 | 3 | 0 |
| B | 0 | 3 | 0 |
| C | 0 | 3 | 0 |
| D | 0 | 3 | 0 |
| Mode M0 | |||
|---|---|---|---|
| Quadrant | BADHDUFLAG | Total packets | Discarded packets |
| A | 0 | 13632 | 3 |
| B | 0 | 13876 | 2 |
| C | 0 | 13490 | 2 |
| D | 0 | 17064 | 2 |
| Mode SS | |||
|---|---|---|---|
| Quadrant | BADHDUFLAG | Total packets | Discarded packets |
| A | 0 | 134 | 0 |
| B | 0 | 134 | 0 |
| C | 0 | 134 | 0 |
| D | 0 | 134 | 0 |
| Quadrant | Total seconds | Saturated seconds | Saturation percentage |
|---|---|---|---|
| A | 6533 | 154 | 2.357263% |
| B | 6533 | 155 | 2.372570% |
| C | 6533 | 86 | 1.316394% |
| D | 6533 | 356 | 5.449258% |
Noise dominated data is calculated using 1-second bins in cleaned event files. If a bin has >2000 counts, and if more than 50% of those come from <1% of pixels, then it is considered to be noise-dominated and hence unusable.
| Quadrant | # 1 sec bins | Bins with >0 counts | Bins with >2000 counts | High rate bins dominated by noise | Noise dominated (total time) | Noise dominated (detector-on time) | Marked lightcurve |
|---|---|---|---|---|---|---|---|
| A | 6849 | 6536 | 5 | 5 | 0.07% | 0.08% | 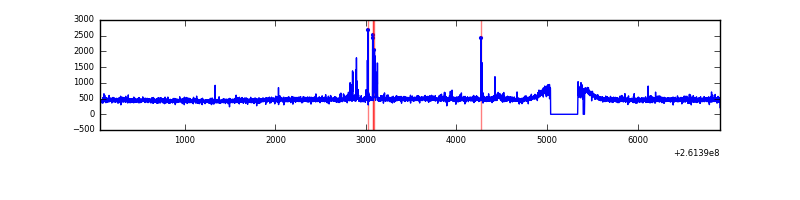 |
| B | 6849 | 6536 | 11 | 11 | 0.16% | 0.17% | 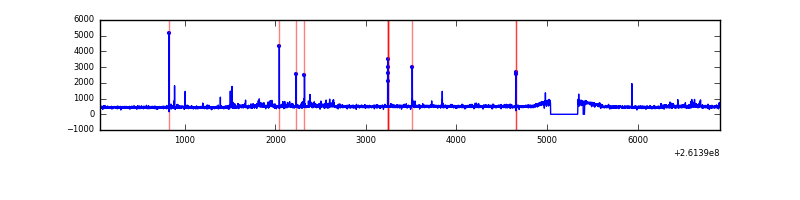 |
| C | 6849 | 6536 | 0 | 0 | 0.00% | 0.00% | 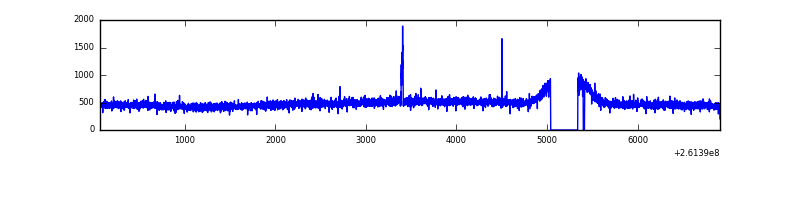 |
| D | 6849 | 6536 | 192 | 192 | 2.80% | 2.94% | 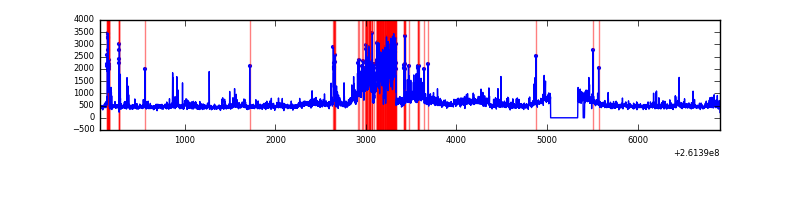 |
Top three noisy pixels from each quadrant. If the there are fewer than three noisy pixels in the level2.evt file, extra rows are filled as -1
| Pixel properties | Quadrant properties | ||||||
|---|---|---|---|---|---|---|---|
| Quadrant | DetID | PixID | Counts | Sigma | Mean | Median | Sigma |
| A | 15 | 69 | 57283 | 346.99 | 796 | 778 | 162.8 |
| A | 1 | 162 | 13569 | 78.55 | 796 | 778 | 162.8 |
| A | 0 | 23 | 11535 | 66.06 | 796 | 778 | 162.8 |
| B | 4 | 173 | 75055 | 490.51 | 787 | 767 | 151.5 |
| B | 0 | 219 | 60168 | 392.22 | 787 | 767 | 151.5 |
| B | 3 | 209 | 29347 | 188.71 | 787 | 767 | 151.5 |
| C | 3 | 233 | 119368 | 653.55 | 777 | 778 | 181.5 |
| C | 14 | 220 | 19364 | 102.42 | 777 | 778 | 181.5 |
| C | 13 | 61 | 5615 | 26.65 | 777 | 778 | 181.5 |
| D | 5 | 222 | 933278 | 4595.87 | 764 | 748 | 202.9 |
| D | 1 | 52 | 345087 | 1697.04 | 764 | 748 | 202.9 |
| D | 13 | 249 | 55164 | 268.18 | 764 | 748 | 202.9 |
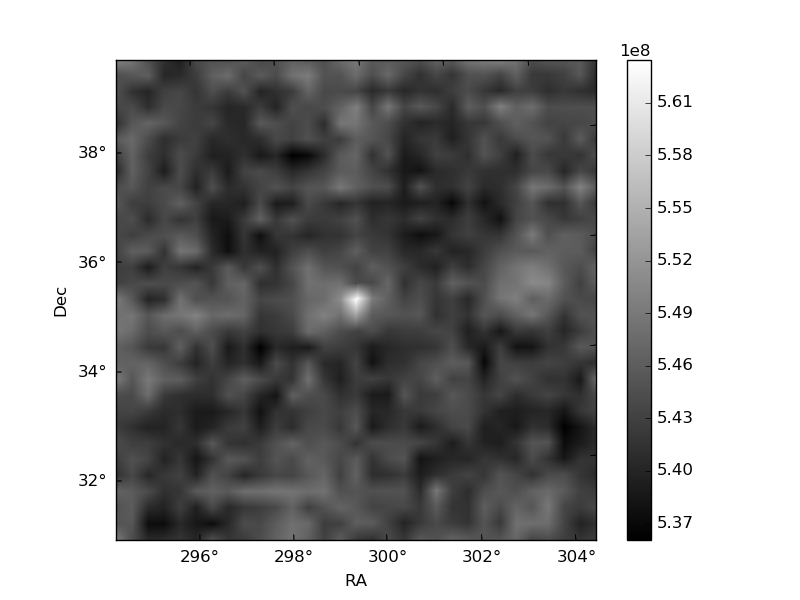
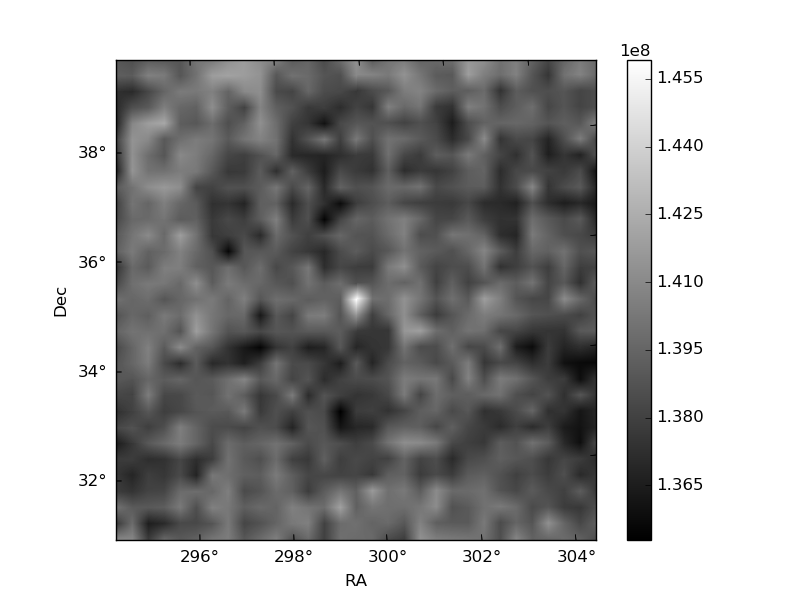
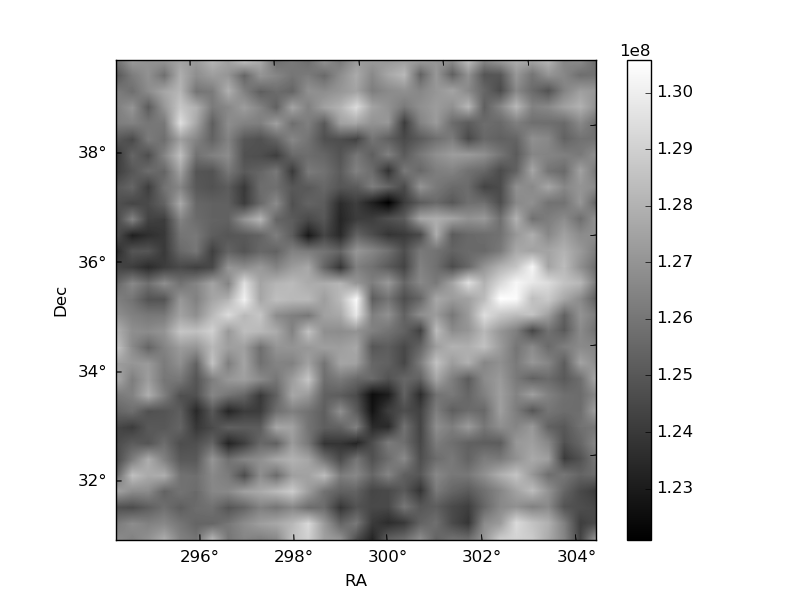
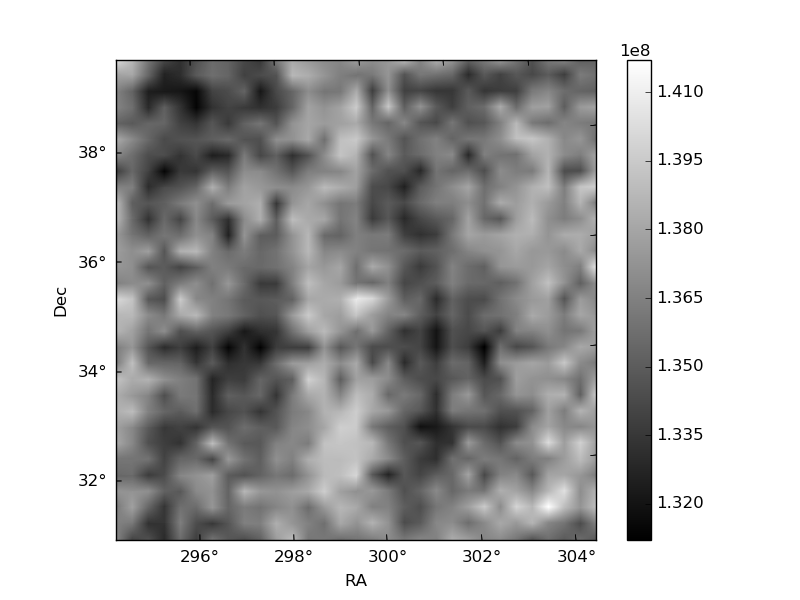
Histogram calculated using DETX and DETY for each event in the final _common_clean file
| Quadrant A | 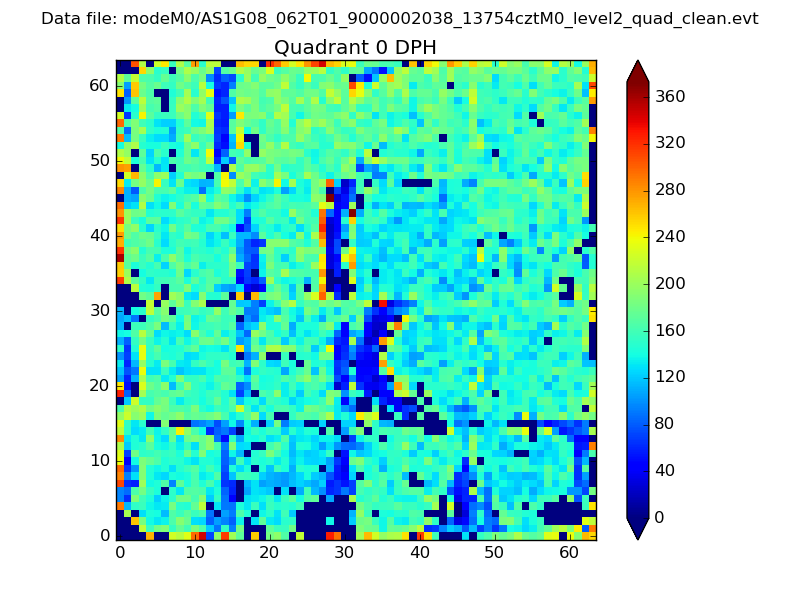 |
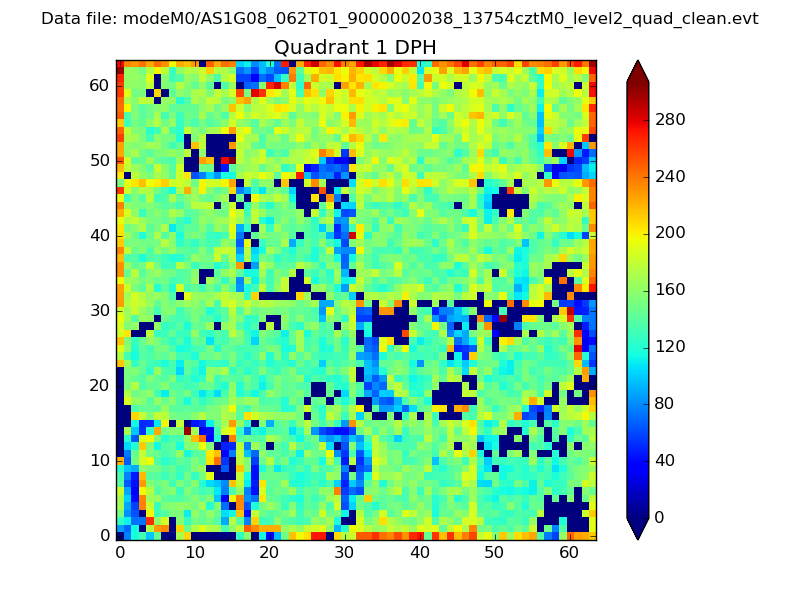 |
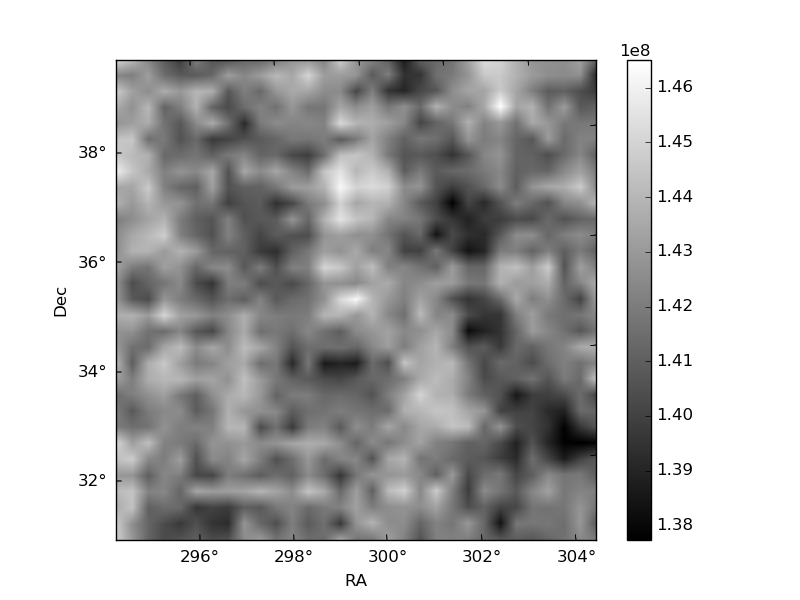
Quadrant B |
|---|---|---|---|
| Quadrant D | 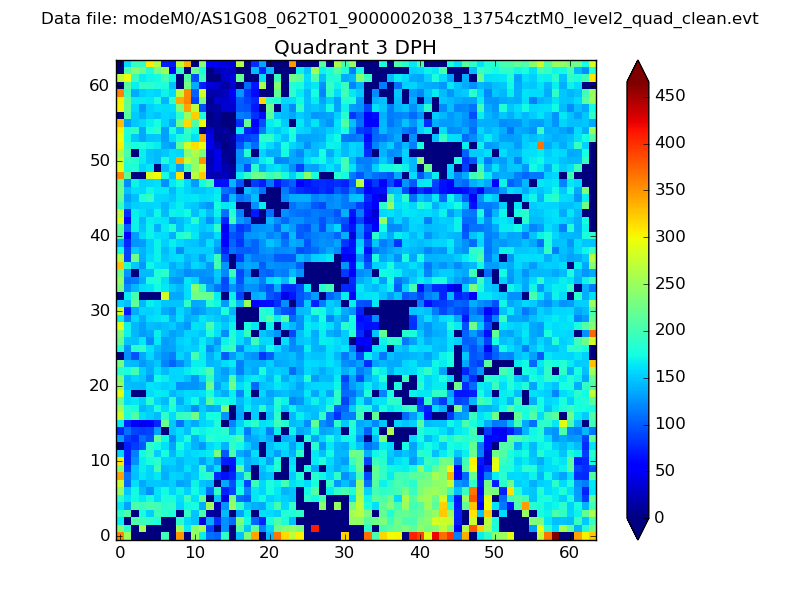 |
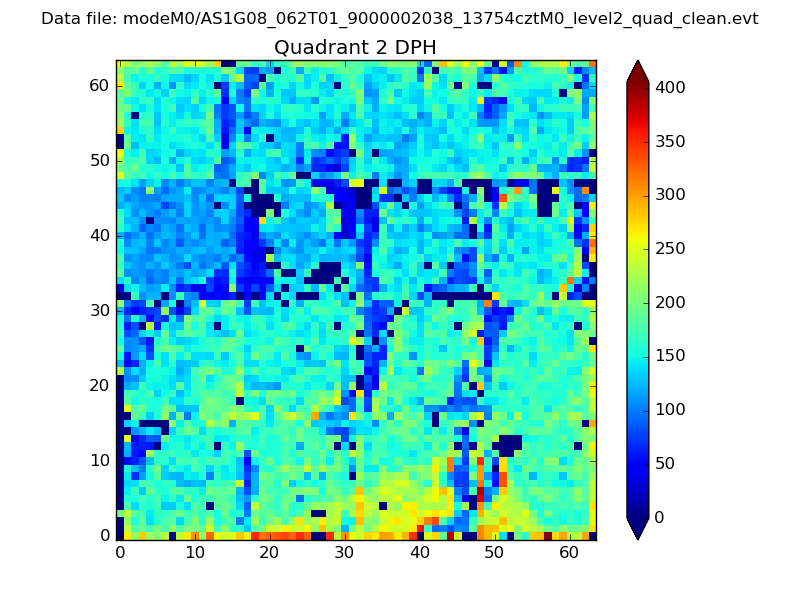 |
Quadrant C |
| Plot type | Count rate plots | Images |
|---|---|---|
| Comparison with Poisson distribution Blue bars denote a histogram of data divided into 1 sec bins. Red curve is a Poisson curve with rate = median count rate of data. |
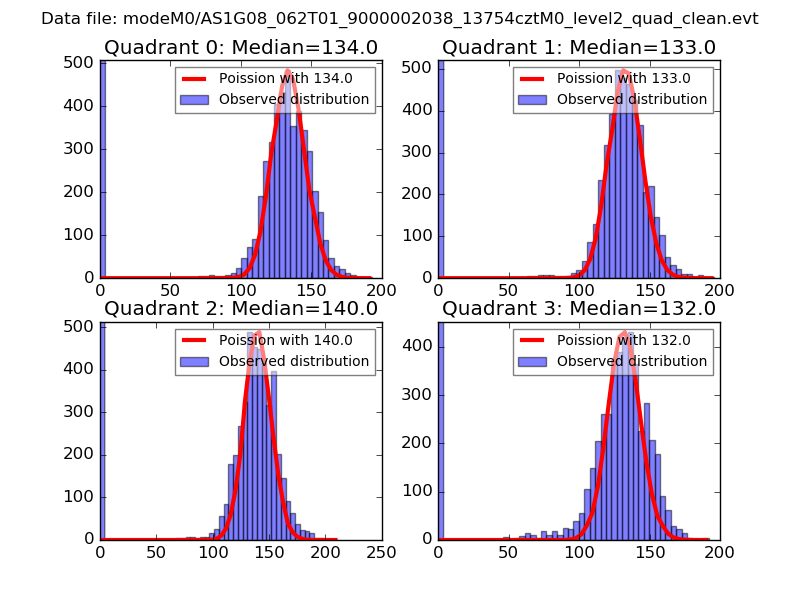 |
 |
| Quadrant-wise count rates Data is divided into 100 sec bins |
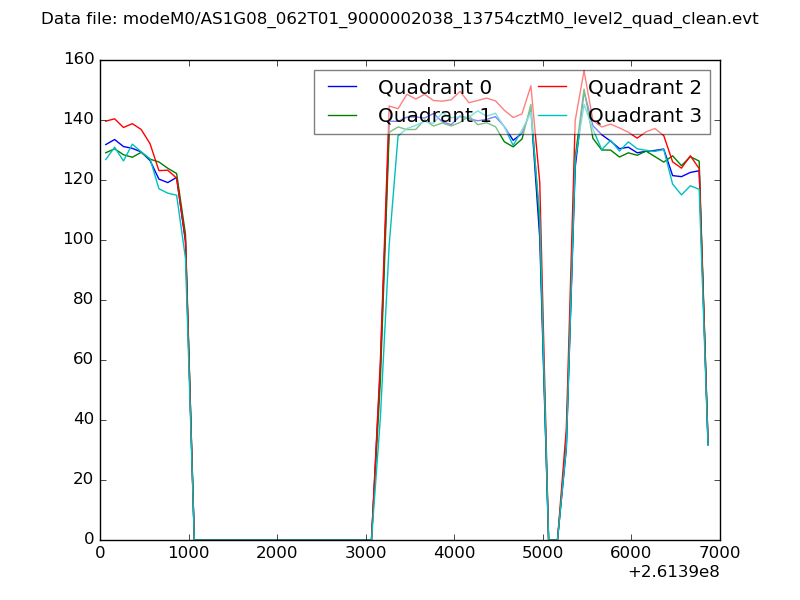 |
|
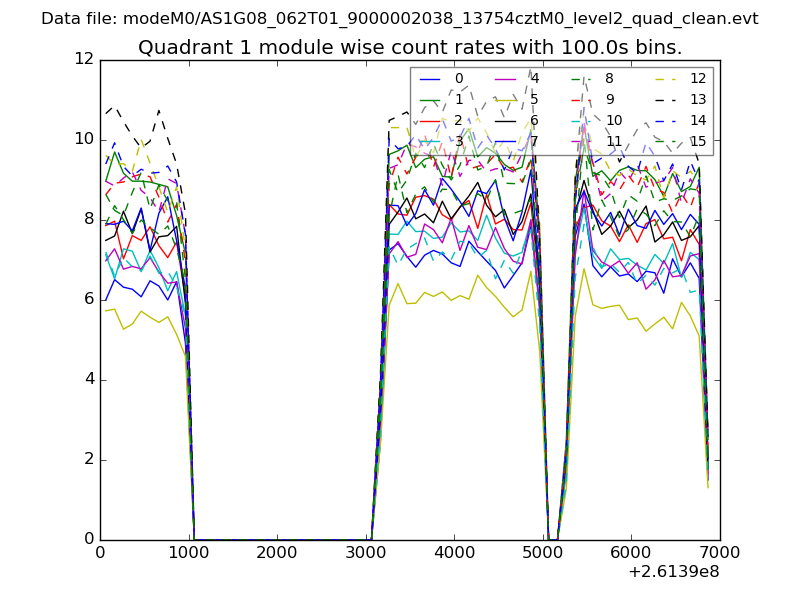
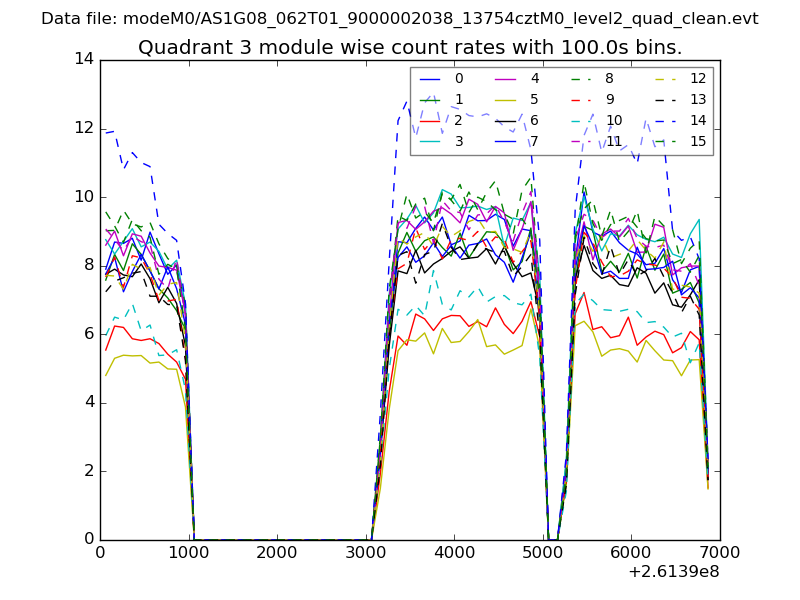
| Module-wise count rates for Quadrant A Data is divided into 100 sec bins |
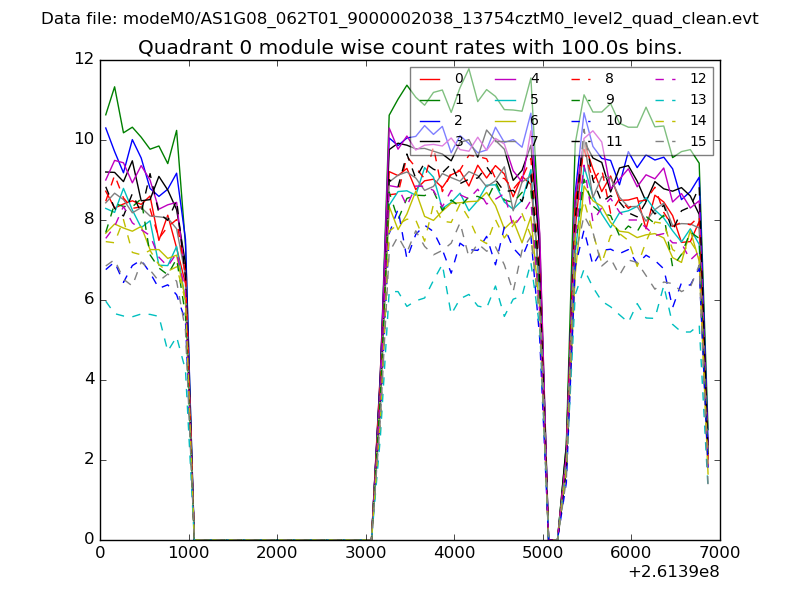 |
 |
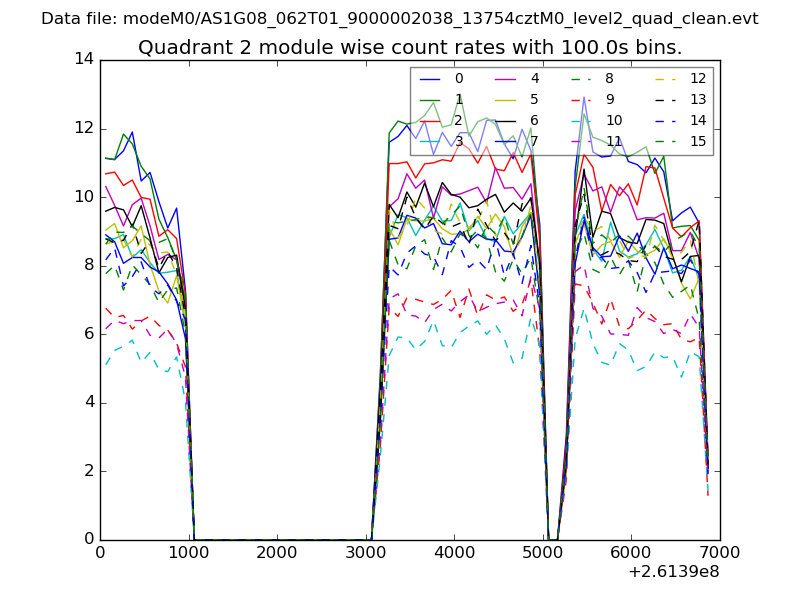
| Module-wise count rates for Quadrant B Data is divided into 100 sec bins |
 |
 |
| Module-wise count rates for Quadrant C Data is divided into 100 sec bins |
 |
 |
| Module-wise count rates for Quadrant D Data is divided into 100 sec bins |
 |
 |
| Parameter | Plot |
|---|---|
| CZT HV Monitor | 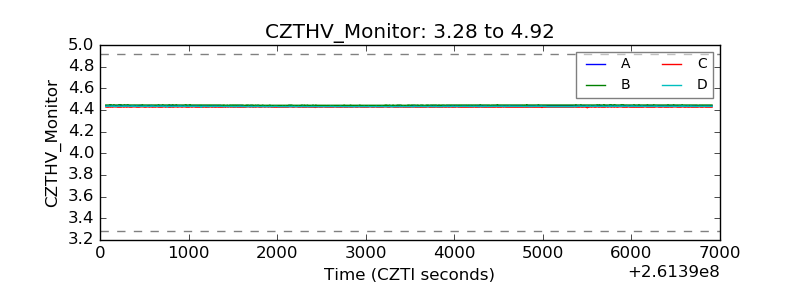 |
| D_VDD | 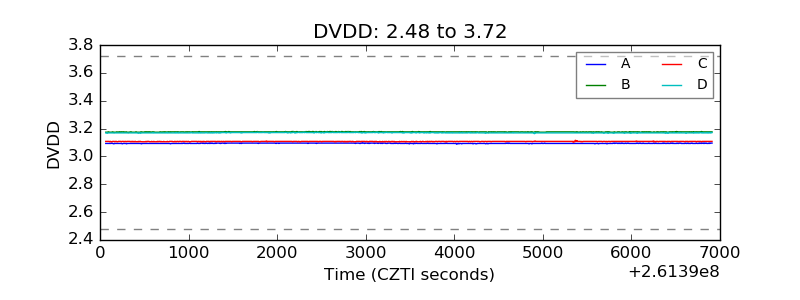 |
| Temperature 1 | 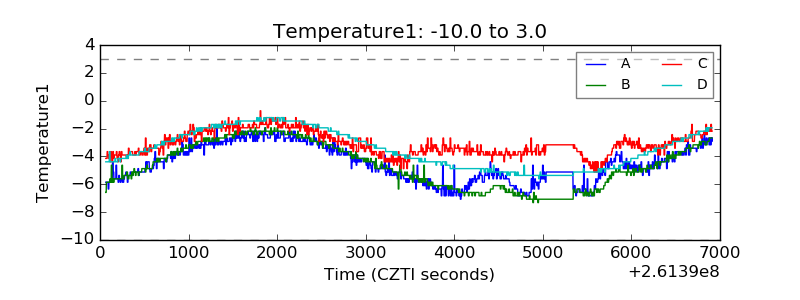 |
| Veto HV Monitor | 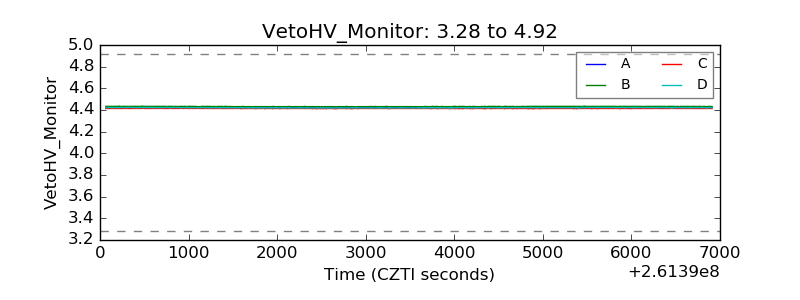 |
| Veto LLD | 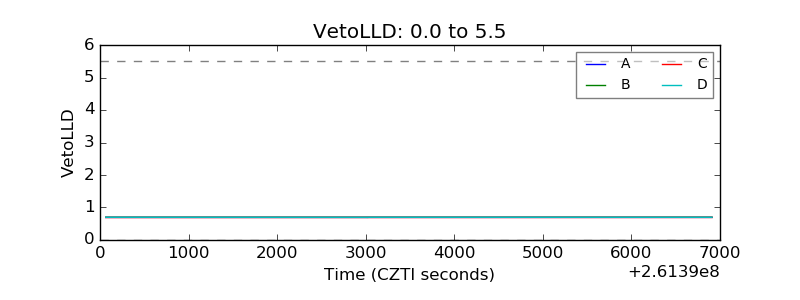 |
| Alpha Counter | 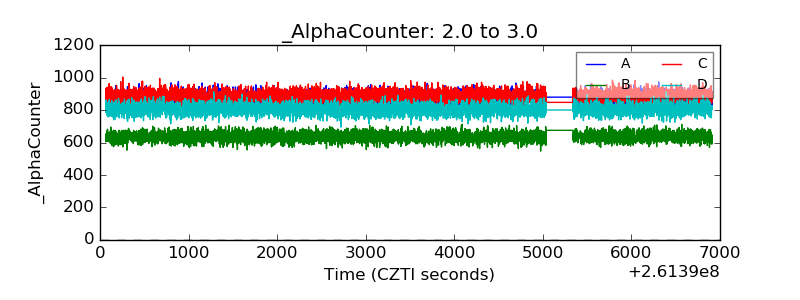 |
| _CPM_Rate | 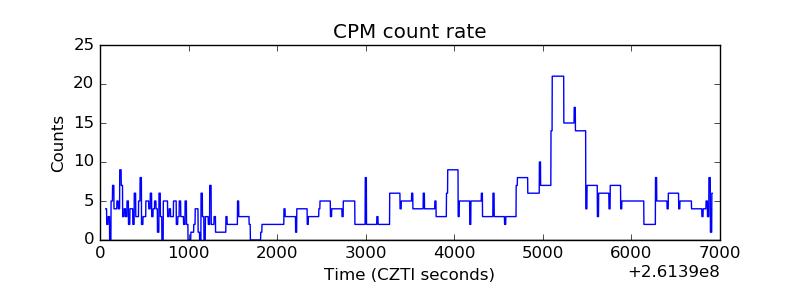 |
| CZT Counter | 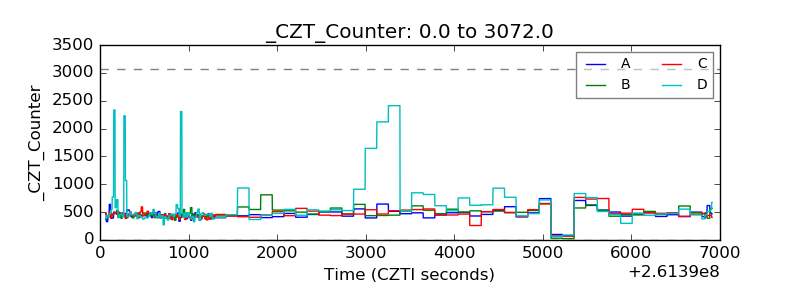 |
| +2.5 Volts monitor |  |
| +5 Volts monitor | 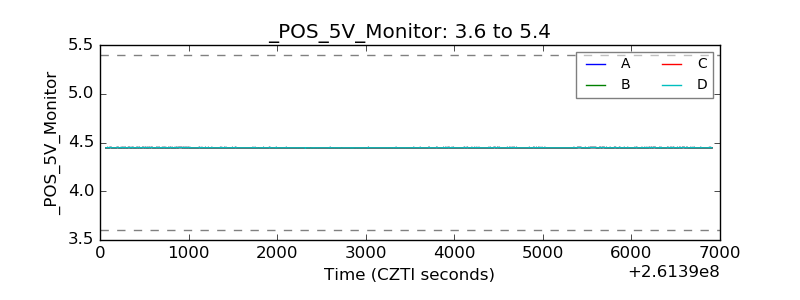 |
| _ROLL_ROT | 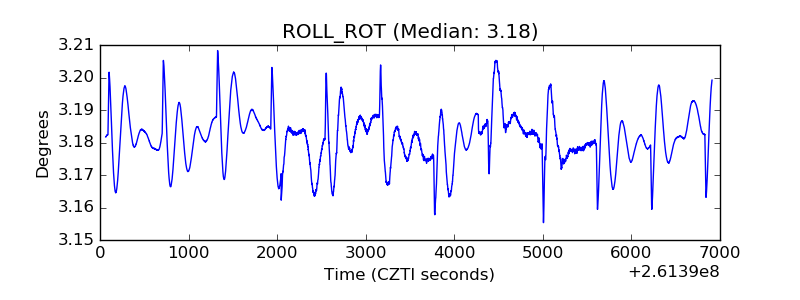 |
| _Roll_DEC | 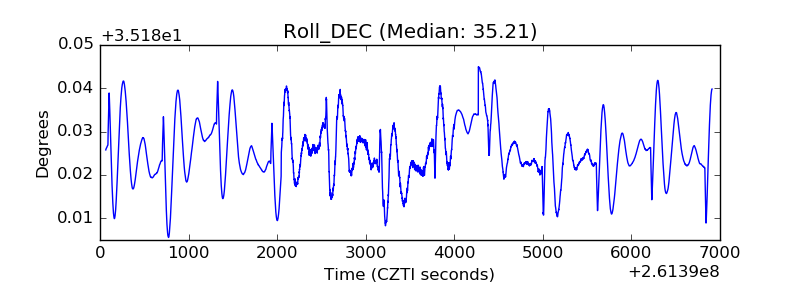 |
| _Roll_RA | 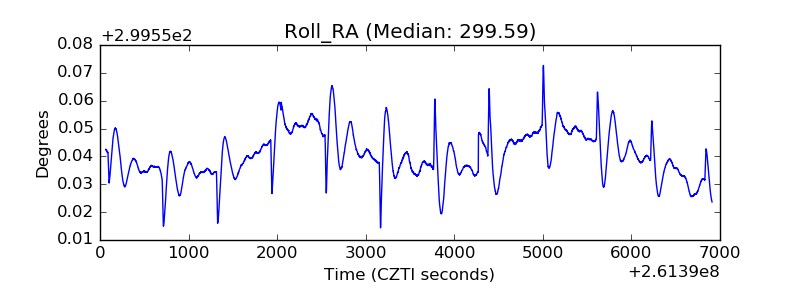 |
| Veto Counter | 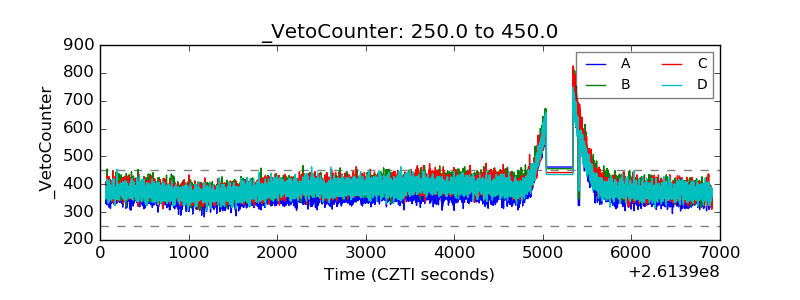 |