| Param | Original file | Final file |
|---|---|---|
| Filename | modeM0/AS1G08_062T01_9000002038_13755cztM0_level2.evt | modeM0/AS1G08_062T01_9000002038_13755cztM0_level2_quad_clean.evt |
| Size (bytes) | 518,241,600 | 97,174,080 |
| Size | 494.2 MB | 92.7 MB |
| Events in quadrant A | 3,509,367 | 603,633 |
| Events in quadrant B | 4,321,381 | 600,230 |
| Events in quadrant C | 3,506,274 | 630,320 |
| Events in quadrant D | 3,866,012 | 604,183 |
| Mode M0 | |||
|---|---|---|---|
| Quadrant | BADHDUFLAG | Total packets | Discarded packets |
| A | 0 | 15079 | 2 |
| B | 0 | 17445 | 1 |
| C | 0 | 15033 | 1 |
| D | 0 | 16171 | 1 |
| Mode SS | |||
|---|---|---|---|
| Quadrant | BADHDUFLAG | Total packets | Discarded packets |
| A | 0 | 146 | 0 |
| B | 0 | 146 | 0 |
| C | 0 | 146 | 0 |
| D | 0 | 146 | 0 |
| Quadrant | Total seconds | Saturated seconds | Saturation percentage |
|---|---|---|---|
| A | 7237 | 264 | 3.647920% |
| B | 7237 | 312 | 4.311179% |
| C | 7237 | 207 | 2.860301% |
| D | 7237 | 246 | 3.399199% |
Noise dominated data is calculated using 1-second bins in cleaned event files. If a bin has >2000 counts, and if more than 50% of those come from <1% of pixels, then it is considered to be noise-dominated and hence unusable.
| Quadrant | # 1 sec bins | Bins with >0 counts | Bins with >2000 counts | High rate bins dominated by noise | Noise dominated (total time) | Noise dominated (detector-on time) | Marked lightcurve |
|---|---|---|---|---|---|---|---|
| A | 7258 | 7239 | 1 | 1 | 0.01% | 0.01% |  |
| B | 7258 | 7239 | 22 | 22 | 0.30% | 0.30% |  |
| C | 7258 | 7239 | 0 | 0 | 0.00% | 0.00% |  |
| D | 7258 | 7239 | 24 | 24 | 0.33% | 0.33% |  |
Top three noisy pixels from each quadrant. If the there are fewer than three noisy pixels in the level2.evt file, extra rows are filled as -1
| Pixel properties | Quadrant properties | ||||||
|---|---|---|---|---|---|---|---|
| Quadrant | DetID | PixID | Counts | Sigma | Mean | Median | Sigma |
| A | 1 | 162 | 29214 | 155.54 | 888 | 867 | 182.3 |
| A | 9 | 143 | 19407 | 101.73 | 888 | 867 | 182.3 |
| A | 15 | 69 | 16127 | 83.73 | 888 | 867 | 182.3 |
| B | 5 | 32 | 556127 | 3258.31 | 879 | 856 | 170.4 |
| B | 4 | 173 | 138123 | 805.48 | 879 | 856 | 170.4 |
| B | 0 | 219 | 76745 | 445.31 | 879 | 856 | 170.4 |
| C | 3 | 233 | 106686 | 519.0 | 871 | 872 | 203.9 |
| C | 13 | 61 | 6346 | 26.85 | 871 | 872 | 203.9 |
| C | 14 | 234 | 2808 | 9.49 | 871 | 872 | 203.9 |
| D | 1 | 52 | 206845 | 903.41 | 862 | 842 | 228.0 |
| D | 5 | 222 | 190559 | 831.98 | 862 | 842 | 228.0 |
| D | 13 | 249 | 85257 | 370.19 | 862 | 842 | 228.0 |
Histogram calculated using DETX and DETY for each event in the final _common_clean file
| Quadrant A | 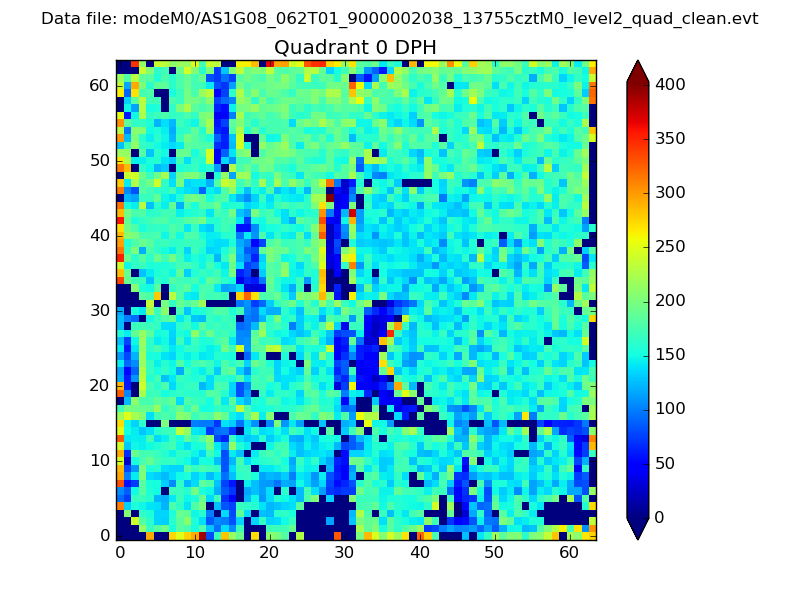 |
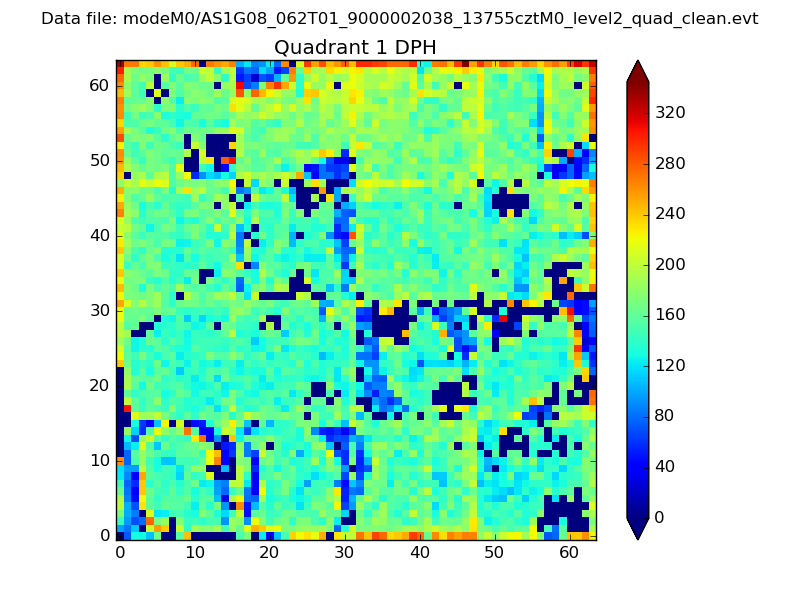 |
Quadrant B |
|---|---|---|---|
| Quadrant D | 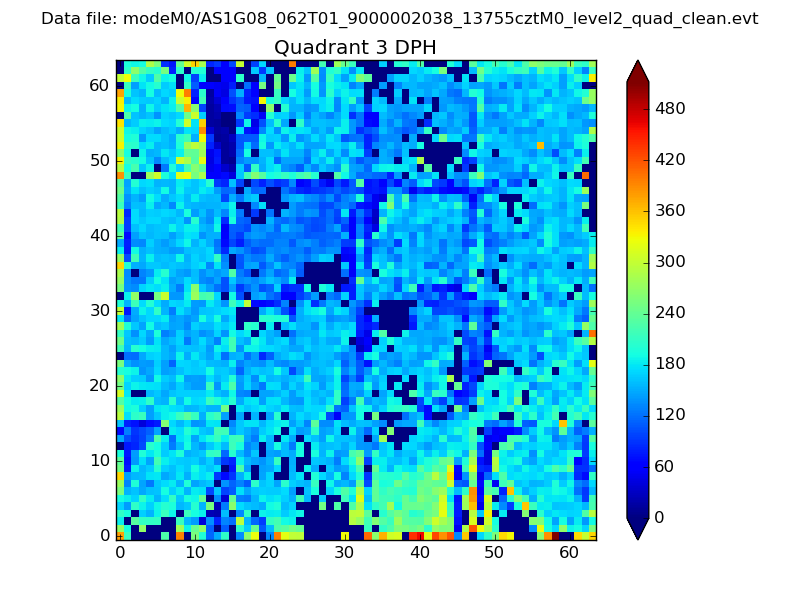 |
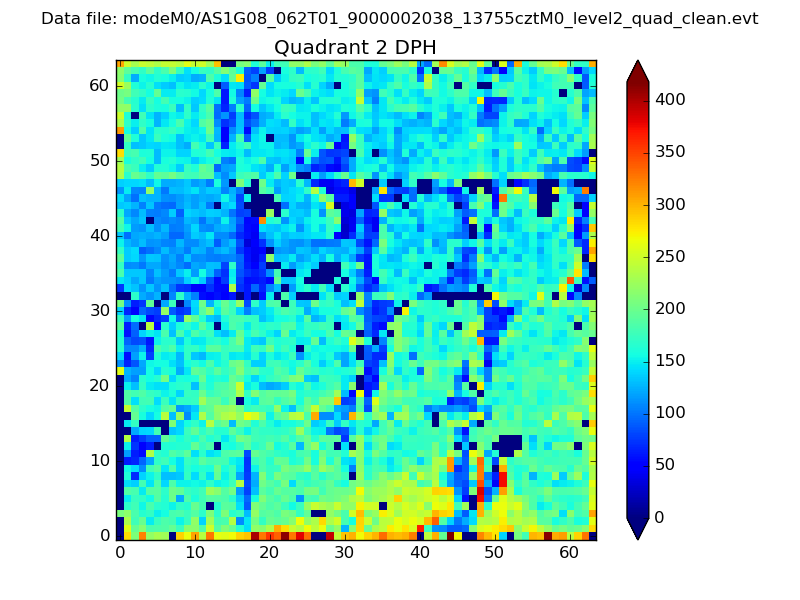 |
Quadrant C |
| Plot type | Count rate plots | Images |
|---|---|---|
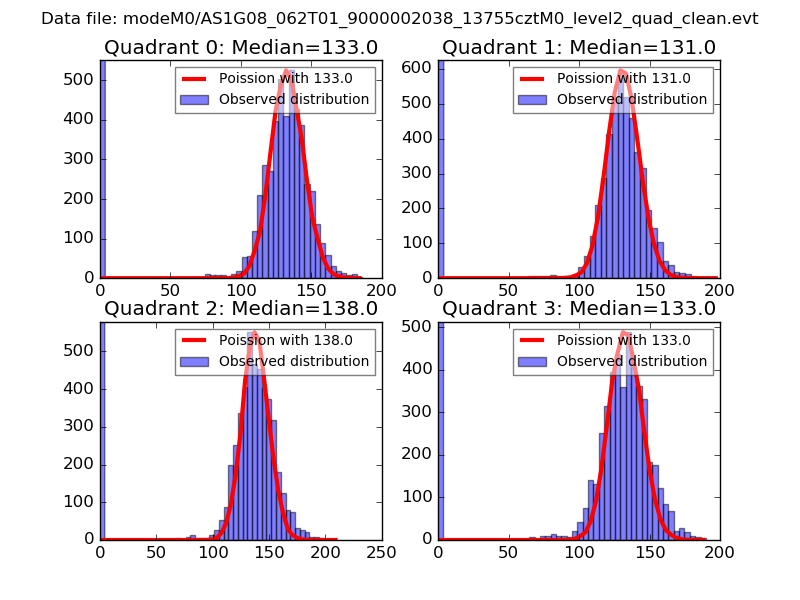
| Comparison with Poisson distribution Blue bars denote a histogram of data divided into 1 sec bins. Red curve is a Poisson curve with rate = median count rate of data. |
 |
 |
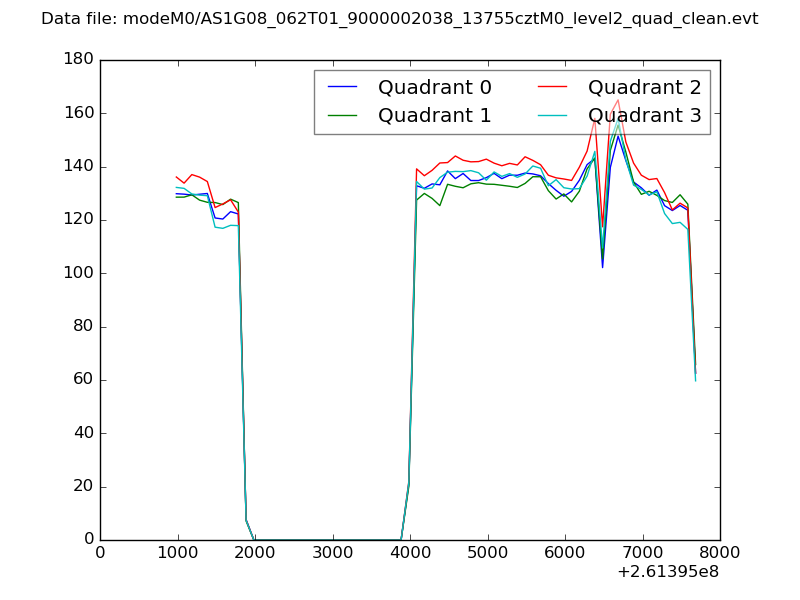
| Quadrant-wise count rates Data is divided into 100 sec bins |
 |
|
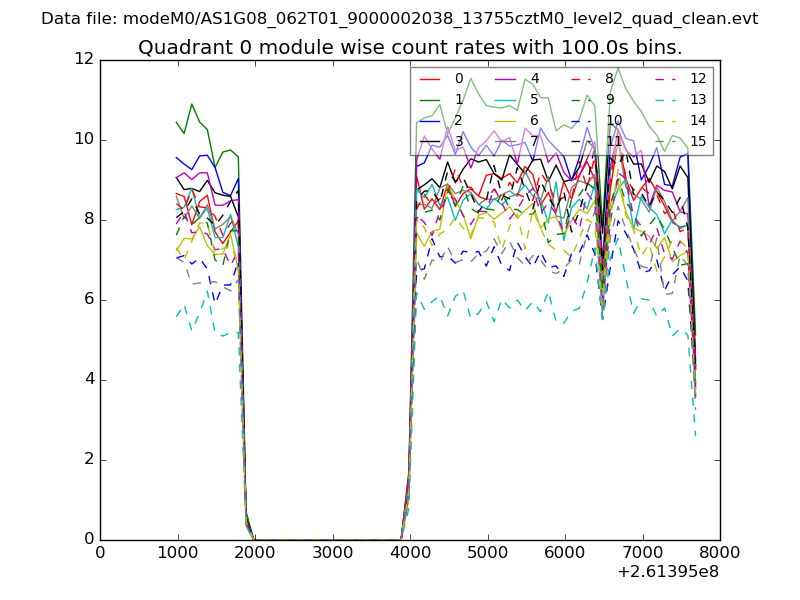
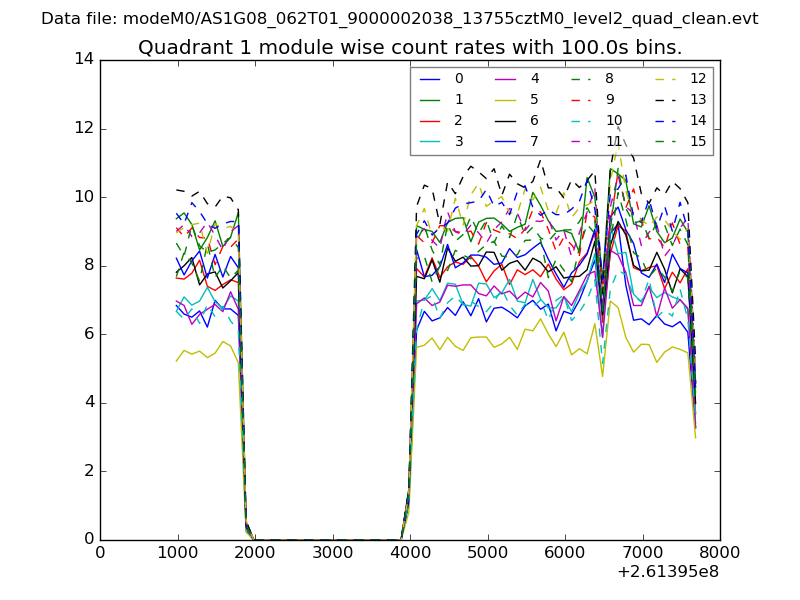
| Module-wise count rates for Quadrant A Data is divided into 100 sec bins |
 |
 |
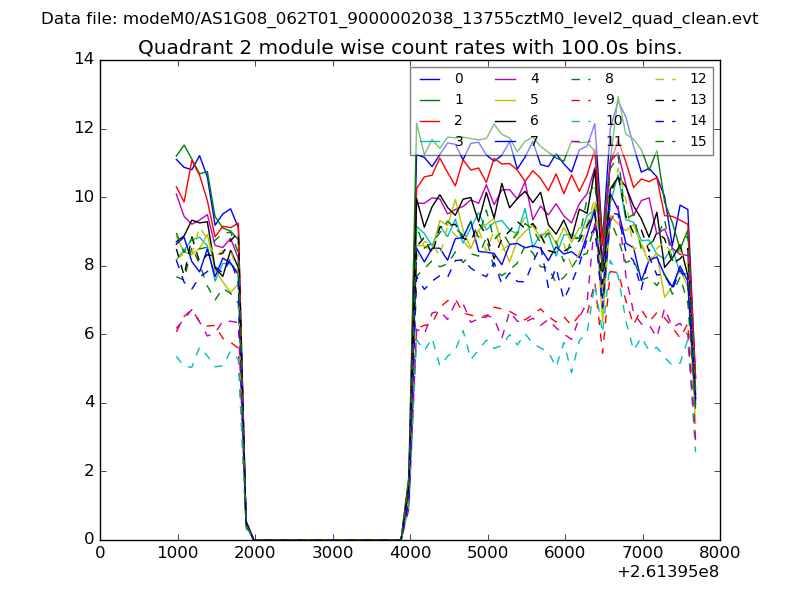
| Module-wise count rates for Quadrant B Data is divided into 100 sec bins |
 |
 |
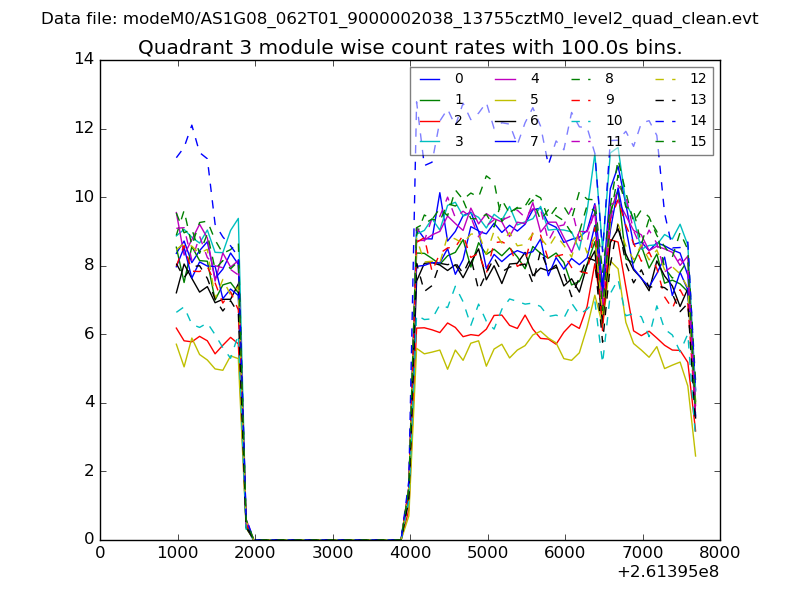
| Module-wise count rates for Quadrant C Data is divided into 100 sec bins |
 |
 |
| Module-wise count rates for Quadrant D Data is divided into 100 sec bins |
 |
 |
| Parameter | Plot |
|---|---|
| CZT HV Monitor | 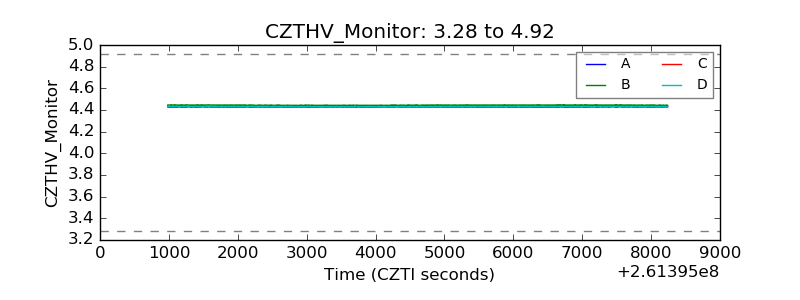 |
| D_VDD | 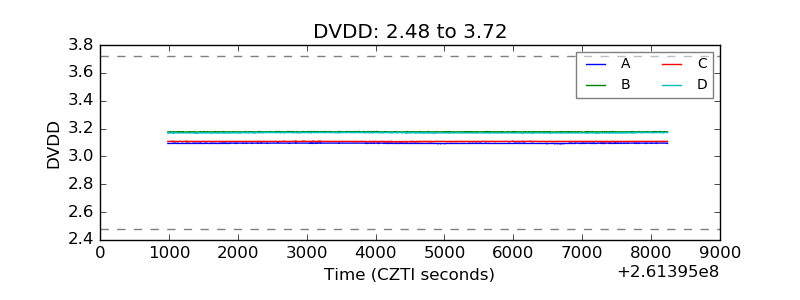 |
| Temperature 1 | 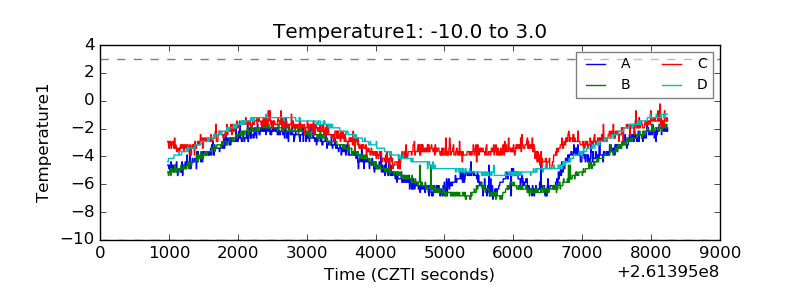 |
| Veto HV Monitor | 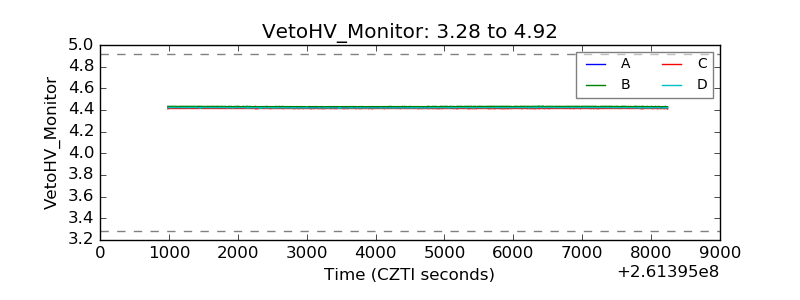 |
| Veto LLD | 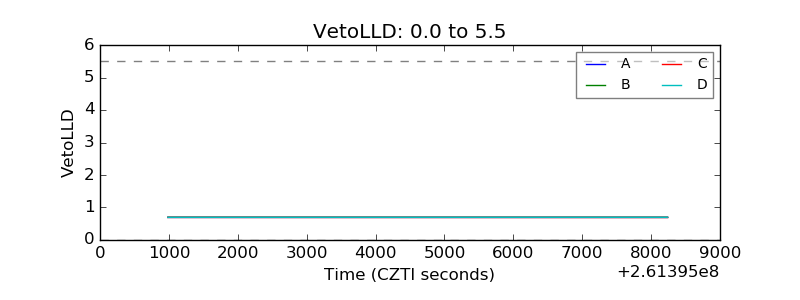 |
| Alpha Counter | 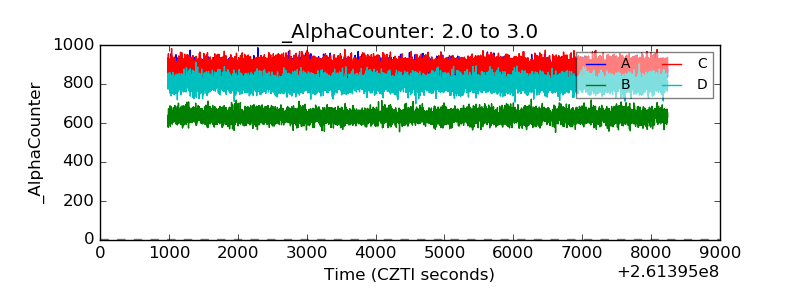 |
| _CPM_Rate | 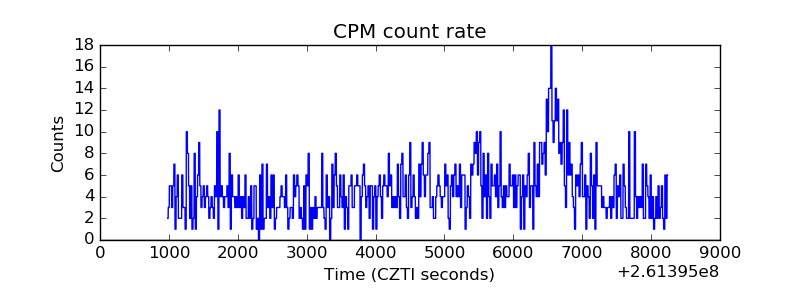 |
| CZT Counter | 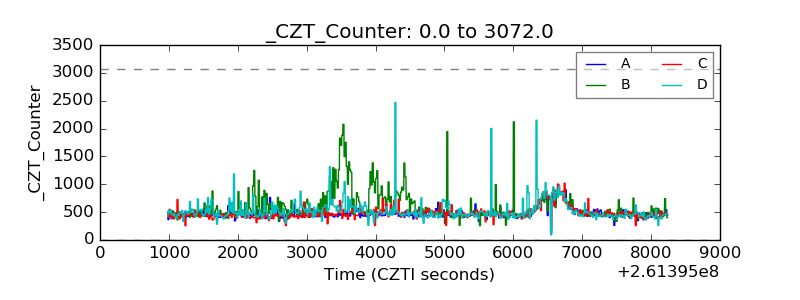 |
| +2.5 Volts monitor | 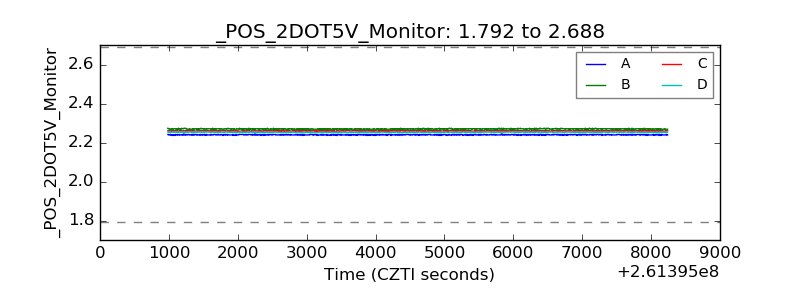 |
| +5 Volts monitor | 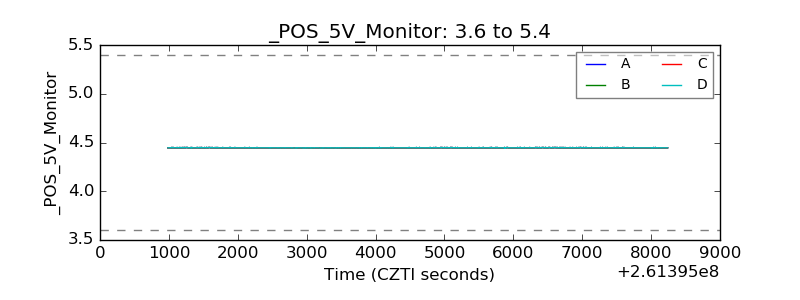 |
| _ROLL_ROT | 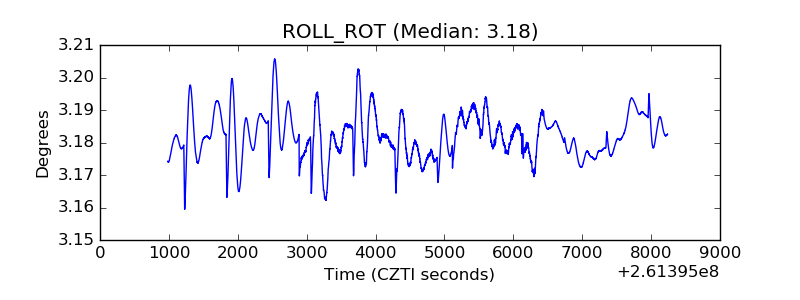 |
| _Roll_DEC | 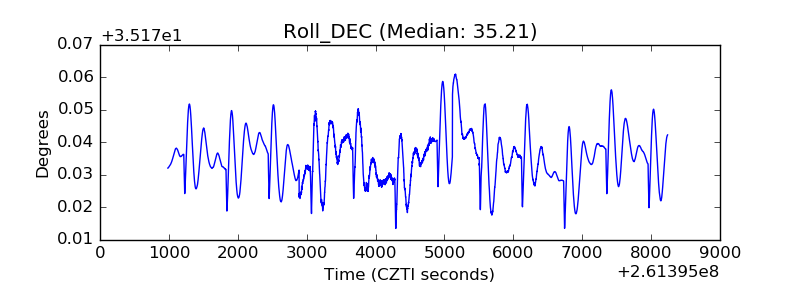 |
| _Roll_RA | 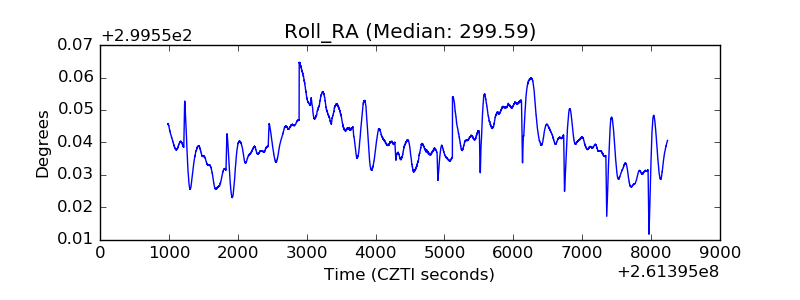 |
| Veto Counter | 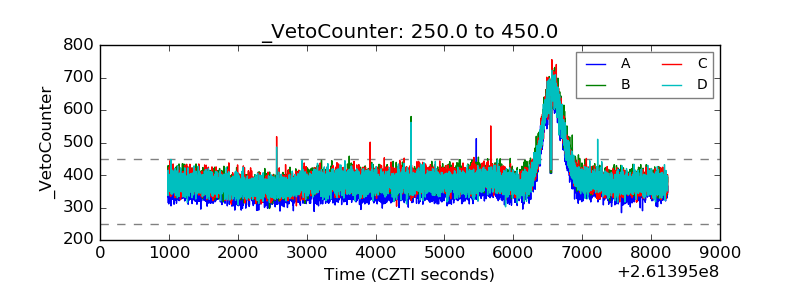 |