| Param | Original file | Final file |
|---|---|---|
| Filename | modeM0/AS1G08_062T01_9000002038_13756cztM0_level2.evt | modeM0/AS1G08_062T01_9000002038_13756cztM0_level2_quad_clean.evt |
| Size (bytes) | 535,279,680 | 90,144,000 |
| Size | 510.5 MB | 86.0 MB |
| Events in quadrant A | 4,226,202 | 549,884 |
| Events in quadrant B | 4,036,942 | 545,842 |
| Events in quadrant C | 3,497,752 | 569,644 |
| Events in quadrant D | 3,946,808 | 548,268 |
| Mode M9 | |||
|---|---|---|---|
| Quadrant | BADHDUFLAG | Total packets | Discarded packets |
| A | 0 | 3 | 0 |
| B | 0 | 3 | 0 |
| C | 0 | 3 | 0 |
| D | 0 | 3 | 0 |
| Mode M0 | |||
|---|---|---|---|
| Quadrant | BADHDUFLAG | Total packets | Discarded packets |
| A | 0 | 17420 | 2 |
| B | 0 | 16663 | 1 |
| C | 0 | 15081 | 1 |
| D | 0 | 16403 | 1 |
| Mode SS | |||
|---|---|---|---|
| Quadrant | BADHDUFLAG | Total packets | Discarded packets |
| A | 0 | 152 | 0 |
| B | 0 | 152 | 0 |
| C | 0 | 152 | 0 |
| D | 0 | 152 | 0 |
| Quadrant | Total seconds | Saturated seconds | Saturation percentage |
|---|---|---|---|
| A | 7410 | 257 | 3.468286% |
| B | 7410 | 132 | 1.781377% |
| C | 7410 | 70 | 0.944669% |
| D | 7410 | 101 | 1.363023% |
Noise dominated data is calculated using 1-second bins in cleaned event files. If a bin has >2000 counts, and if more than 50% of those come from <1% of pixels, then it is considered to be noise-dominated and hence unusable.
| Quadrant | # 1 sec bins | Bins with >0 counts | Bins with >2000 counts | High rate bins dominated by noise | Noise dominated (total time) | Noise dominated (detector-on time) | Marked lightcurve |
|---|---|---|---|---|---|---|---|
| A | 7761 | 7411 | 127 | 127 | 1.64% | 1.71% | 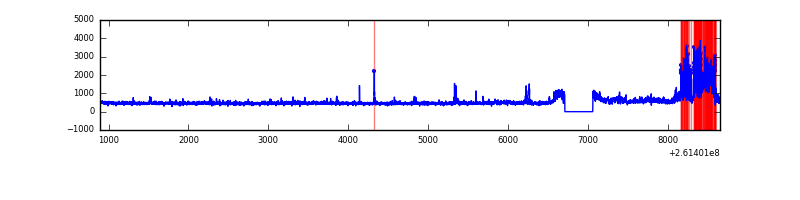 |
| B | 7761 | 7412 | 23 | 23 | 0.30% | 0.31% | 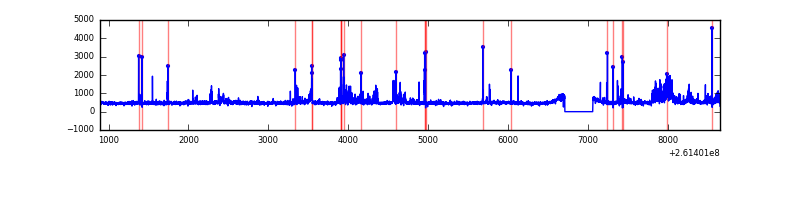 |
| C | 7761 | 7412 | 1 | 1 | 0.01% | 0.01% | 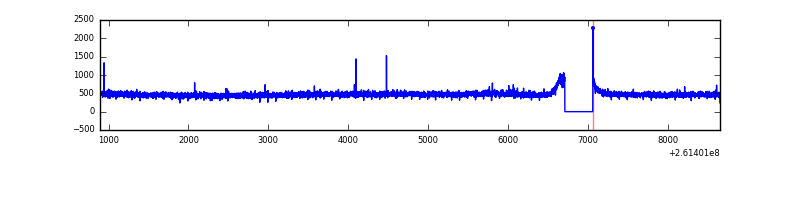 |
| D | 7761 | 7412 | 32 | 32 | 0.41% | 0.43% | 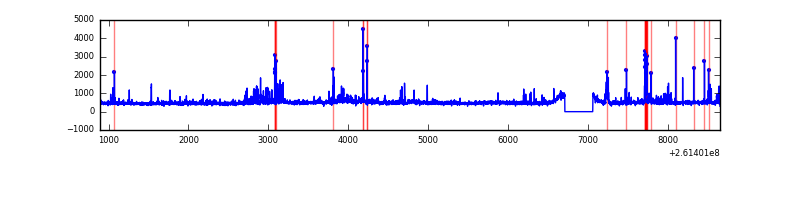 |
Top three noisy pixels from each quadrant. If the there are fewer than three noisy pixels in the level2.evt file, extra rows are filled as -1
| Pixel properties | Quadrant properties | ||||||
|---|---|---|---|---|---|---|---|
| Quadrant | DetID | PixID | Counts | Sigma | Mean | Median | Sigma |
| A | 9 | 143 | 483787 | 2661.11 | 885 | 866 | 181.5 |
| A | 0 | 23 | 229794 | 1261.5 | 885 | 866 | 181.5 |
| A | 11 | 29 | 60349 | 327.78 | 885 | 866 | 181.5 |
| B | 0 | 219 | 372037 | 2174.98 | 884 | 864 | 170.7 |
| B | 4 | 173 | 106533 | 619.19 | 884 | 864 | 170.7 |
| B | 4 | 80 | 37362 | 213.87 | 884 | 864 | 170.7 |
| C | 3 | 233 | 99342 | 482.84 | 868 | 871 | 203.9 |
| C | 13 | 61 | 6196 | 26.11 | 868 | 871 | 203.9 |
| C | 14 | 234 | 5261 | 21.53 | 868 | 871 | 203.9 |
| D | 1 | 52 | 191379 | 822.34 | 860 | 841 | 231.7 |
| D | 5 | 222 | 184494 | 792.62 | 860 | 841 | 231.7 |
| D | 10 | 157 | 167495 | 719.26 | 860 | 841 | 231.7 |
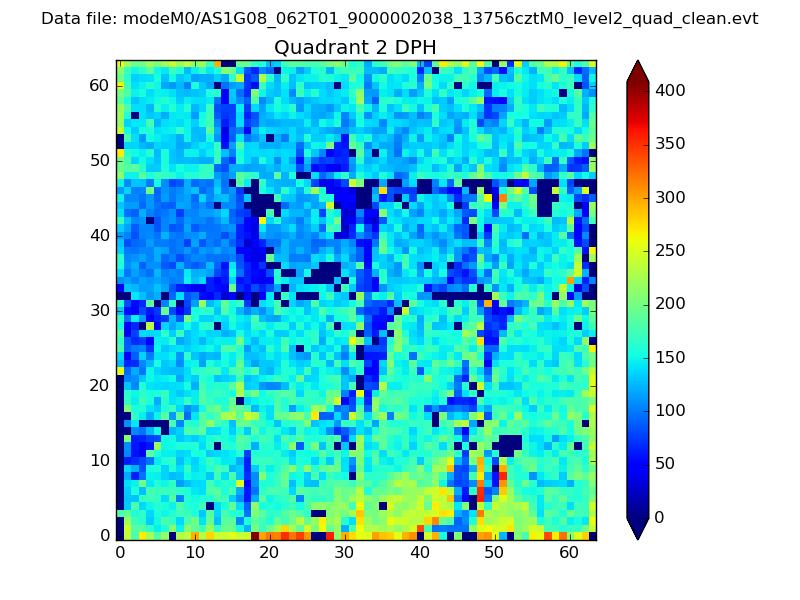
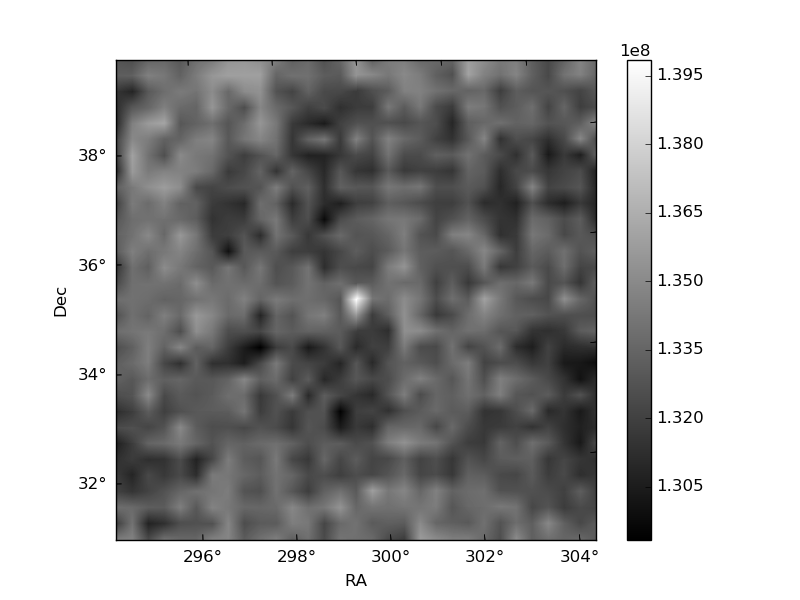
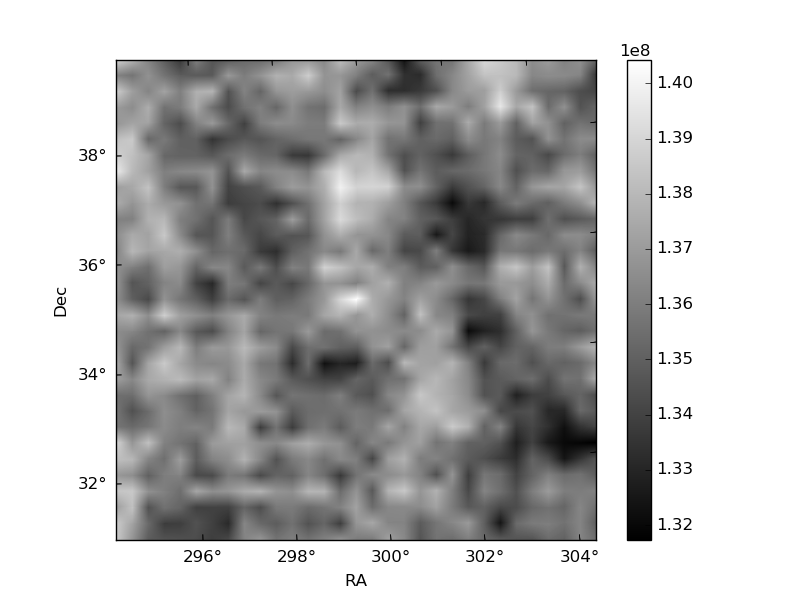
Histogram calculated using DETX and DETY for each event in the final _common_clean file
| Quadrant A | 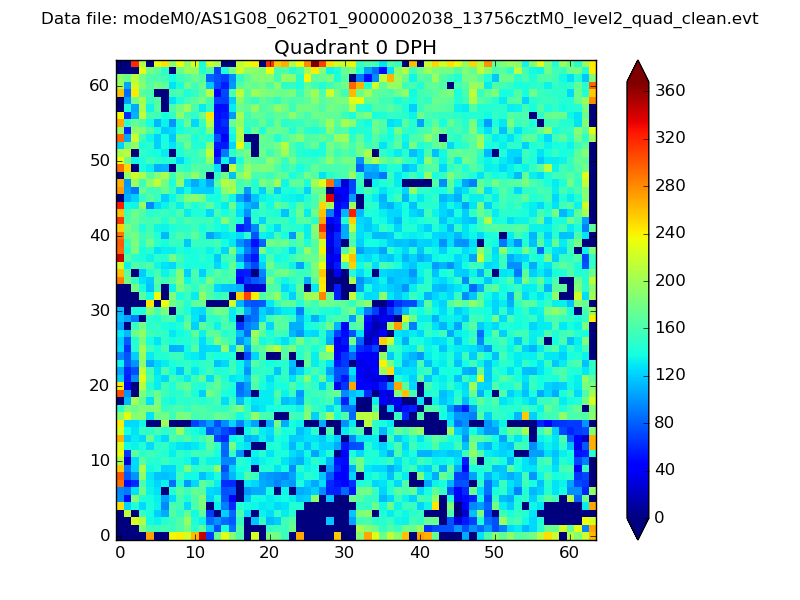 |
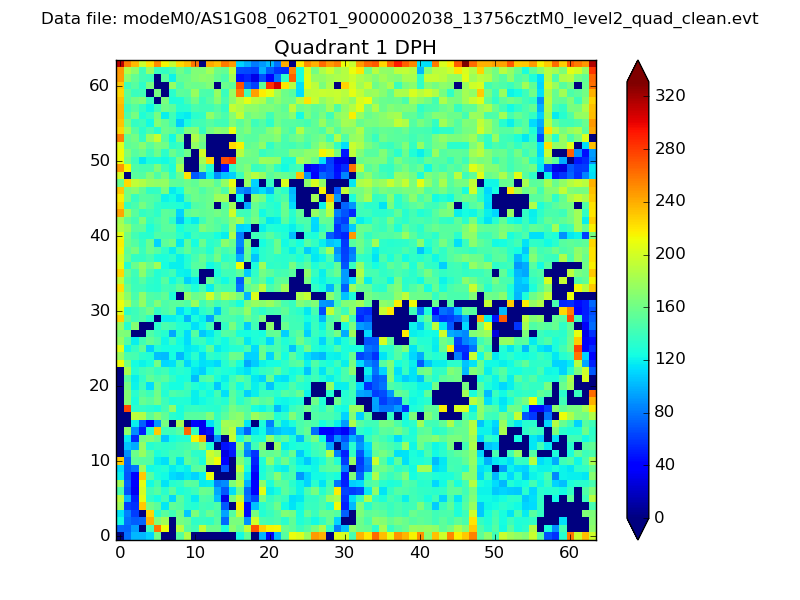 |
Quadrant B |
|---|---|---|---|
| Quadrant D | 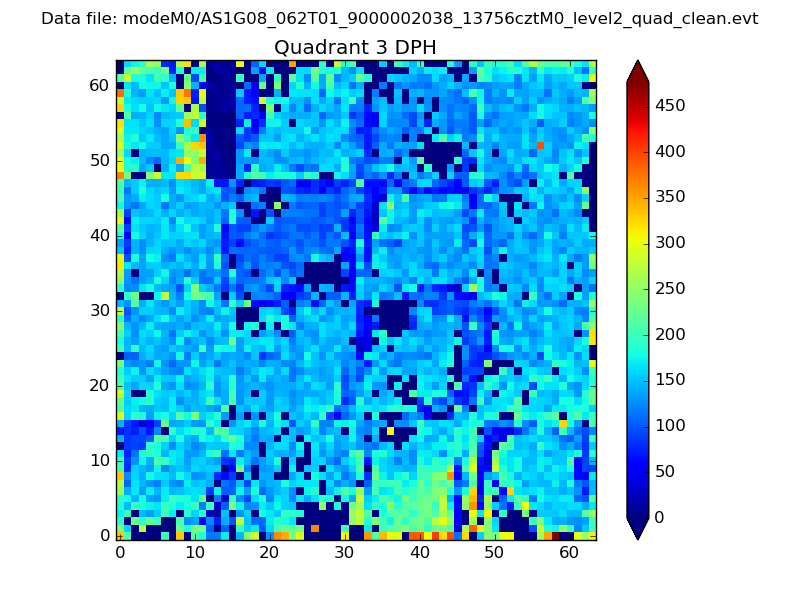 |
 |
Quadrant C |
| Plot type | Count rate plots | Images |
|---|---|---|
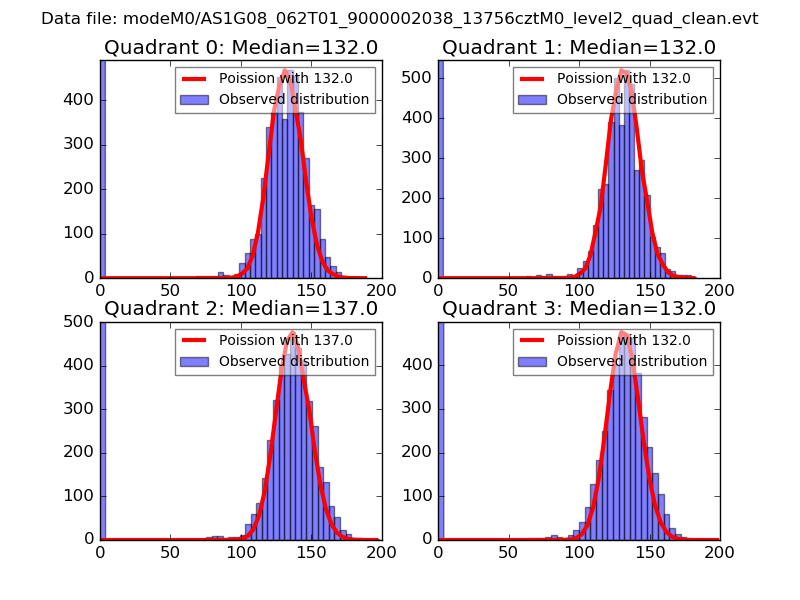
| Comparison with Poisson distribution Blue bars denote a histogram of data divided into 1 sec bins. Red curve is a Poisson curve with rate = median count rate of data. |
 |
 |
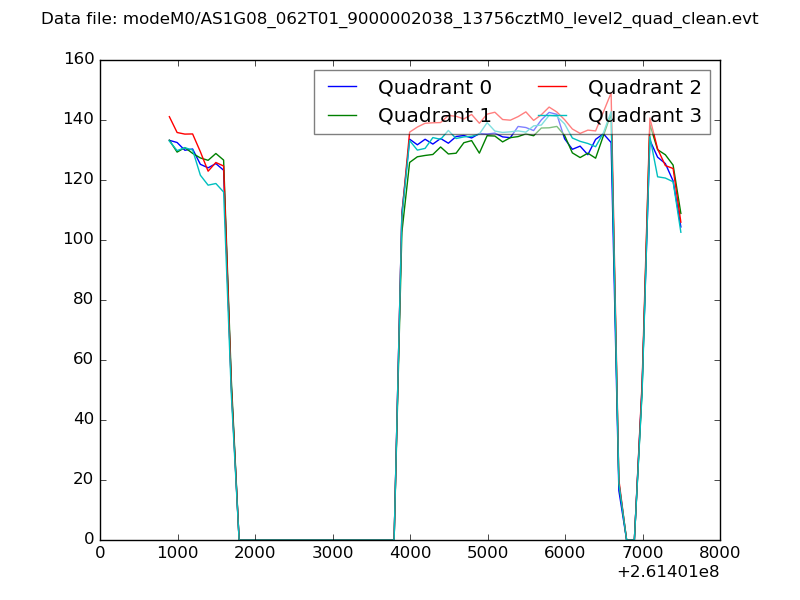
| Quadrant-wise count rates Data is divided into 100 sec bins |
 |
|
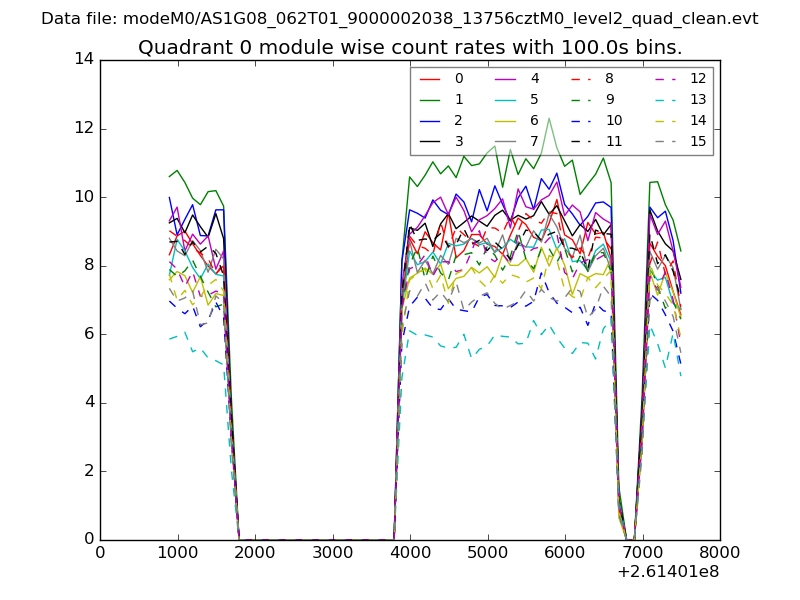
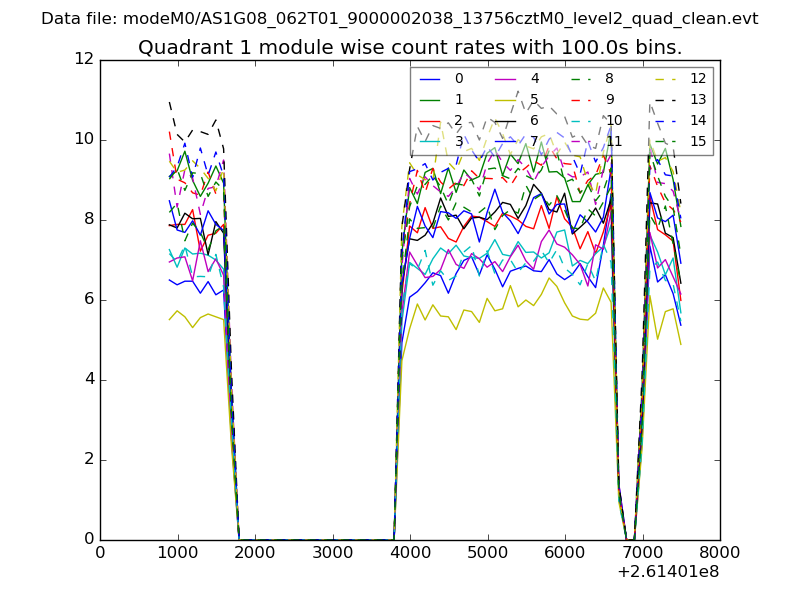
| Module-wise count rates for Quadrant A Data is divided into 100 sec bins |
 |
 |
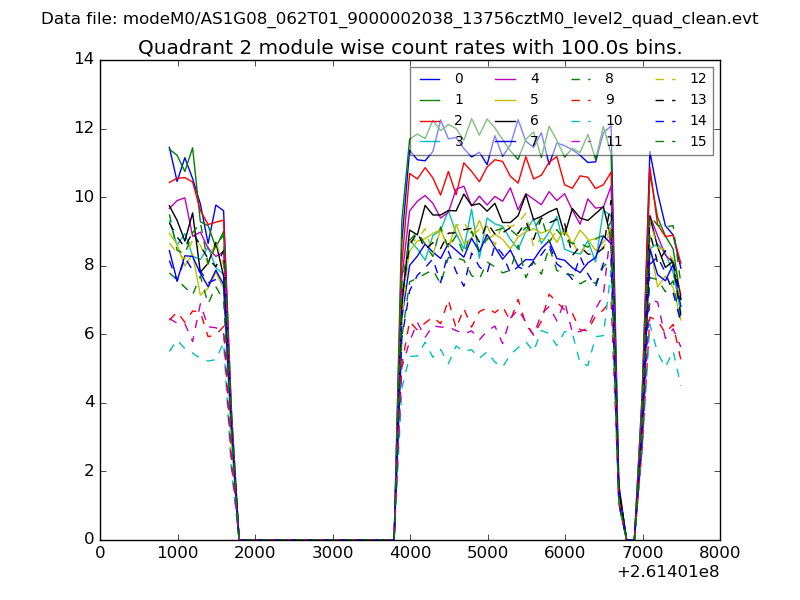
| Module-wise count rates for Quadrant B Data is divided into 100 sec bins |
 |
 |
| Module-wise count rates for Quadrant C Data is divided into 100 sec bins |
 |
 |
| Module-wise count rates for Quadrant D Data is divided into 100 sec bins |
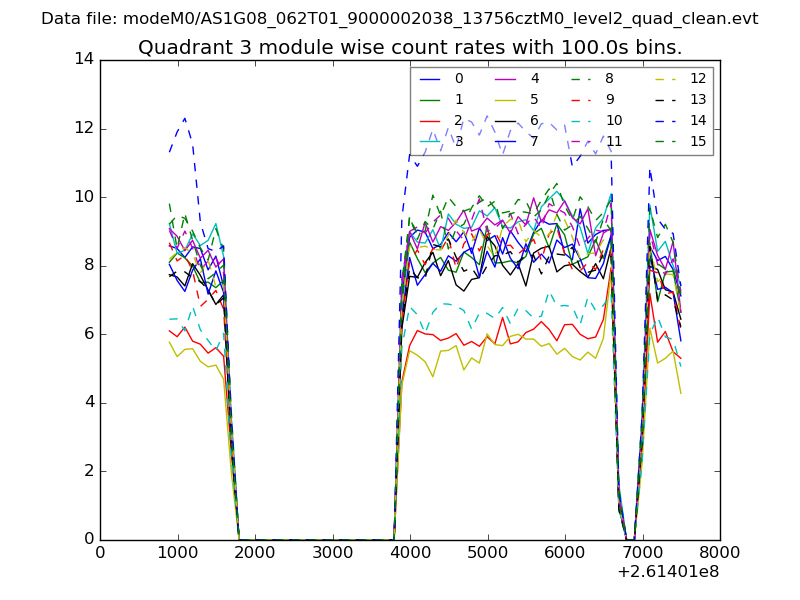 |
 |
| Parameter | Plot |
|---|---|
| CZT HV Monitor | 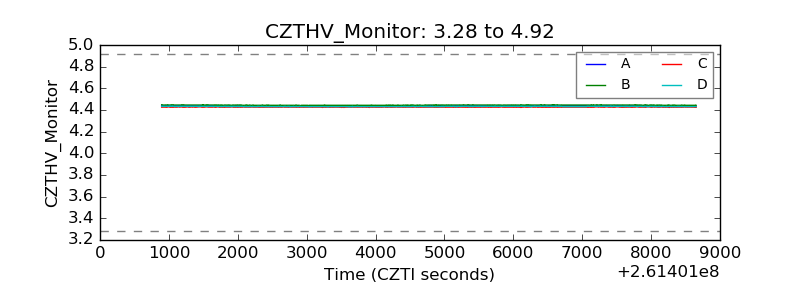 |
| D_VDD | 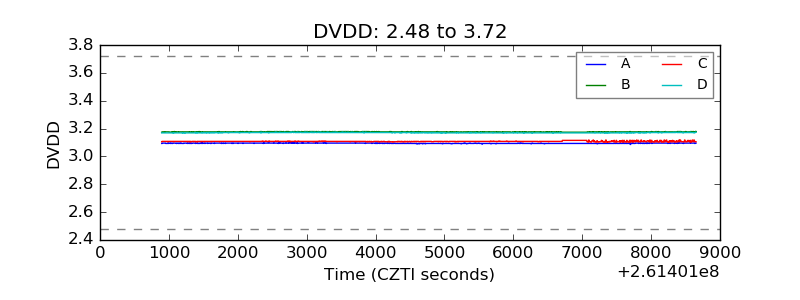 |
| Temperature 1 | 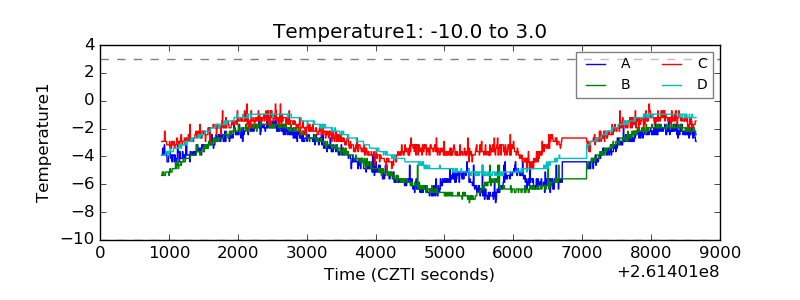 |
| Veto HV Monitor | 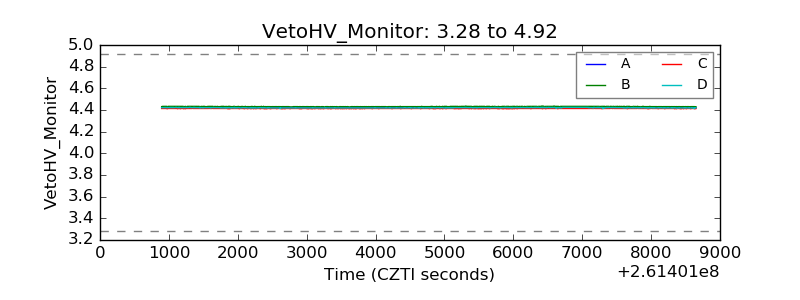 |
| Veto LLD | 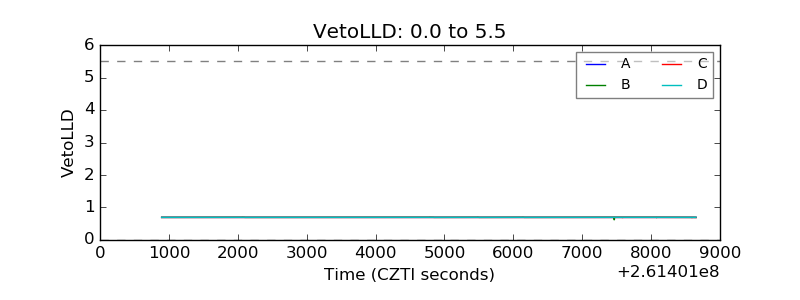 |
| Alpha Counter | 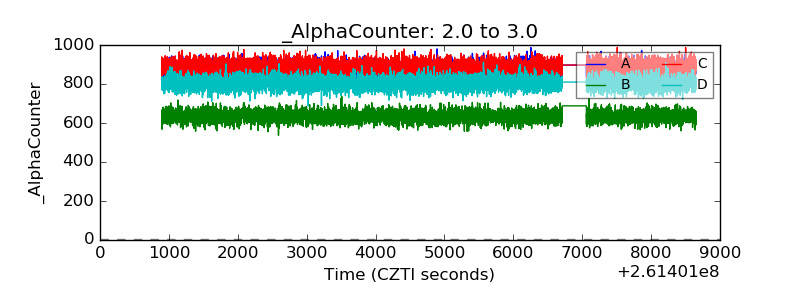 |
| _CPM_Rate | 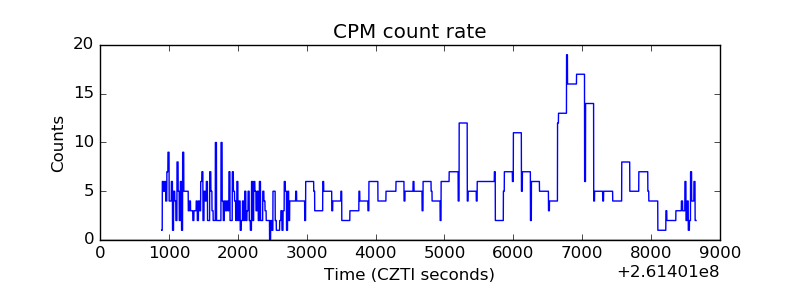 |
| CZT Counter | 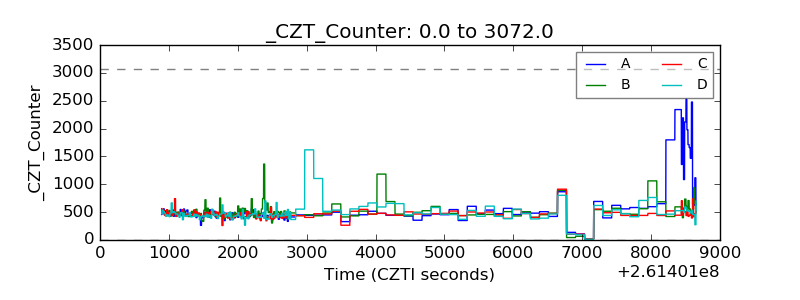 |
| +2.5 Volts monitor |  |
| +5 Volts monitor |  |
| _ROLL_ROT | 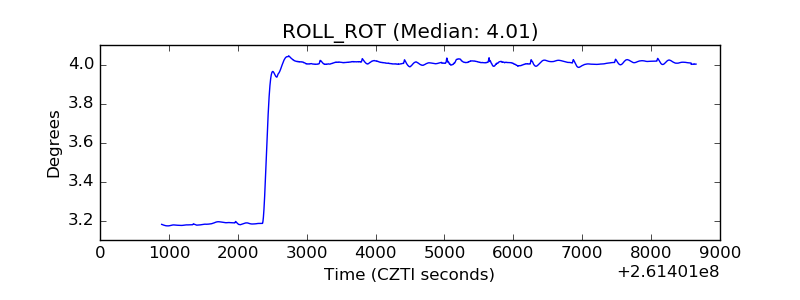 |
| _Roll_DEC | 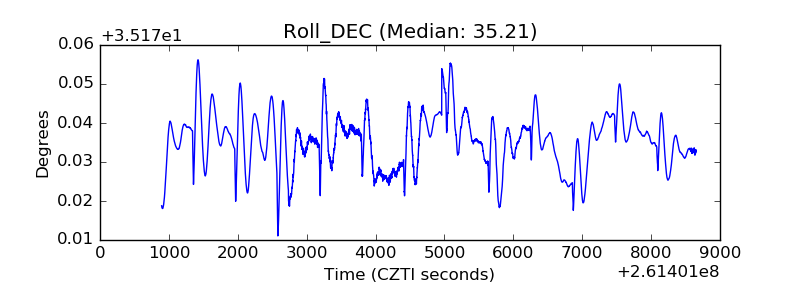 |
| _Roll_RA | 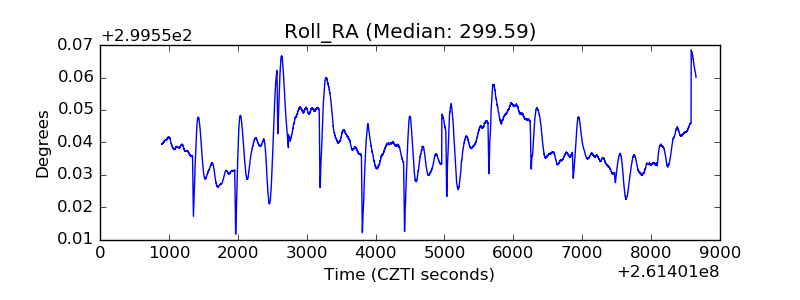 |
| Veto Counter | 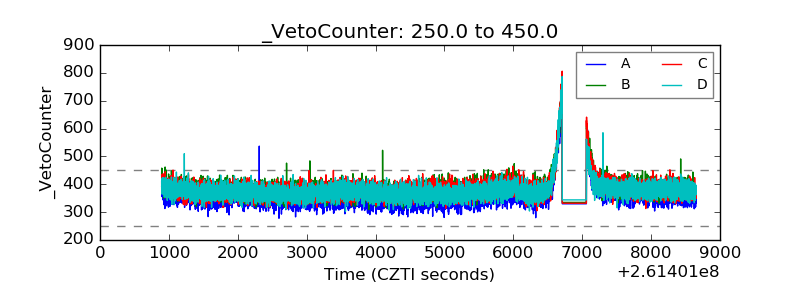 |