| Param | Original file | Final file |
|---|---|---|
| Filename | modeM0/AS1G08_062T01_9000002038_13758cztM0_level2.evt | modeM0/AS1G08_062T01_9000002038_13758cztM0_level2_quad_clean.evt |
| Size (bytes) | 963,576,000 | 154,166,400 |
| Size | 918.9 MB | 147.0 MB |
| Events in quadrant A | 7,953,027 | 938,907 |
| Events in quadrant B | 6,800,331 | 922,506 |
| Events in quadrant C | 6,229,217 | 975,709 |
| Events in quadrant D | 7,323,924 | 936,909 |
| Mode M9 | |||
|---|---|---|---|
| Quadrant | BADHDUFLAG | Total packets | Discarded packets |
| A | 0 | 13 | 0 |
| B | 0 | 13 | 0 |
| C | 0 | 13 | 0 |
| D | 0 | 14 | 0 |
| Mode M0 | |||
|---|---|---|---|
| Quadrant | BADHDUFLAG | Total packets | Discarded packets |
| A | 0 | 31806 | 4 |
| B | 0 | 28293 | 3 |
| C | 0 | 26427 | 3 |
| D | 0 | 29950 | 3 |
| Mode SS | |||
|---|---|---|---|
| Quadrant | BADHDUFLAG | Total packets | Discarded packets |
| A | 0 | 262 | 0 |
| B | 0 | 262 | 0 |
| C | 0 | 262 | 0 |
| D | 0 | 262 | 0 |
| Quadrant | Total seconds | Saturated seconds | Saturation percentage |
|---|---|---|---|
| A | 12953 | 353 | 2.725237% |
| B | 12953 | 203 | 1.567205% |
| C | 12953 | 85 | 0.656219% |
| D | 12953 | 219 | 1.690728% |
Noise dominated data is calculated using 1-second bins in cleaned event files. If a bin has >2000 counts, and if more than 50% of those come from <1% of pixels, then it is considered to be noise-dominated and hence unusable.
| Quadrant | # 1 sec bins | Bins with >0 counts | Bins with >2000 counts | High rate bins dominated by noise | Noise dominated (total time) | Noise dominated (detector-on time) | Marked lightcurve |
|---|---|---|---|---|---|---|---|
| A | 14124 | 12955 | 160 | 160 | 1.13% | 1.24% | 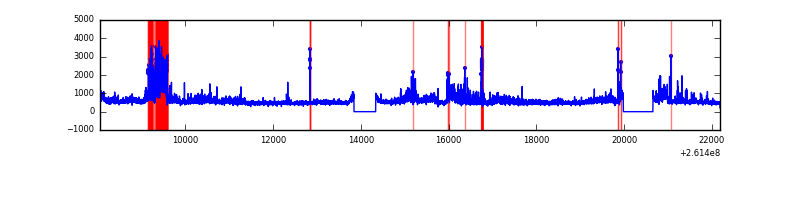 |
| B | 14124 | 12956 | 27 | 27 | 0.19% | 0.21% | 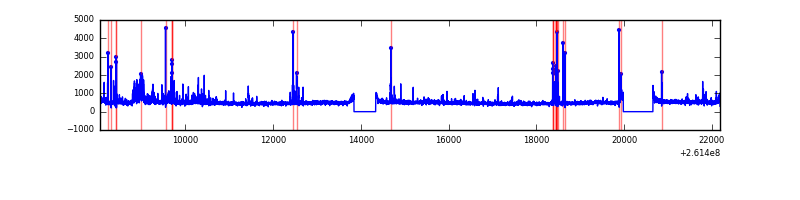 |
| C | 14124 | 12956 | 1 | 1 | 0.01% | 0.01% | 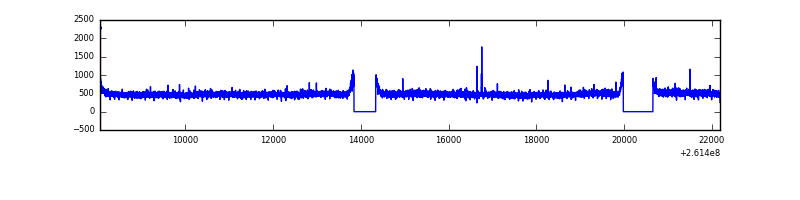 |
| D | 14124 | 12956 | 126 | 126 | 0.89% | 0.97% | 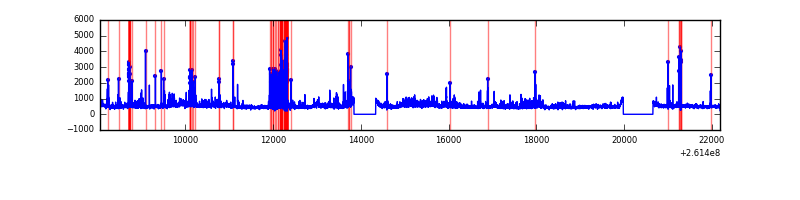 |
Top three noisy pixels from each quadrant. If the there are fewer than three noisy pixels in the level2.evt file, extra rows are filled as -1
| Pixel properties | Quadrant properties | ||||||
|---|---|---|---|---|---|---|---|
| Quadrant | DetID | PixID | Counts | Sigma | Mean | Median | Sigma |
| A | 0 | 23 | 1105610 | 3460.68 | 1569 | 1537 | 319.0 |
| A | 9 | 143 | 545728 | 1705.75 | 1569 | 1537 | 319.0 |
| A | 15 | 69 | 96696 | 298.27 | 1569 | 1537 | 319.0 |
| B | 0 | 219 | 264267 | 878.75 | 1566 | 1525 | 299.0 |
| B | 4 | 173 | 242785 | 806.9 | 1566 | 1525 | 299.0 |
| B | 4 | 80 | 48113 | 155.81 | 1566 | 1525 | 299.0 |
| C | 3 | 233 | 184341 | 508.14 | 1544 | 1553 | 359.7 |
| C | 8 | 128 | 11344 | 27.22 | 1544 | 1553 | 359.7 |
| C | 13 | 61 | 11169 | 26.73 | 1544 | 1553 | 359.7 |
| D | 1 | 52 | 778818 | 1899.39 | 1521 | 1492 | 409.3 |
| D | 8 | 195 | 251106 | 609.93 | 1521 | 1492 | 409.3 |
| D | 5 | 222 | 227707 | 552.75 | 1521 | 1492 | 409.3 |
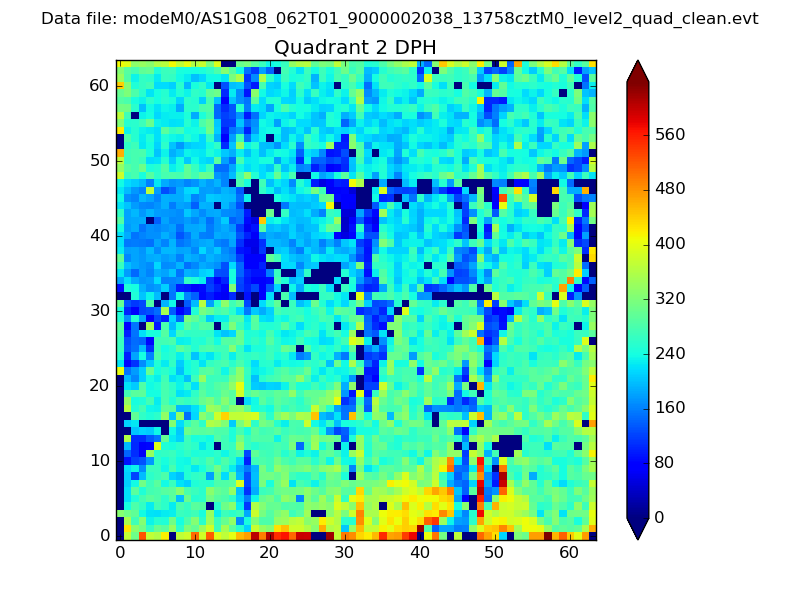
Histogram calculated using DETX and DETY for each event in the final _common_clean file
| Quadrant A | 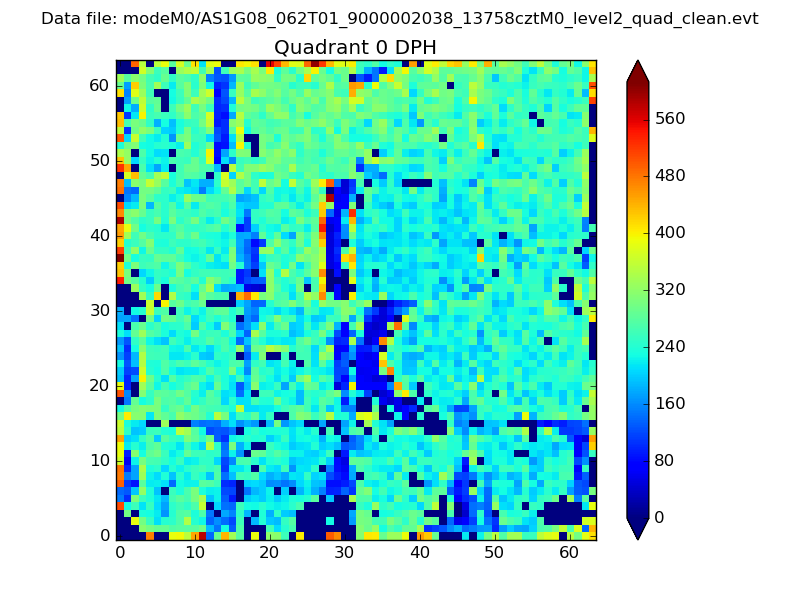 |
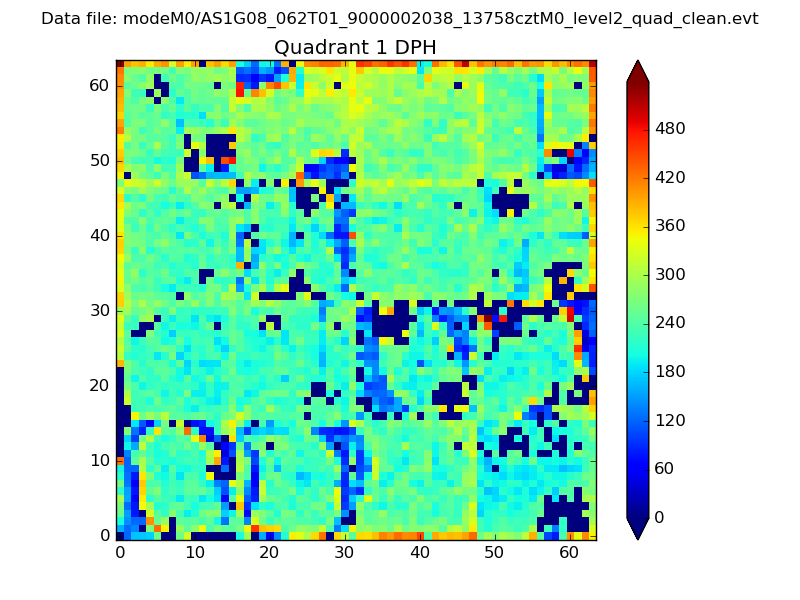 |
Quadrant B |
|---|---|---|---|
| Quadrant D | 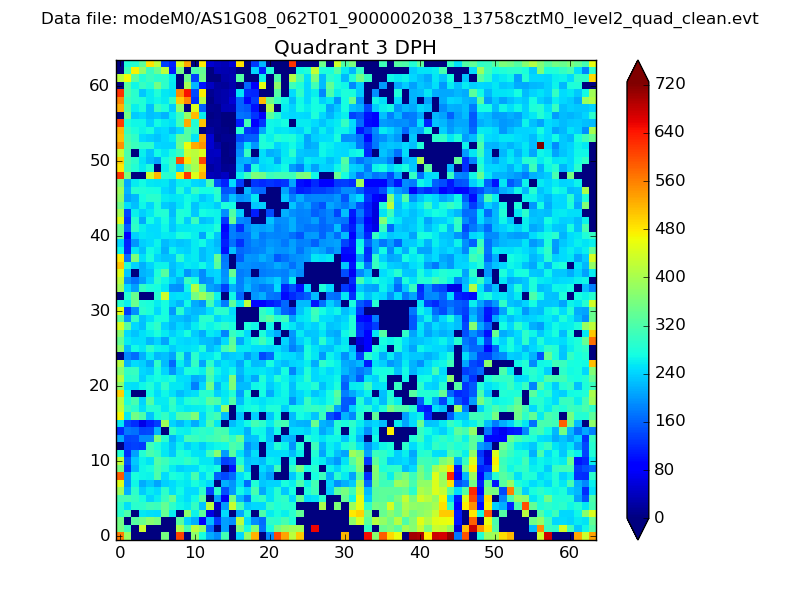 |
 |
Quadrant C |
| Plot type | Count rate plots | Images |
|---|---|---|
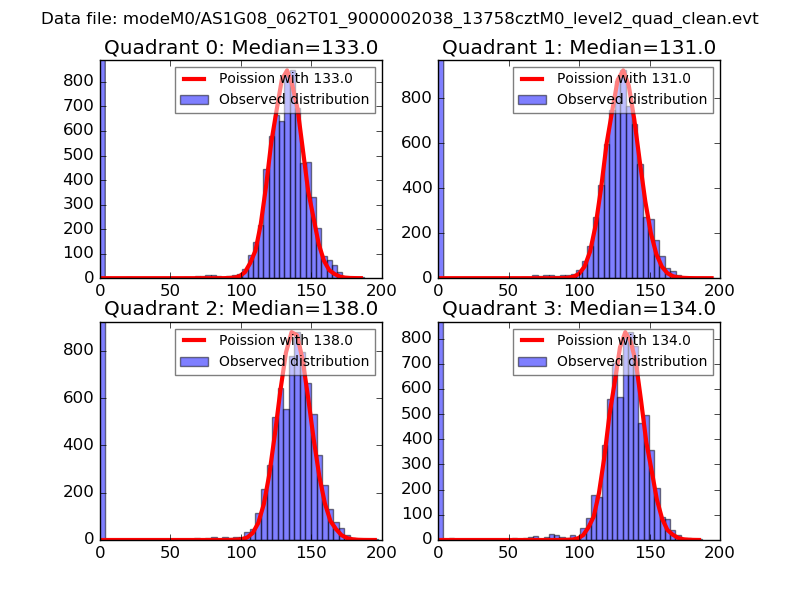
| Comparison with Poisson distribution Blue bars denote a histogram of data divided into 1 sec bins. Red curve is a Poisson curve with rate = median count rate of data. |
 |
 |
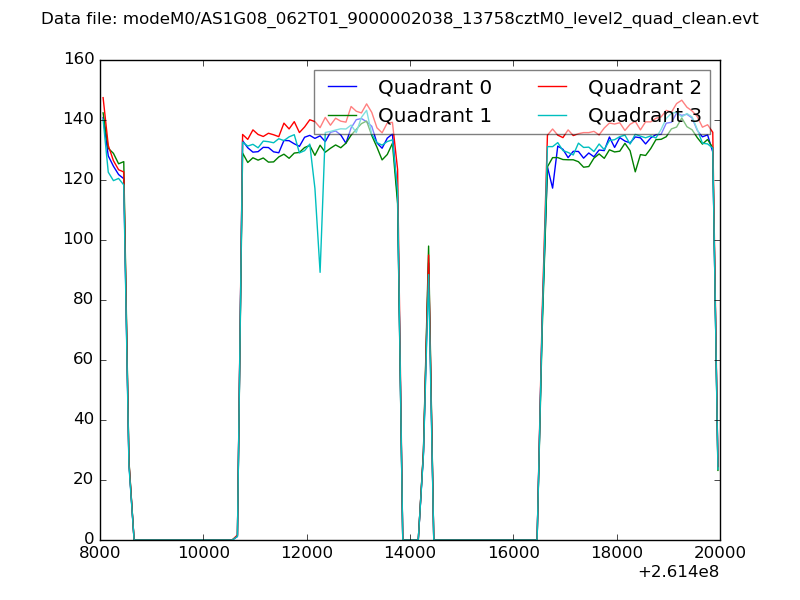
| Quadrant-wise count rates Data is divided into 100 sec bins |
 |
|
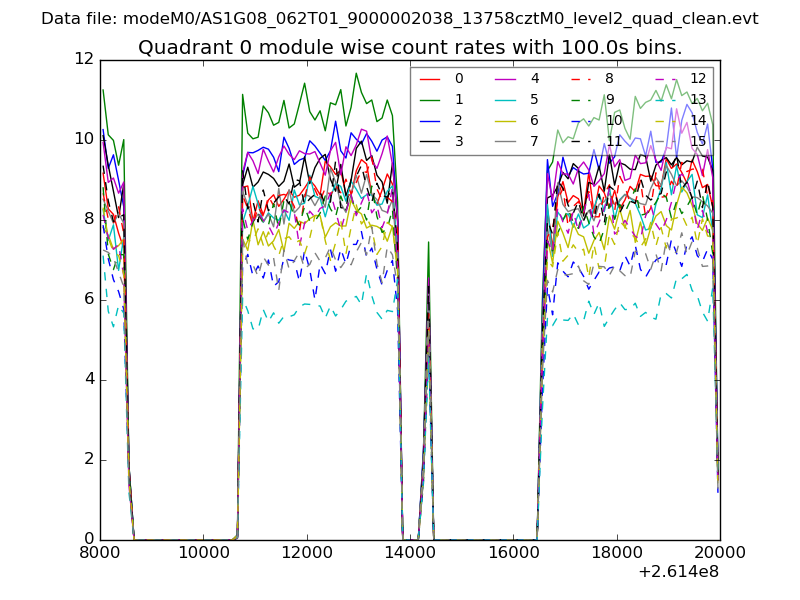
| Module-wise count rates for Quadrant A Data is divided into 100 sec bins |
 |
 |
| Module-wise count rates for Quadrant B Data is divided into 100 sec bins |
 |
 |
| Module-wise count rates for Quadrant C Data is divided into 100 sec bins |
 |
 |
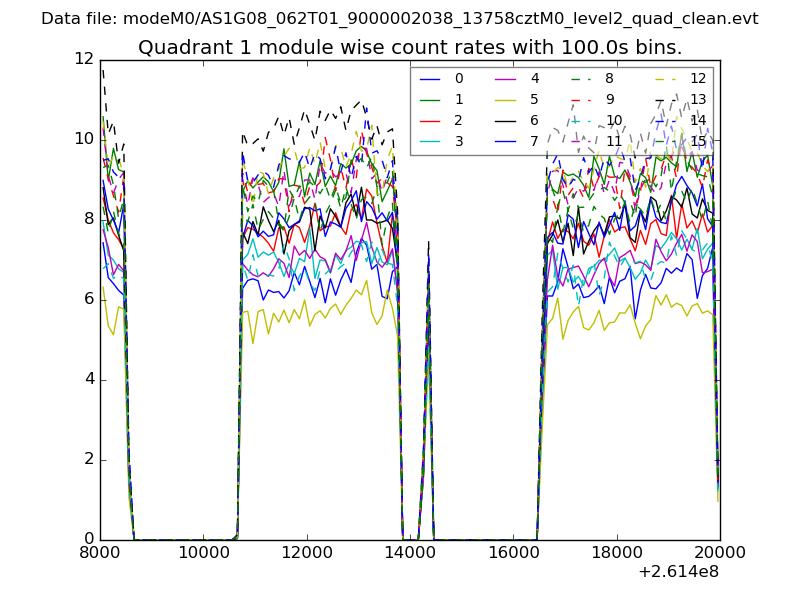
| Module-wise count rates for Quadrant D Data is divided into 100 sec bins |
 |
 |
| Parameter | Plot |
|---|---|
| CZT HV Monitor |  |
| D_VDD | 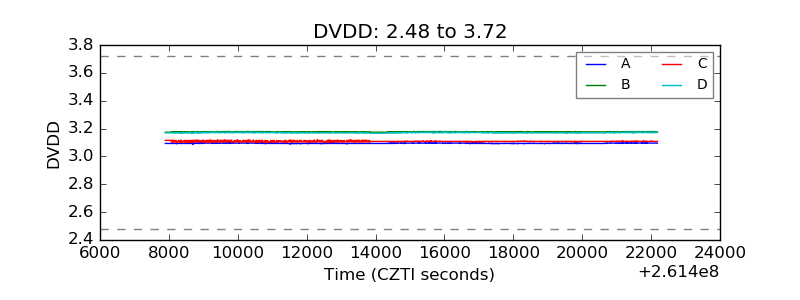 |
| Temperature 1 | 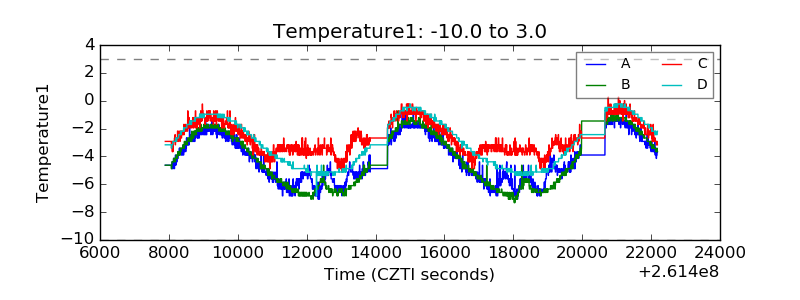 |
| Veto HV Monitor | 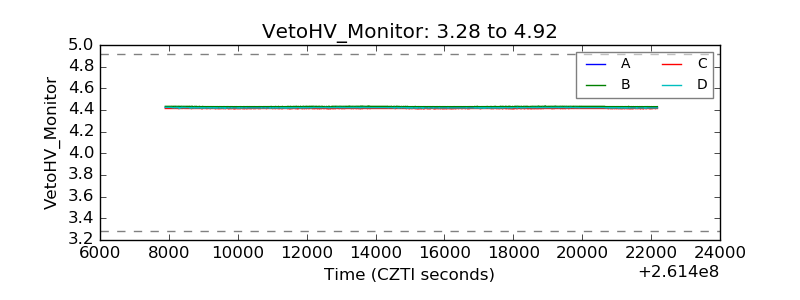 |
| Veto LLD | 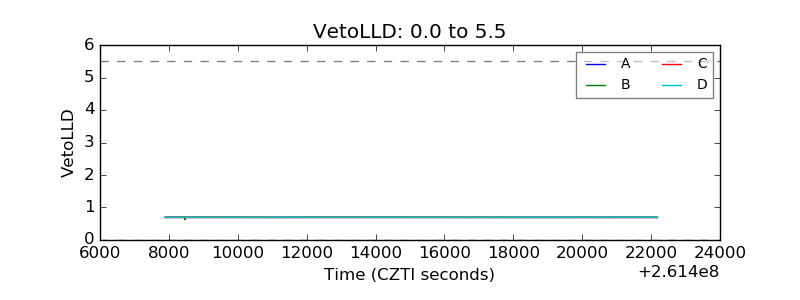 |
| Alpha Counter | 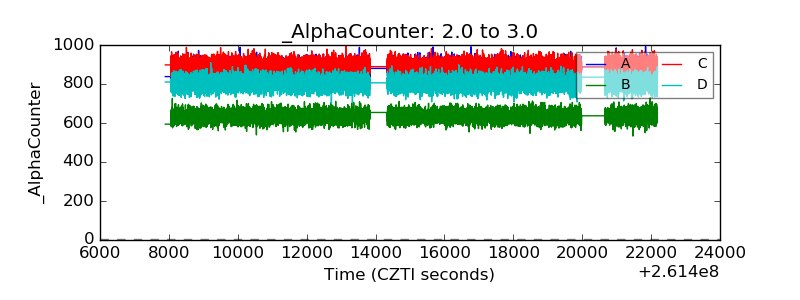 |
| _CPM_Rate | 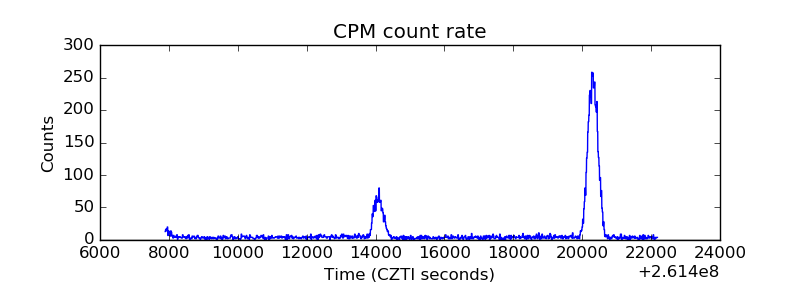 |
| CZT Counter | 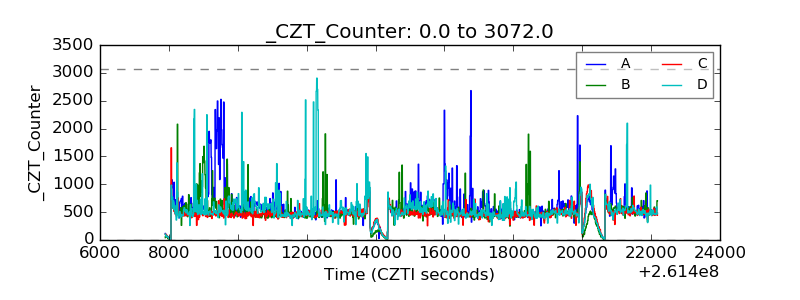 |
| +2.5 Volts monitor |  |
| +5 Volts monitor |  |
| _ROLL_ROT | 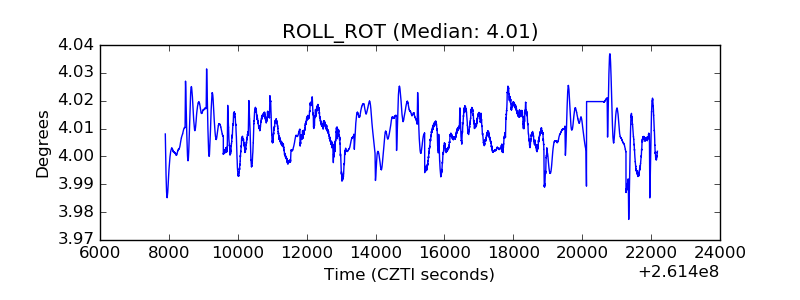 |
| _Roll_DEC |  |
| _Roll_RA | 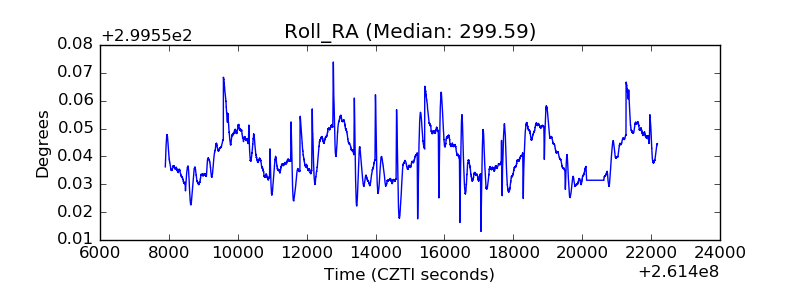 |
| Veto Counter |  |