| Param | Original file | Final file |
|---|---|---|
| Filename | modeM0/AS1G08_062T01_9000002038_13759cztM0_level2.evt | modeM0/AS1G08_062T01_9000002038_13759cztM0_level2_quad_clean.evt |
| Size (bytes) | 495,751,680 | 82,347,840 |
| Size | 472.8 MB | 78.5 MB |
| Events in quadrant A | 3,638,443 | 501,178 |
| Events in quadrant B | 3,697,870 | 490,998 |
| Events in quadrant C | 3,386,620 | 518,631 |
| Events in quadrant D | 3,820,164 | 499,566 |
| Mode M9 | |||
|---|---|---|---|
| Quadrant | BADHDUFLAG | Total packets | Discarded packets |
| A | 0 | 11 | 0 |
| B | 0 | 11 | 0 |
| C | 0 | 11 | 0 |
| D | 0 | 12 | 0 |
| Mode M0 | |||
|---|---|---|---|
| Quadrant | BADHDUFLAG | Total packets | Discarded packets |
| A | 0 | 15237 | 3 |
| B | 0 | 15369 | 2 |
| C | 0 | 14241 | 2 |
| D | 0 | 15785 | 2 |
| Mode SS | |||
|---|---|---|---|
| Quadrant | BADHDUFLAG | Total packets | Discarded packets |
| A | 0 | 142 | 0 |
| B | 0 | 142 | 0 |
| C | 0 | 142 | 0 |
| D | 0 | 142 | 0 |
| Quadrant | Total seconds | Saturated seconds | Saturation percentage |
|---|---|---|---|
| A | 6931 | 79 | 1.139807% |
| B | 6931 | 78 | 1.125379% |
| C | 6931 | 45 | 0.649257% |
| D | 6931 | 95 | 1.370654% |
Noise dominated data is calculated using 1-second bins in cleaned event files. If a bin has >2000 counts, and if more than 50% of those come from <1% of pixels, then it is considered to be noise-dominated and hence unusable.
| Quadrant | # 1 sec bins | Bins with >0 counts | Bins with >2000 counts | High rate bins dominated by noise | Noise dominated (total time) | Noise dominated (detector-on time) | Marked lightcurve |
|---|---|---|---|---|---|---|---|
| A | 7782 | 6933 | 15 | 15 | 0.19% | 0.22% | 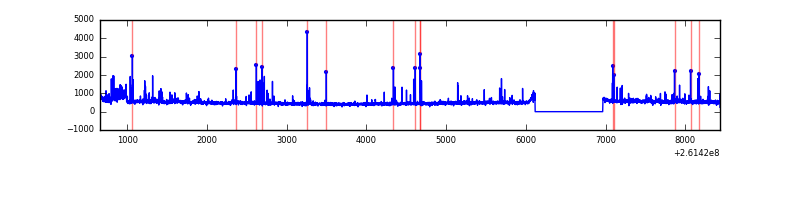 |
| B | 7782 | 6932 | 7 | 7 | 0.09% | 0.10% | 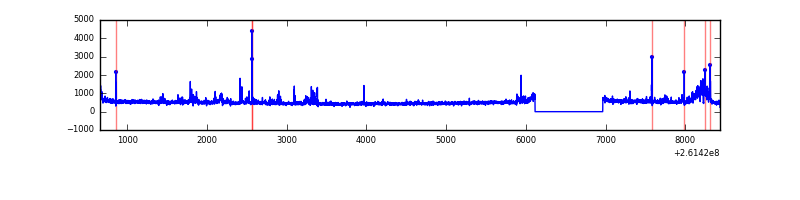 |
| C | 7782 | 6933 | 0 | 0 | 0.00% | 0.00% | 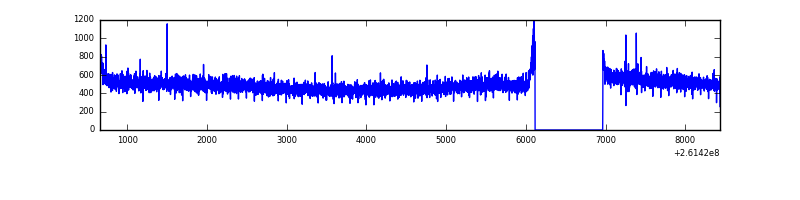 |
| D | 7782 | 6933 | 52 | 52 | 0.67% | 0.75% | 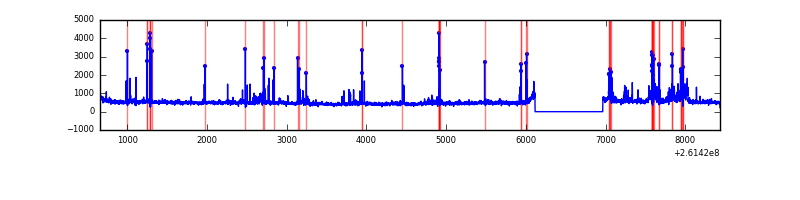 |
Top three noisy pixels from each quadrant. If the there are fewer than three noisy pixels in the level2.evt file, extra rows are filled as -1
| Pixel properties | Quadrant properties | ||||||
|---|---|---|---|---|---|---|---|
| Quadrant | DetID | PixID | Counts | Sigma | Mean | Median | Sigma |
| A | 0 | 23 | 247318 | 1407.17 | 858 | 839 | 175.2 |
| A | 9 | 143 | 37275 | 208.02 | 858 | 839 | 175.2 |
| A | 0 | 226 | 23687 | 130.44 | 858 | 839 | 175.2 |
| B | 0 | 219 | 186500 | 1138.33 | 854 | 834 | 163.1 |
| B | 3 | 64 | 38640 | 231.79 | 854 | 834 | 163.1 |
| B | 4 | 216 | 26311 | 156.2 | 854 | 834 | 163.1 |
| C | 3 | 233 | 100573 | 505.3 | 842 | 846 | 197.4 |
| C | 13 | 61 | 5993 | 26.08 | 842 | 846 | 197.4 |
| C | 12 | 4 | 2518 | 8.47 | 842 | 846 | 197.4 |
| D | 5 | 222 | 317901 | 1528.28 | 838 | 816 | 207.5 |
| D | 10 | 157 | 135658 | 649.91 | 838 | 816 | 207.5 |
| D | 8 | 195 | 105727 | 505.65 | 838 | 816 | 207.5 |
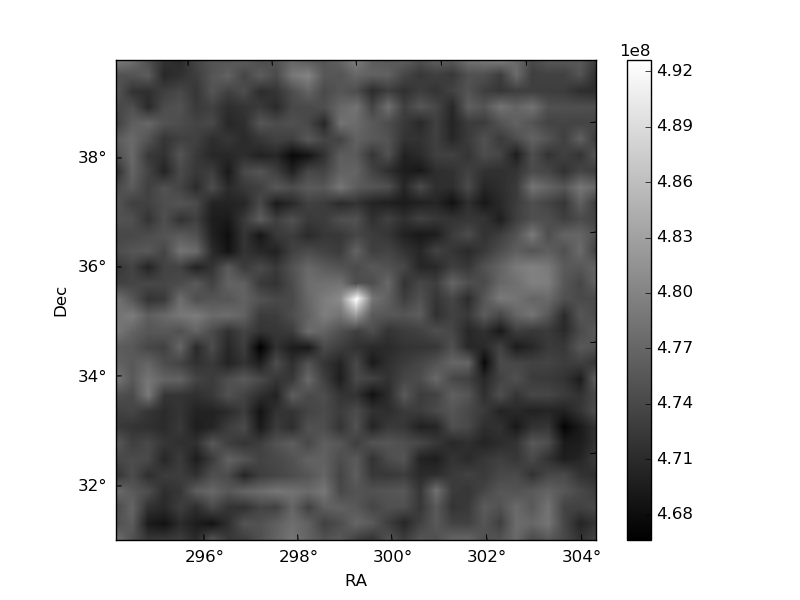
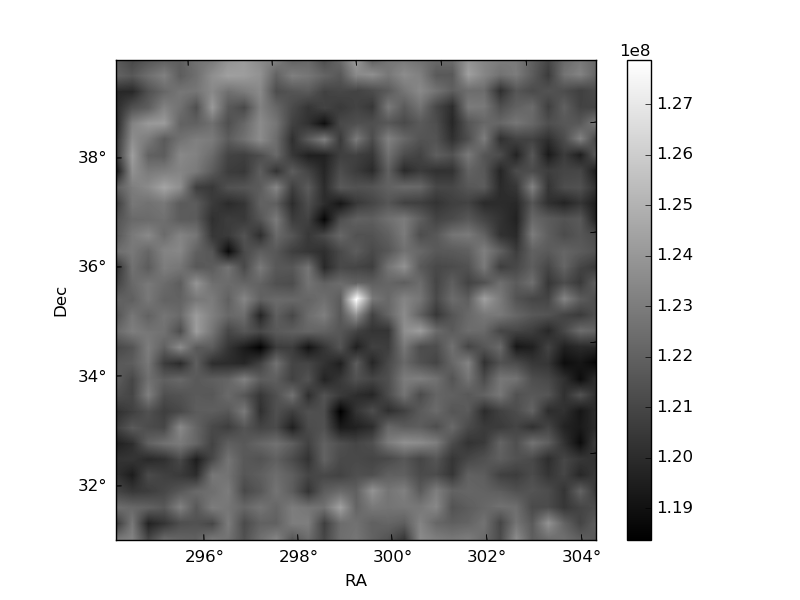
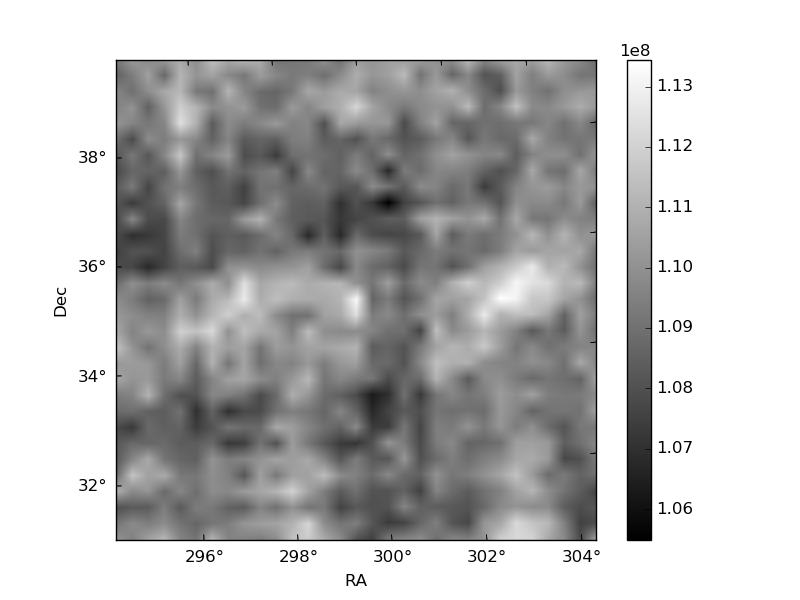
Histogram calculated using DETX and DETY for each event in the final _common_clean file
| Quadrant A | 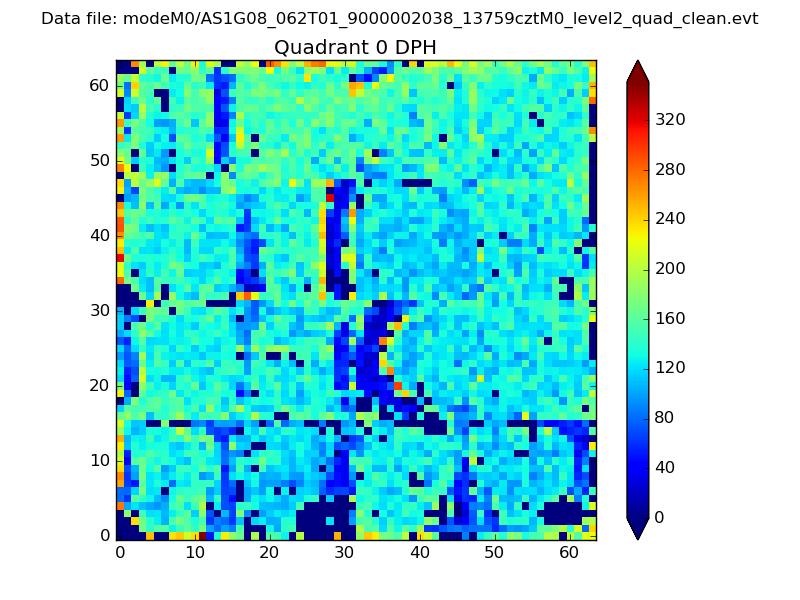 |
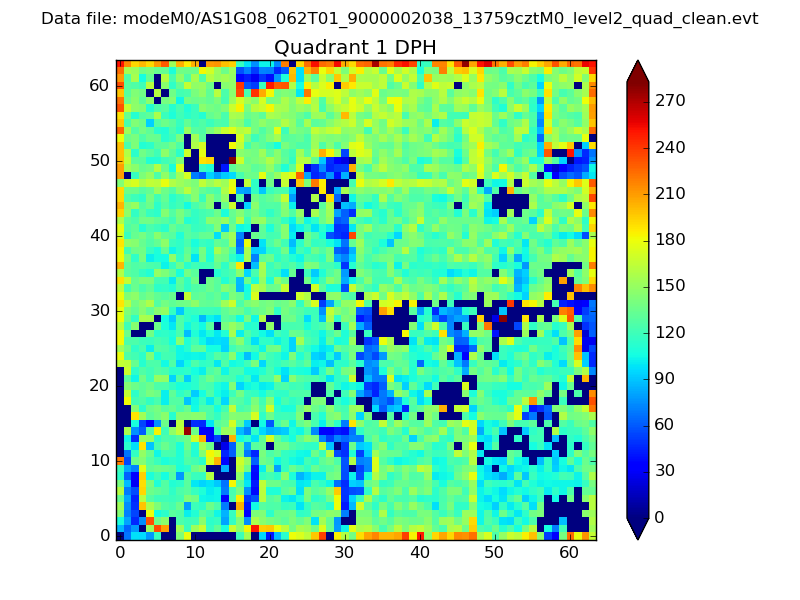 |
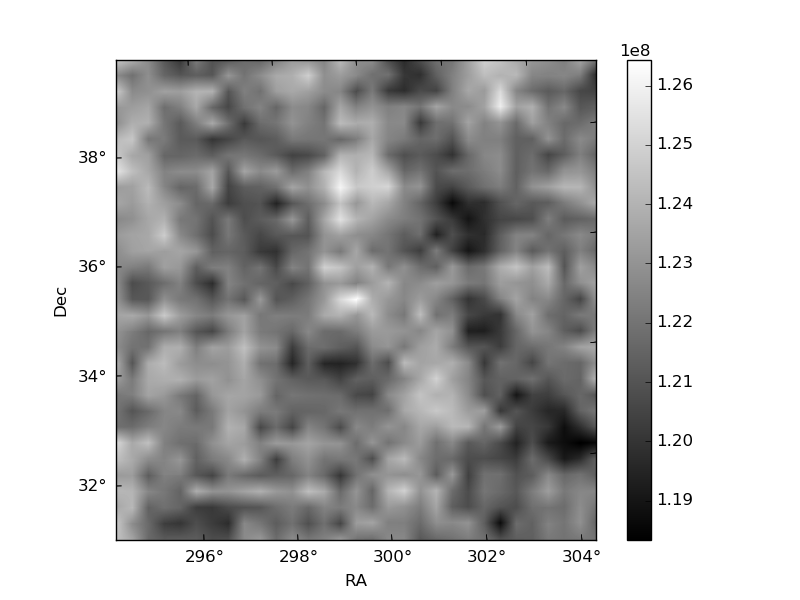
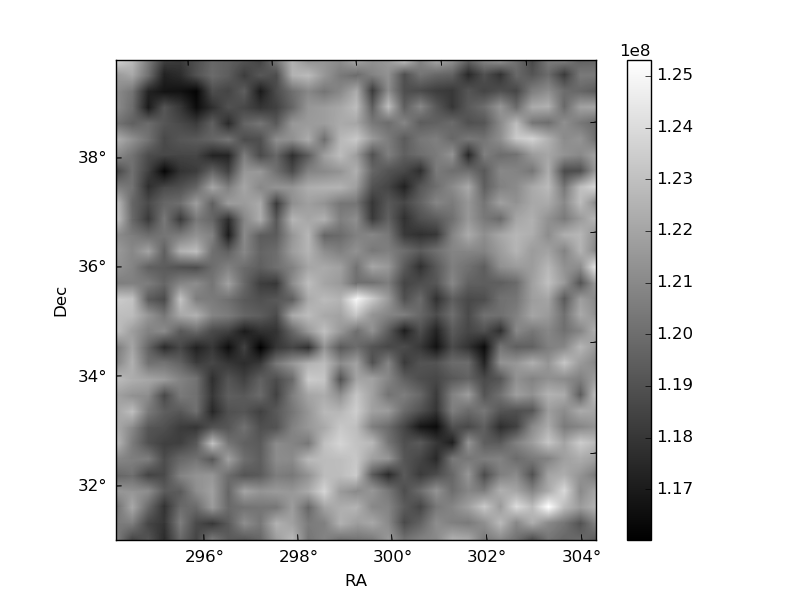
Quadrant B |
|---|---|---|---|
| Quadrant D | 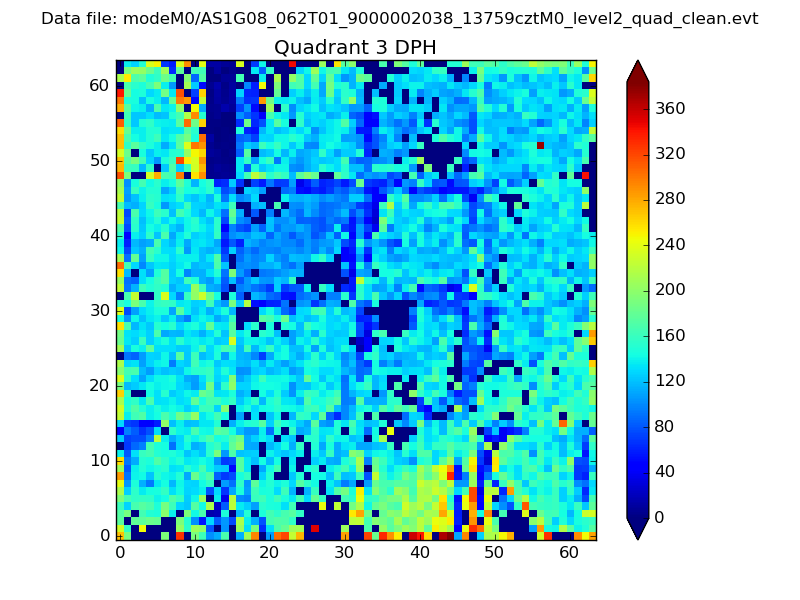 |
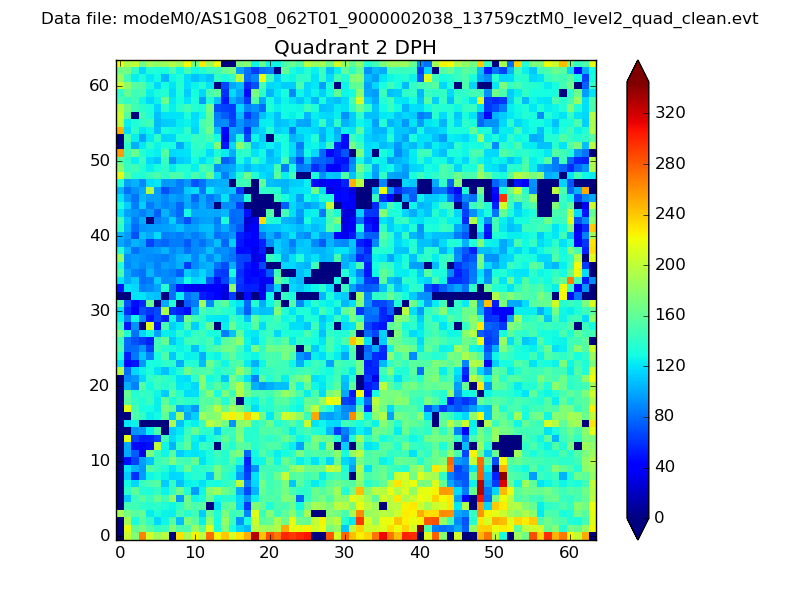 |
Quadrant C |
| Plot type | Count rate plots | Images |
|---|---|---|
| Comparison with Poisson distribution Blue bars denote a histogram of data divided into 1 sec bins. Red curve is a Poisson curve with rate = median count rate of data. |
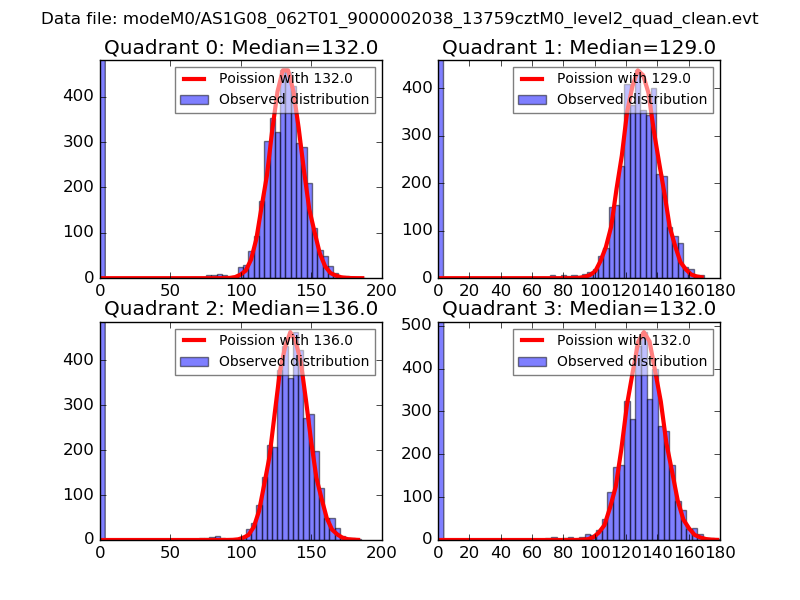 |
 |
| Quadrant-wise count rates Data is divided into 100 sec bins |
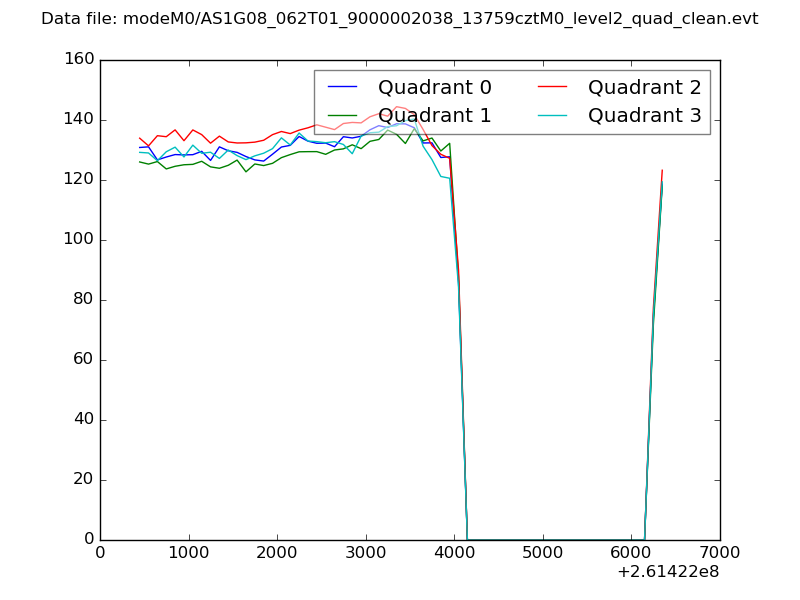 |
|
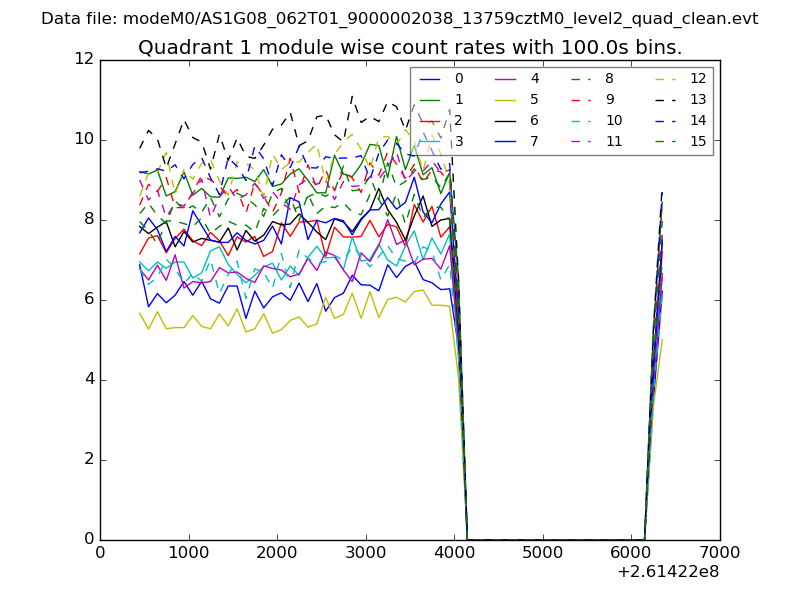
| Module-wise count rates for Quadrant A Data is divided into 100 sec bins |
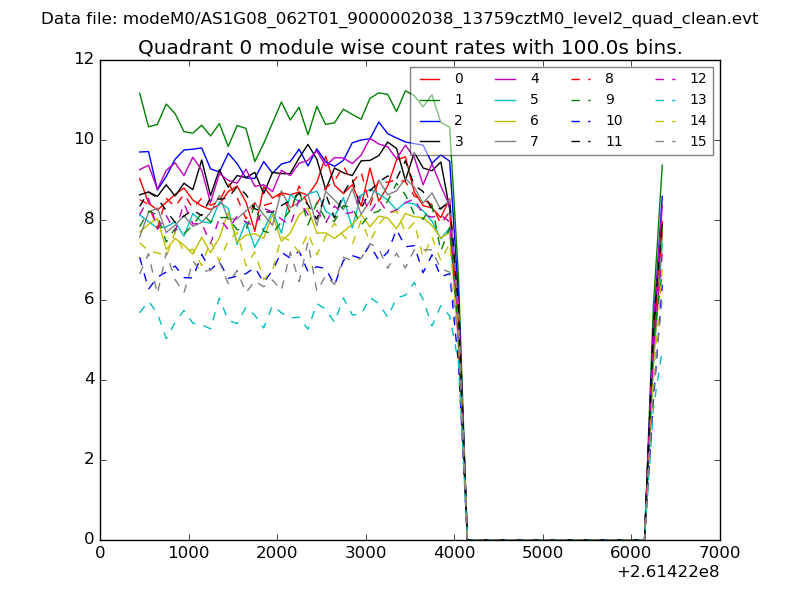 |
 |
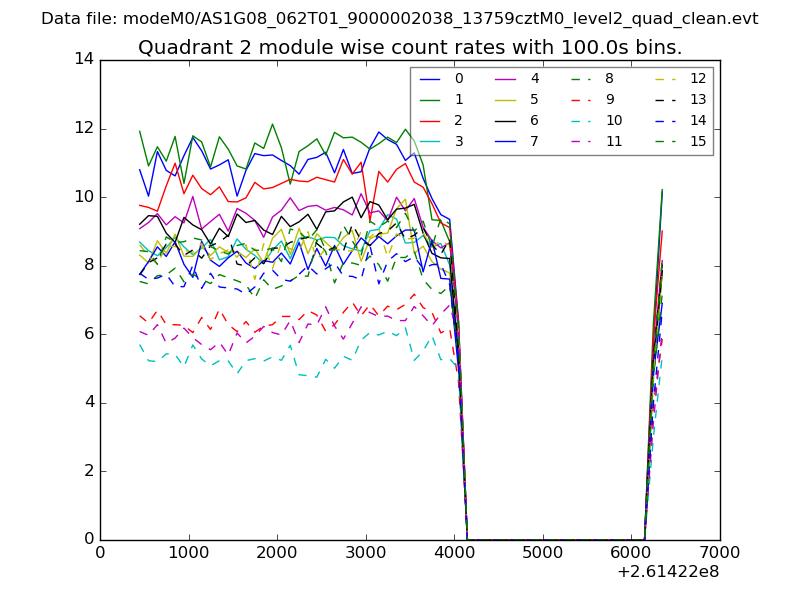
| Module-wise count rates for Quadrant B Data is divided into 100 sec bins |
 |
 |
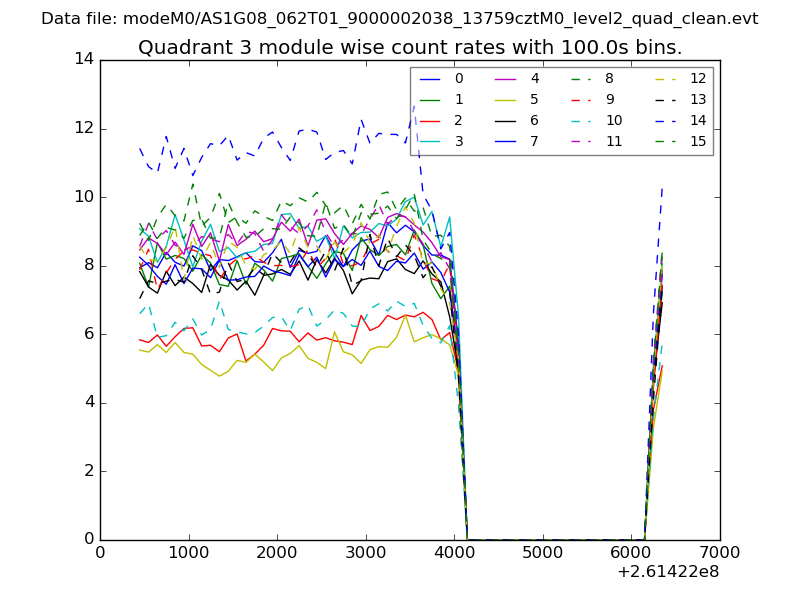
| Module-wise count rates for Quadrant C Data is divided into 100 sec bins |
 |
 |
| Module-wise count rates for Quadrant D Data is divided into 100 sec bins |
 |
 |
| Parameter | Plot |
|---|---|
| CZT HV Monitor | 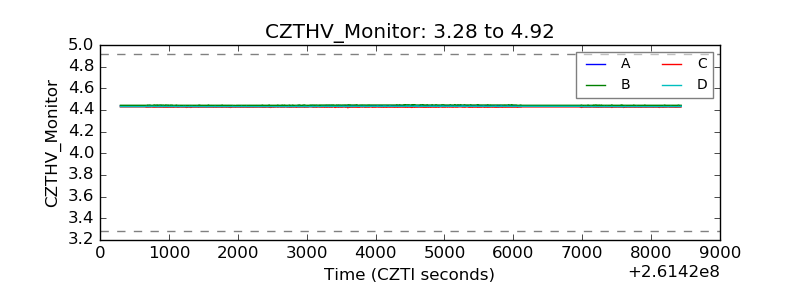 |
| D_VDD | 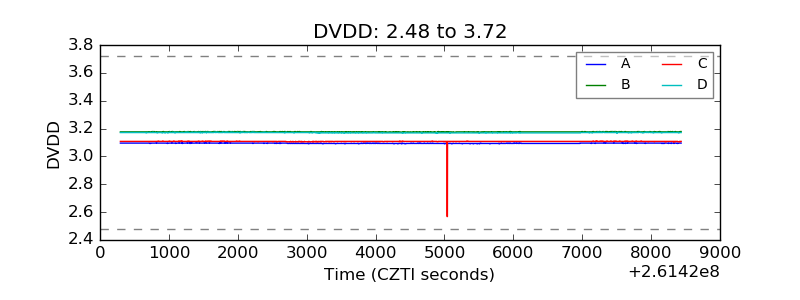 |
| Temperature 1 | 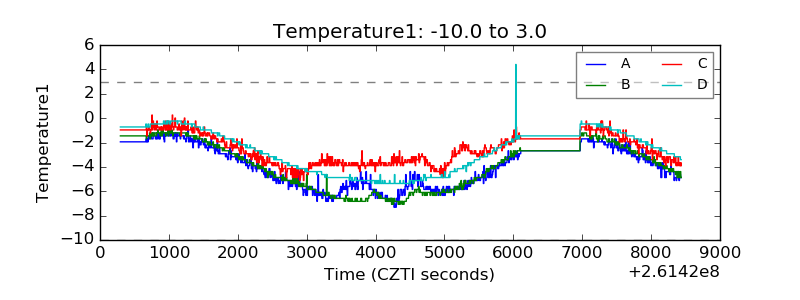 |
| Veto HV Monitor | 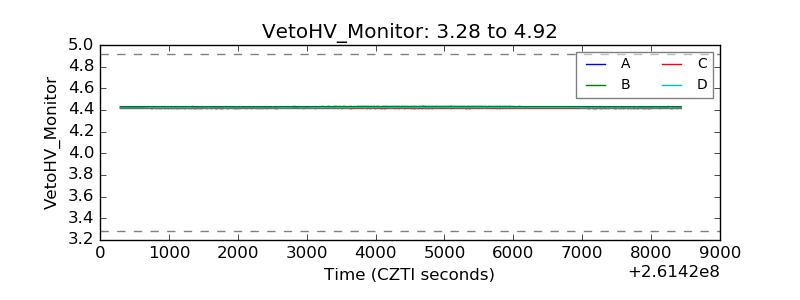 |
| Veto LLD | 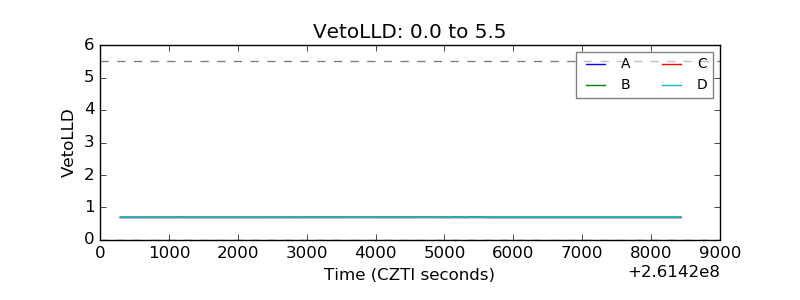 |
| Alpha Counter | 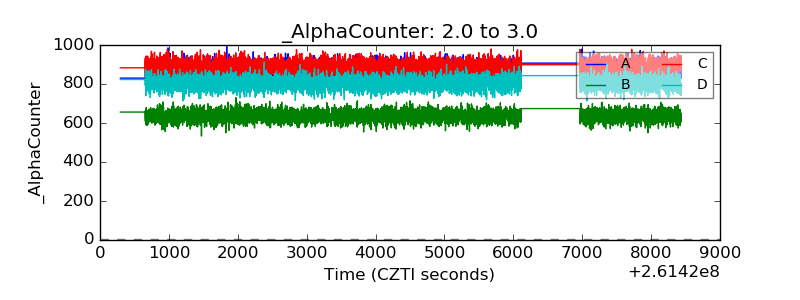 |
| _CPM_Rate | 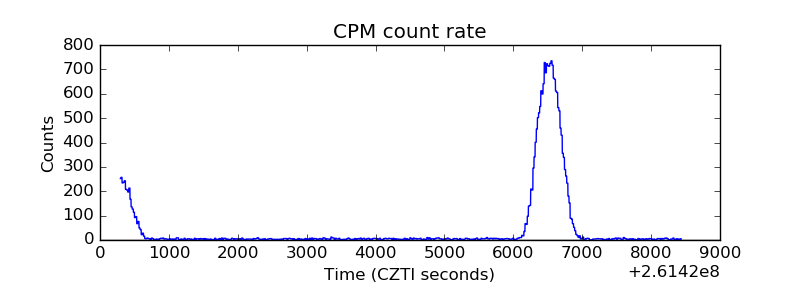 |
| CZT Counter | 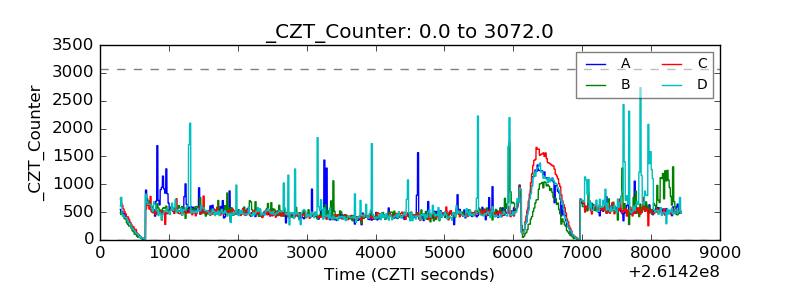 |
| +2.5 Volts monitor |  |
| +5 Volts monitor |  |
| _ROLL_ROT |  |
| _Roll_DEC |  |
| _Roll_RA | 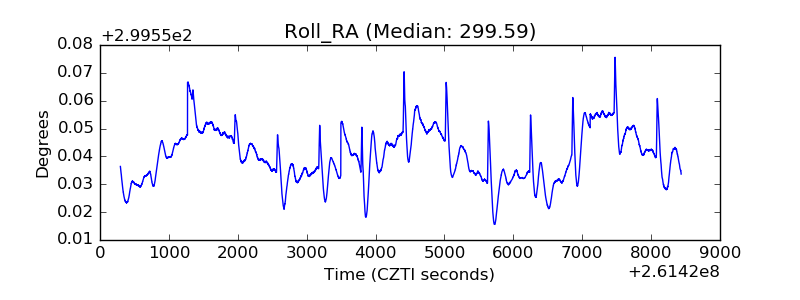 |
| Veto Counter | 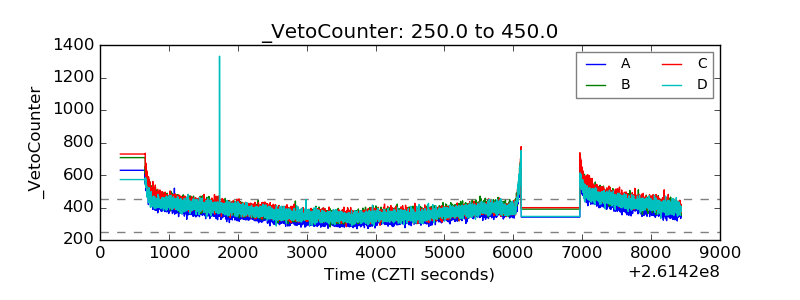 |