| Param | Original file | Final file |
|---|---|---|
| Filename | modeM0/AS1G08_062T01_9000002038_13760cztM0_level2.evt | modeM0/AS1G08_062T01_9000002038_13760cztM0_level2_quad_clean.evt |
| Size (bytes) | 532,558,080 | 86,437,440 |
| Size | 507.9 MB | 82.4 MB |
| Events in quadrant A | 3,446,782 | 537,716 |
| Events in quadrant B | 3,700,260 | 530,255 |
| Events in quadrant C | 3,293,616 | 562,937 |
| Events in quadrant D | 5,238,049 | 523,951 |
| Mode M9 | |||
|---|---|---|---|
| Quadrant | BADHDUFLAG | Total packets | Discarded packets |
| A | 0 | 14 | 0 |
| B | 0 | 14 | 0 |
| C | 0 | 14 | 0 |
| D | 0 | 15 | 0 |
| Mode M0 | |||
|---|---|---|---|
| Quadrant | BADHDUFLAG | Total packets | Discarded packets |
| A | 0 | 14594 | 3 |
| B | 0 | 15430 | 2 |
| C | 0 | 13927 | 2 |
| D | 0 | 20041 | 2 |
| Mode SS | |||
|---|---|---|---|
| Quadrant | BADHDUFLAG | Total packets | Discarded packets |
| A | 0 | 136 | 0 |
| B | 0 | 136 | 0 |
| C | 0 | 136 | 0 |
| D | 0 | 136 | 0 |
| Quadrant | Total seconds | Saturated seconds | Saturation percentage |
|---|---|---|---|
| A | 6631 | 69 | 1.040567% |
| B | 6631 | 87 | 1.312019% |
| C | 6631 | 40 | 0.603227% |
| D | 6631 | 442 | 6.665661% |
Noise dominated data is calculated using 1-second bins in cleaned event files. If a bin has >2000 counts, and if more than 50% of those come from <1% of pixels, then it is considered to be noise-dominated and hence unusable.
| Quadrant | # 1 sec bins | Bins with >0 counts | Bins with >2000 counts | High rate bins dominated by noise | Noise dominated (total time) | Noise dominated (detector-on time) | Marked lightcurve |
|---|---|---|---|---|---|---|---|
| A | 7632 | 6633 | 15 | 15 | 0.20% | 0.23% | 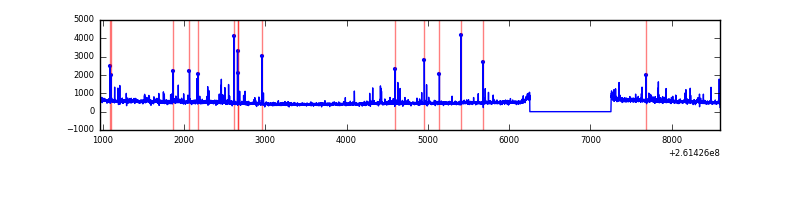 |
| B | 7632 | 6633 | 9 | 9 | 0.12% | 0.14% | 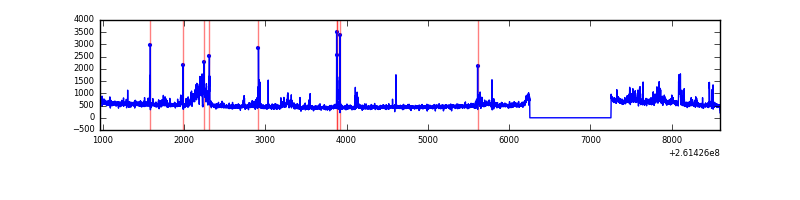 |
| C | 7632 | 6633 | 1 | 1 | 0.01% | 0.02% | 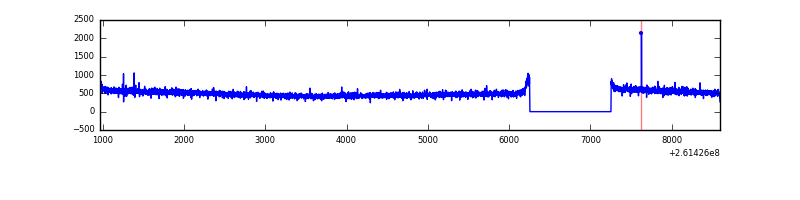 |
| D | 7632 | 6633 | 336 | 336 | 4.40% | 5.07% | 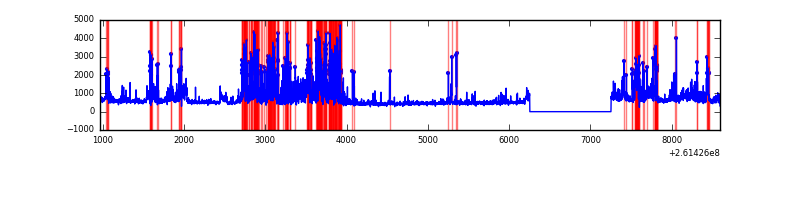 |
Top three noisy pixels from each quadrant. If the there are fewer than three noisy pixels in the level2.evt file, extra rows are filled as -1
| Pixel properties | Quadrant properties | ||||||
|---|---|---|---|---|---|---|---|
| Quadrant | DetID | PixID | Counts | Sigma | Mean | Median | Sigma |
| A | 0 | 23 | 163434 | 961.86 | 827 | 808 | 169.1 |
| A | 15 | 69 | 37567 | 217.41 | 827 | 808 | 169.1 |
| A | 1 | 162 | 23442 | 133.87 | 827 | 808 | 169.1 |
| B | 0 | 219 | 301998 | 1923.6 | 826 | 806 | 156.6 |
| B | 4 | 216 | 37694 | 235.59 | 826 | 806 | 156.6 |
| B | 3 | 64 | 30502 | 189.66 | 826 | 806 | 156.6 |
| C | 3 | 233 | 94936 | 491.03 | 820 | 824 | 191.7 |
| C | 13 | 61 | 5772 | 25.81 | 820 | 824 | 191.7 |
| C | 14 | 234 | 3662 | 14.8 | 820 | 824 | 191.7 |
| D | 5 | 222 | 1863593 | 9566.78 | 797 | 774 | 194.7 |
| D | 10 | 157 | 142517 | 727.94 | 797 | 774 | 194.7 |
| D | 13 | 249 | 111737 | 569.87 | 797 | 774 | 194.7 |
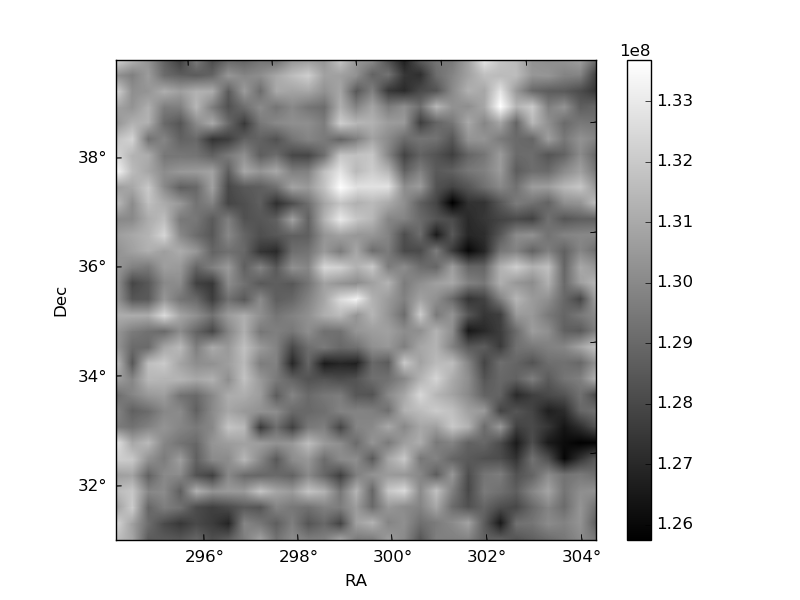
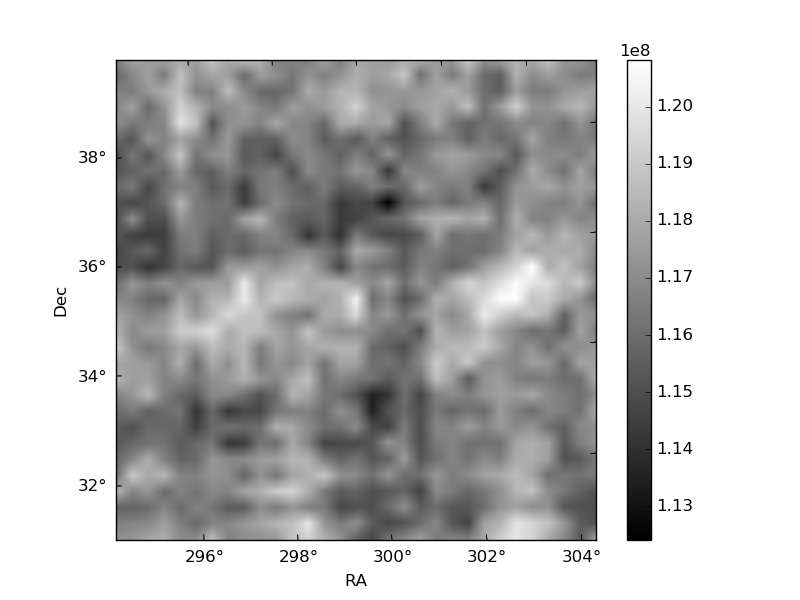
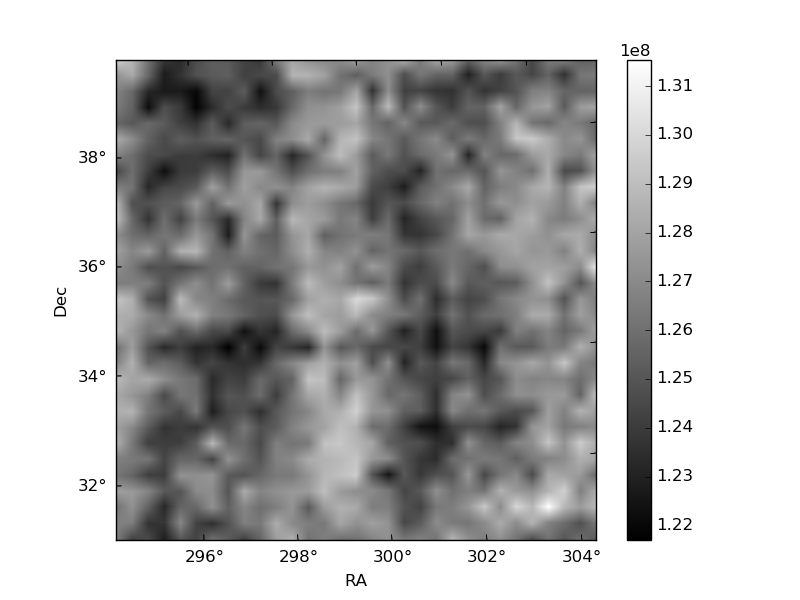
Histogram calculated using DETX and DETY for each event in the final _common_clean file
| Quadrant A | 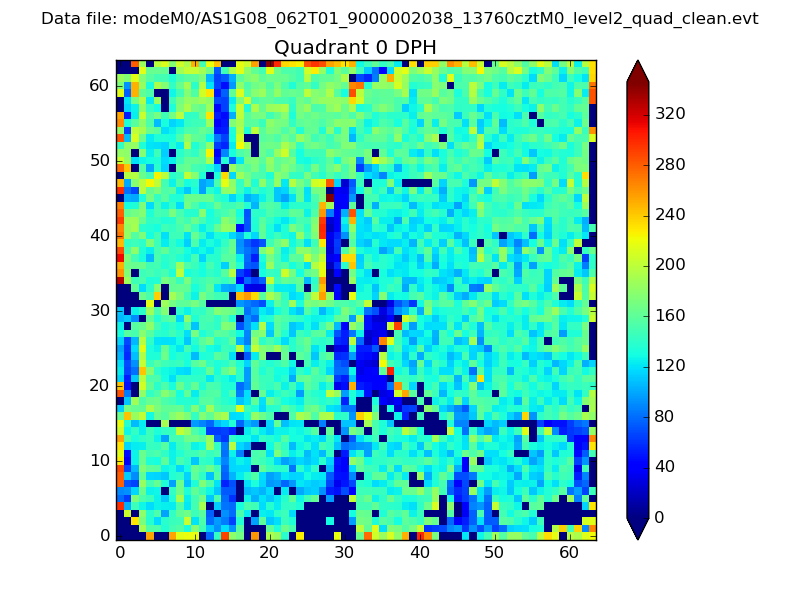 |
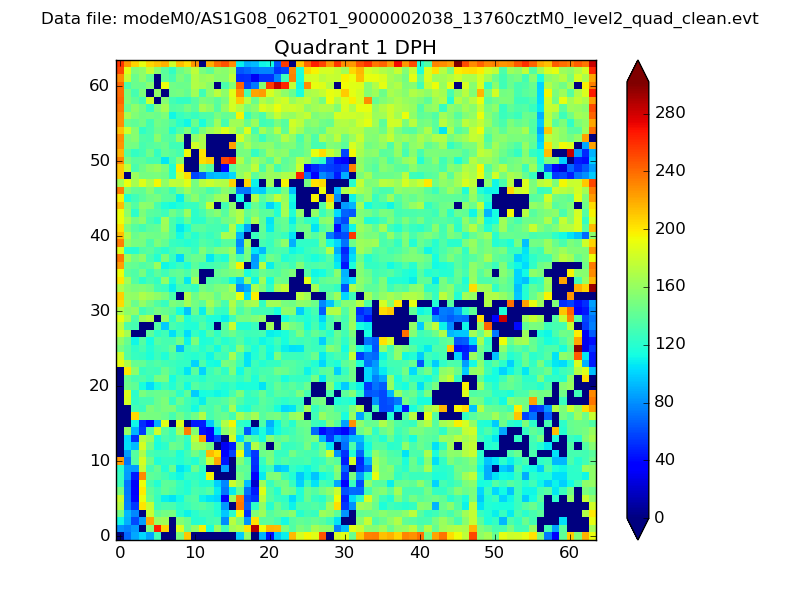 |
Quadrant B |
|---|---|---|---|
| Quadrant D | 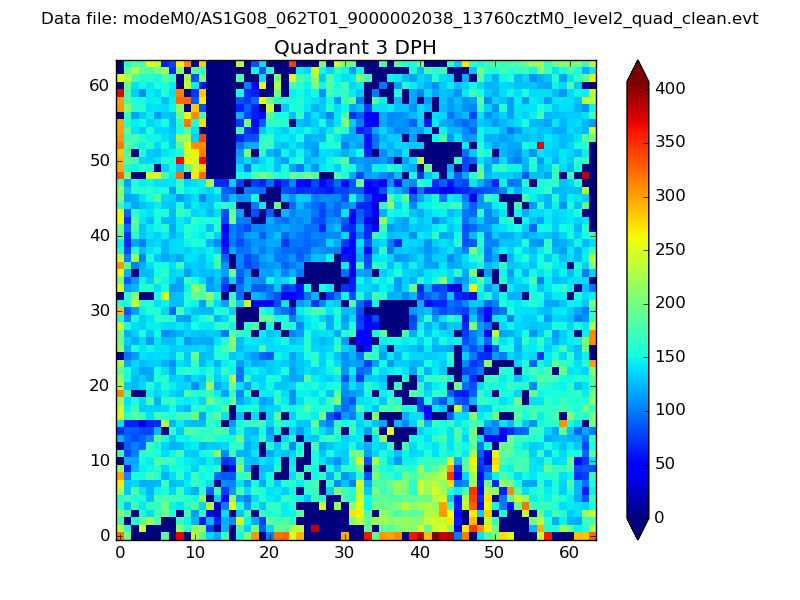 |
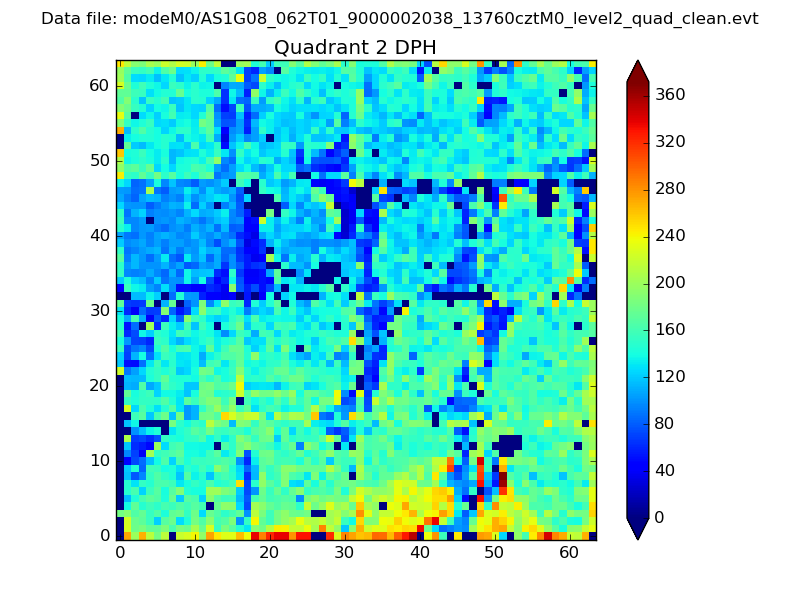 |
Quadrant C |
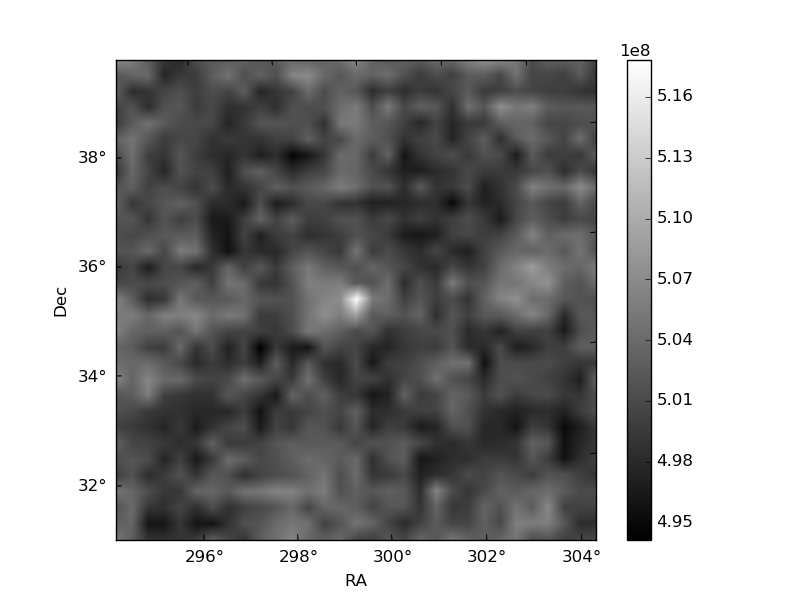
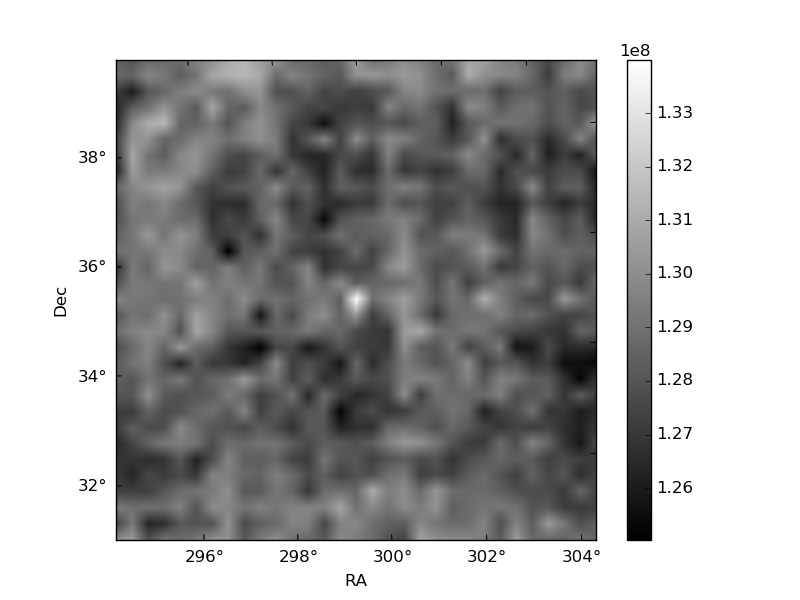
| Plot type | Count rate plots | Images |
|---|---|---|
| Comparison with Poisson distribution Blue bars denote a histogram of data divided into 1 sec bins. Red curve is a Poisson curve with rate = median count rate of data. |
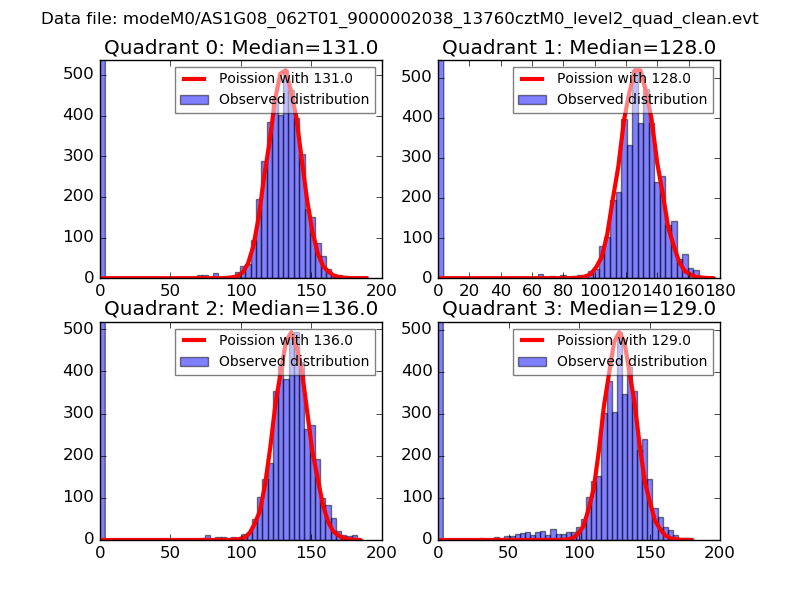 |
 |
| Quadrant-wise count rates Data is divided into 100 sec bins |
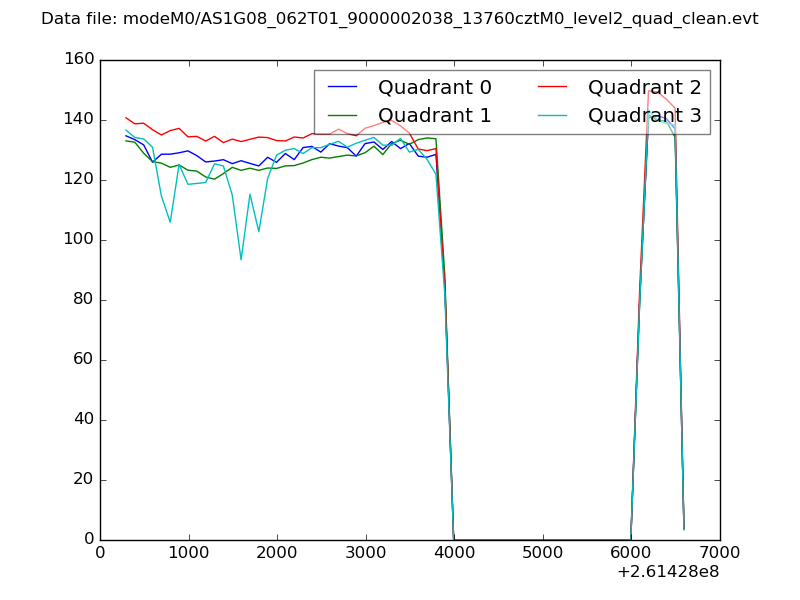 |
|
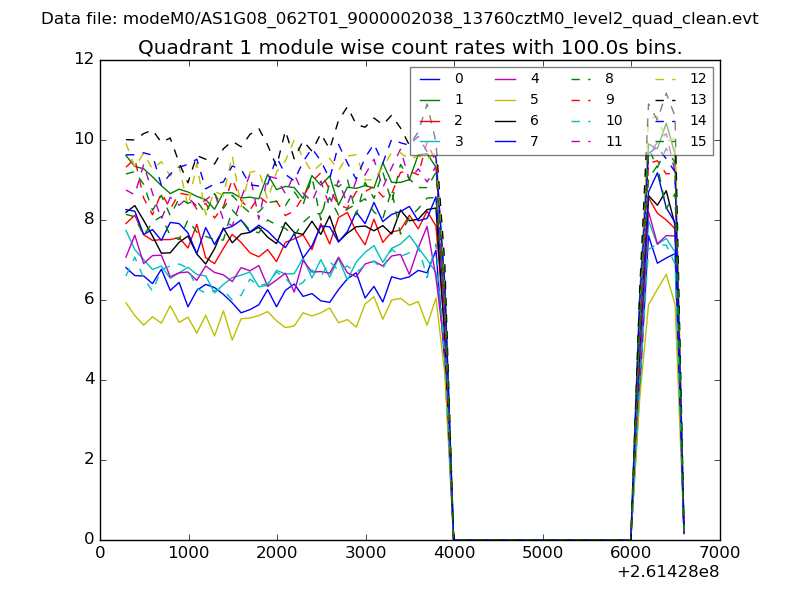
| Module-wise count rates for Quadrant A Data is divided into 100 sec bins |
 |
 |
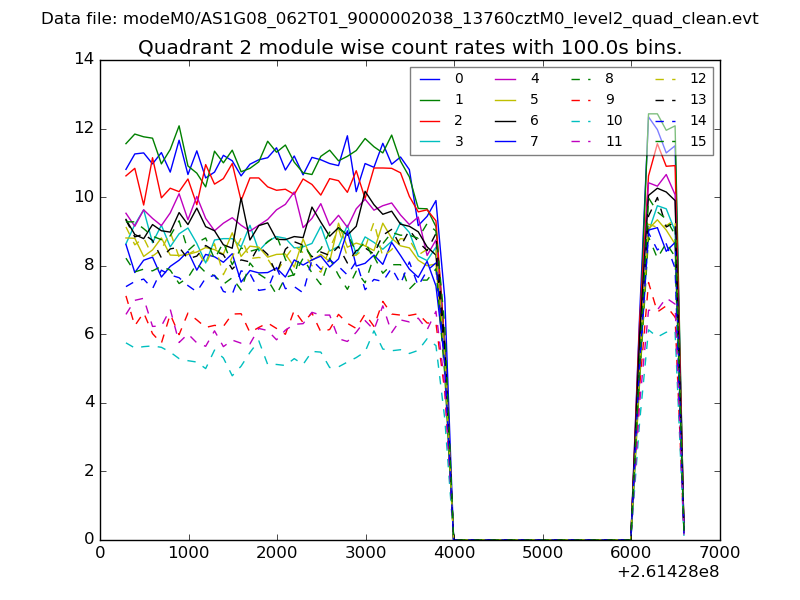
| Module-wise count rates for Quadrant B Data is divided into 100 sec bins |
 |
 |
| Module-wise count rates for Quadrant C Data is divided into 100 sec bins |
 |
 |
| Module-wise count rates for Quadrant D Data is divided into 100 sec bins |
 |
 |
| Parameter | Plot |
|---|---|
| CZT HV Monitor | 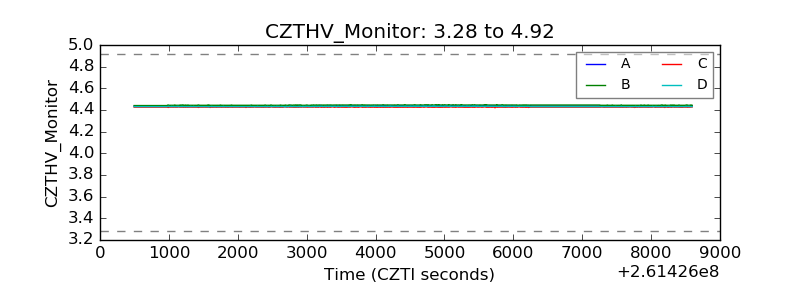 |
| D_VDD |  |
| Temperature 1 |  |
| Veto HV Monitor |  |
| Veto LLD |  |
| Alpha Counter | 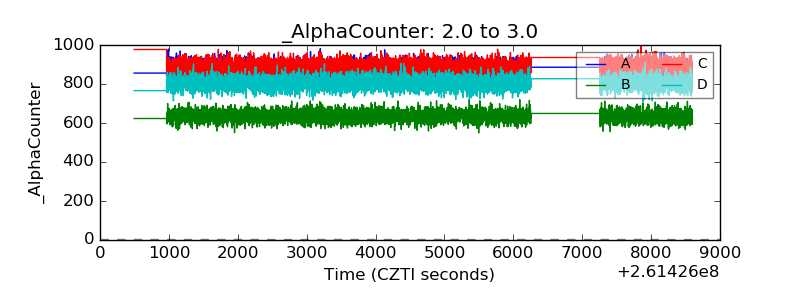 |
| _CPM_Rate | 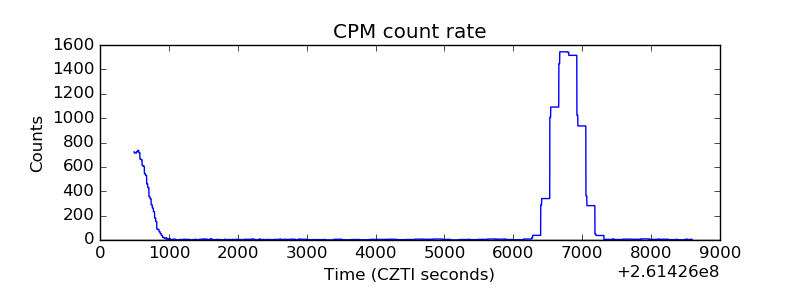 |
| CZT Counter | 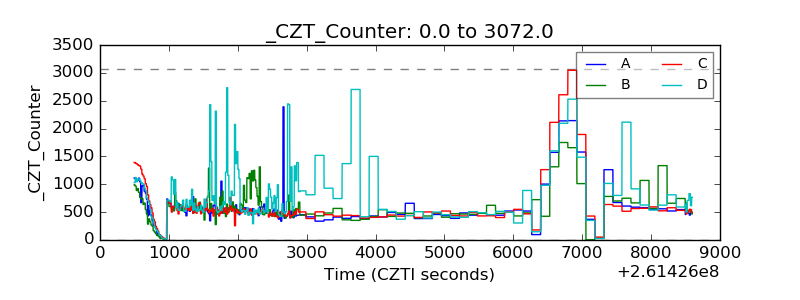 |
| +2.5 Volts monitor | 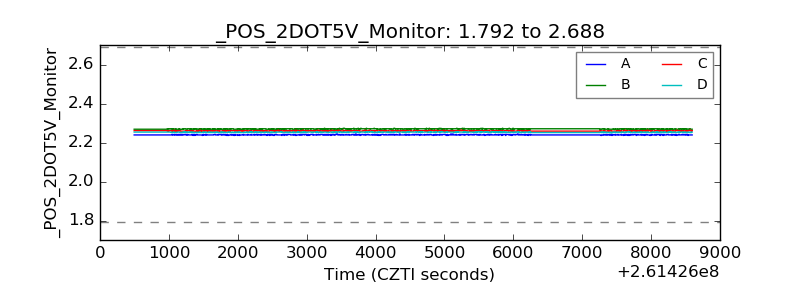 |
| +5 Volts monitor |  |
| _ROLL_ROT |  |
| _Roll_DEC |  |
| _Roll_RA | 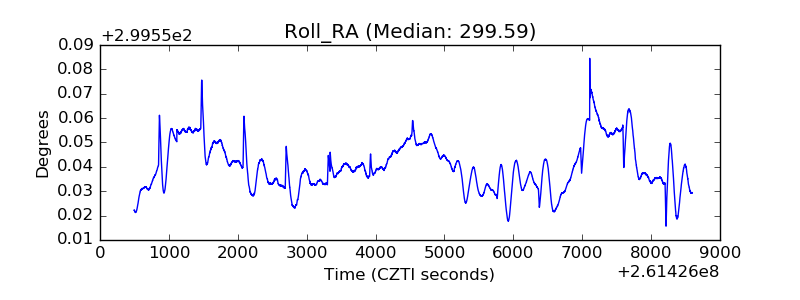 |
| Veto Counter |  |