| Param | Original file | Final file |
|---|---|---|
| Filename | modeM0/AS1G08_062T01_9000002038_13762cztM0_level2.evt | modeM0/AS1G08_062T01_9000002038_13762cztM0_level2_quad_clean.evt |
| Size (bytes) | 476,438,400 | 94,092,480 |
| Size | 454.4 MB | 89.7 MB |
| Events in quadrant A | 3,233,187 | 595,051 |
| Events in quadrant B | 3,455,815 | 588,930 |
| Events in quadrant C | 3,220,613 | 625,224 |
| Events in quadrant D | 4,089,272 | 597,994 |
| Mode M9 | |||
|---|---|---|---|
| Quadrant | BADHDUFLAG | Total packets | Discarded packets |
| A | 0 | 14 | 0 |
| B | 0 | 14 | 0 |
| C | 0 | 14 | 0 |
| D | 0 | 15 | 0 |
| Mode M0 | |||
|---|---|---|---|
| Quadrant | BADHDUFLAG | Total packets | Discarded packets |
| A | 0 | 13880 | 3 |
| B | 0 | 14664 | 2 |
| C | 0 | 13692 | 2 |
| D | 0 | 16400 | 2 |
| Mode SS | |||
|---|---|---|---|
| Quadrant | BADHDUFLAG | Total packets | Discarded packets |
| A | 0 | 130 | 0 |
| B | 0 | 130 | 0 |
| C | 0 | 130 | 0 |
| D | 0 | 130 | 0 |
| Quadrant | Total seconds | Saturated seconds | Saturation percentage |
|---|---|---|---|
| A | 6333 | 40 | 0.631612% |
| B | 6333 | 78 | 1.231644% |
| C | 6333 | 30 | 0.473709% |
| D | 6333 | 208 | 3.284383% |
Noise dominated data is calculated using 1-second bins in cleaned event files. If a bin has >2000 counts, and if more than 50% of those come from <1% of pixels, then it is considered to be noise-dominated and hence unusable.
| Quadrant | # 1 sec bins | Bins with >0 counts | Bins with >2000 counts | High rate bins dominated by noise | Noise dominated (total time) | Noise dominated (detector-on time) | Marked lightcurve |
|---|---|---|---|---|---|---|---|
| A | 7464 | 6335 | 6 | 6 | 0.08% | 0.09% | 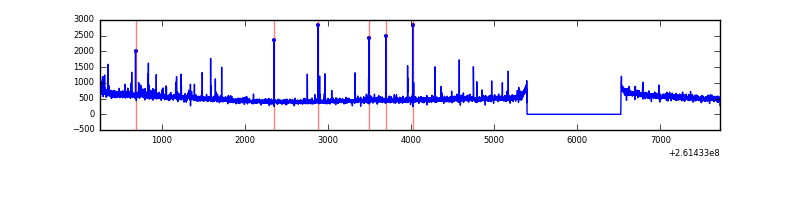 |
| B | 7464 | 6335 | 9 | 9 | 0.12% | 0.14% | 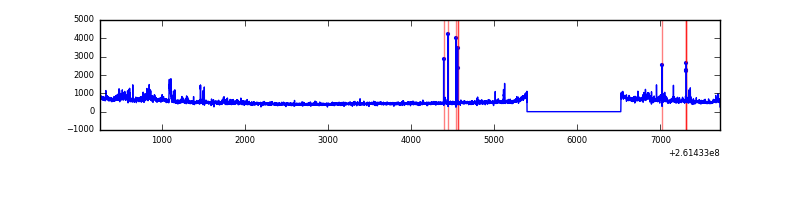 |
| C | 7464 | 6335 | 1 | 1 | 0.01% | 0.02% | 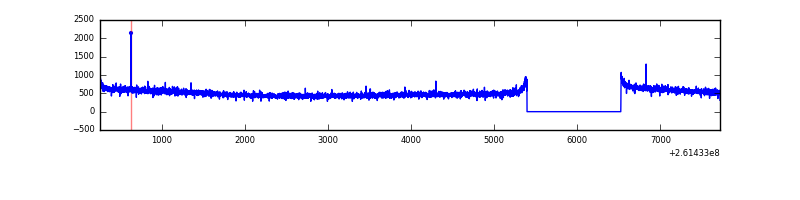 |
| D | 7464 | 6335 | 93 | 93 | 1.25% | 1.47% | 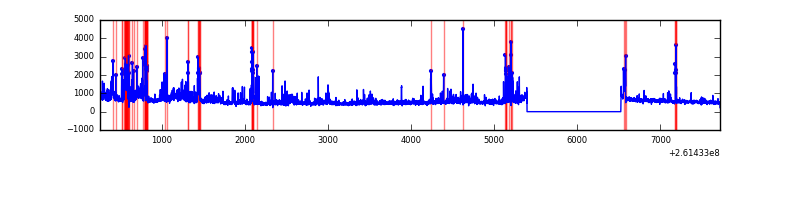 |
Top three noisy pixels from each quadrant. If the there are fewer than three noisy pixels in the level2.evt file, extra rows are filled as -1
| Pixel properties | Quadrant properties | ||||||
|---|---|---|---|---|---|---|---|
| Quadrant | DetID | PixID | Counts | Sigma | Mean | Median | Sigma |
| A | 0 | 23 | 111467 | 678.0 | 801 | 784 | 163.2 |
| A | 0 | 226 | 14151 | 81.88 | 801 | 784 | 163.2 |
| A | 8 | 15 | 13779 | 79.6 | 801 | 784 | 163.2 |
| B | 0 | 219 | 153545 | 1009.86 | 800 | 781 | 151.3 |
| B | 4 | 142 | 43535 | 282.63 | 800 | 781 | 151.3 |
| B | 4 | 216 | 42612 | 276.53 | 800 | 781 | 151.3 |
| C | 3 | 233 | 100499 | 535.48 | 799 | 807 | 186.2 |
| C | 13 | 61 | 5688 | 26.22 | 799 | 807 | 186.2 |
| C | 7 | 238 | 3841 | 16.3 | 799 | 807 | 186.2 |
| D | 5 | 222 | 683198 | 3567.47 | 782 | 759 | 191.3 |
| D | 13 | 249 | 184432 | 960.16 | 782 | 759 | 191.3 |
| D | 10 | 157 | 139277 | 724.11 | 782 | 759 | 191.3 |
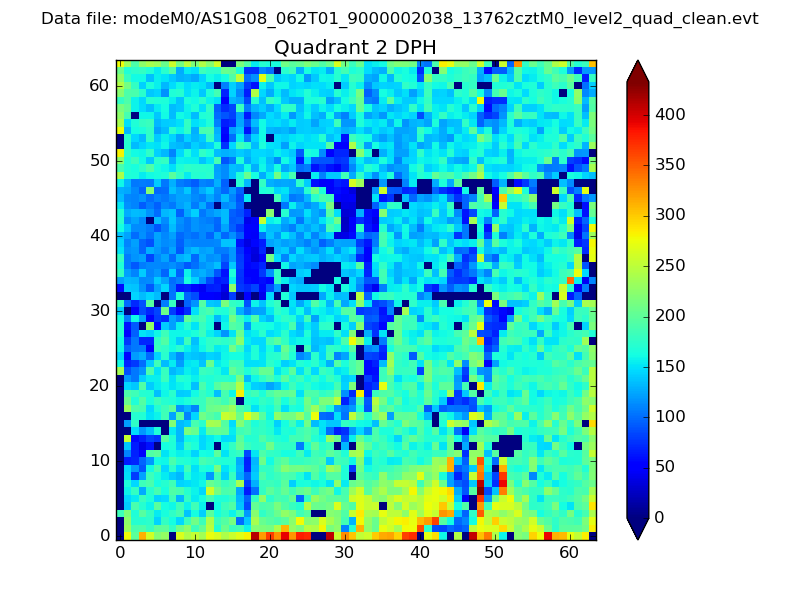
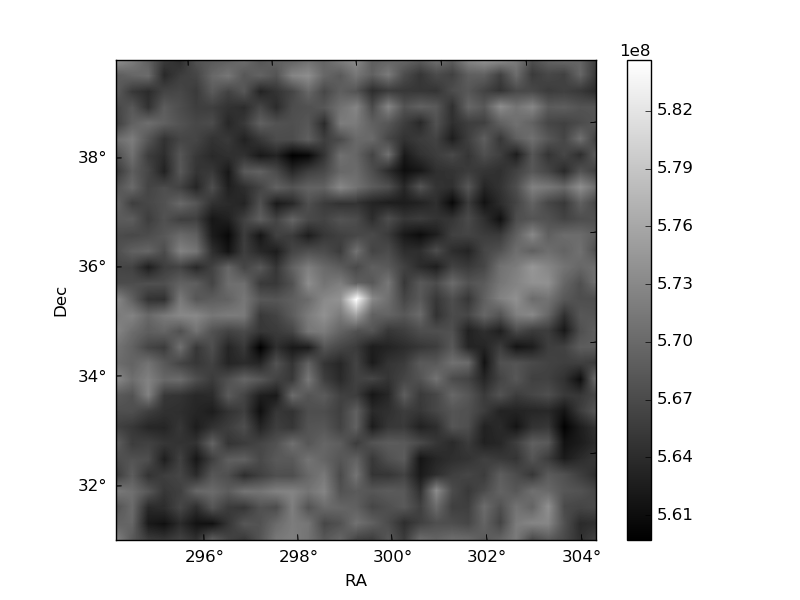
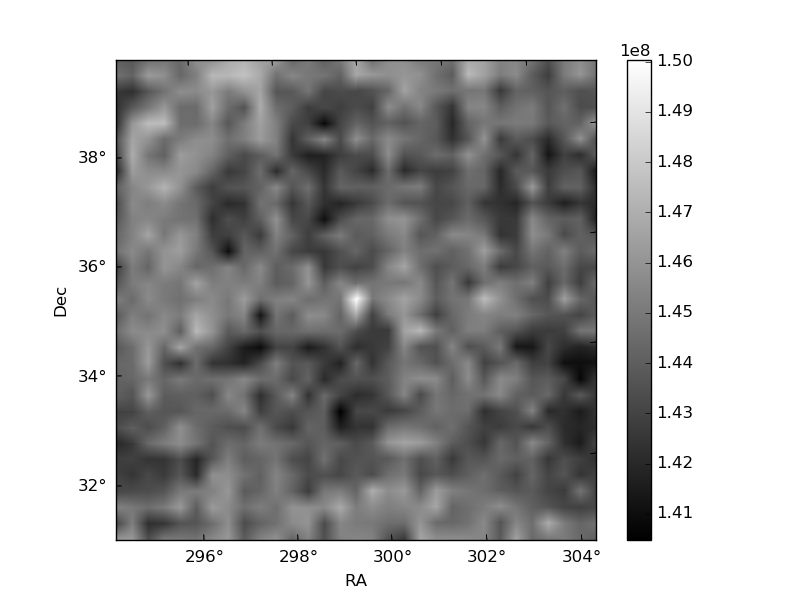
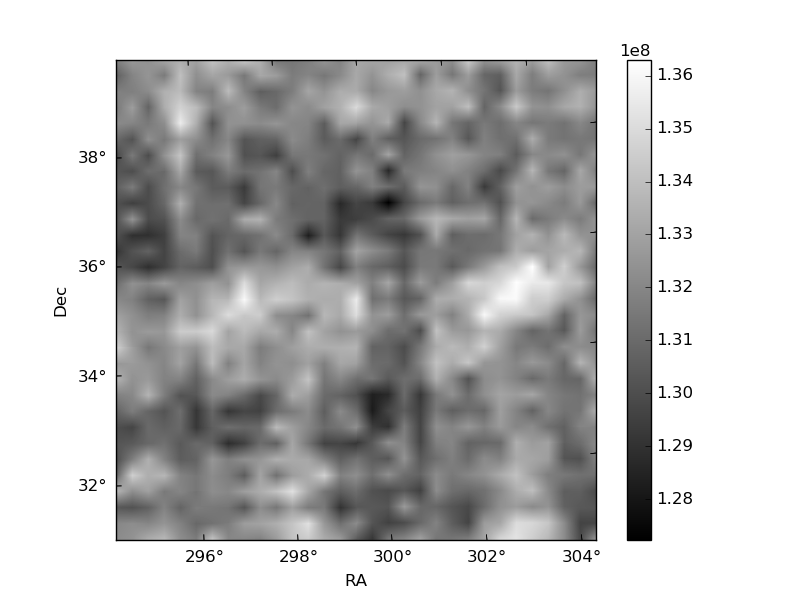
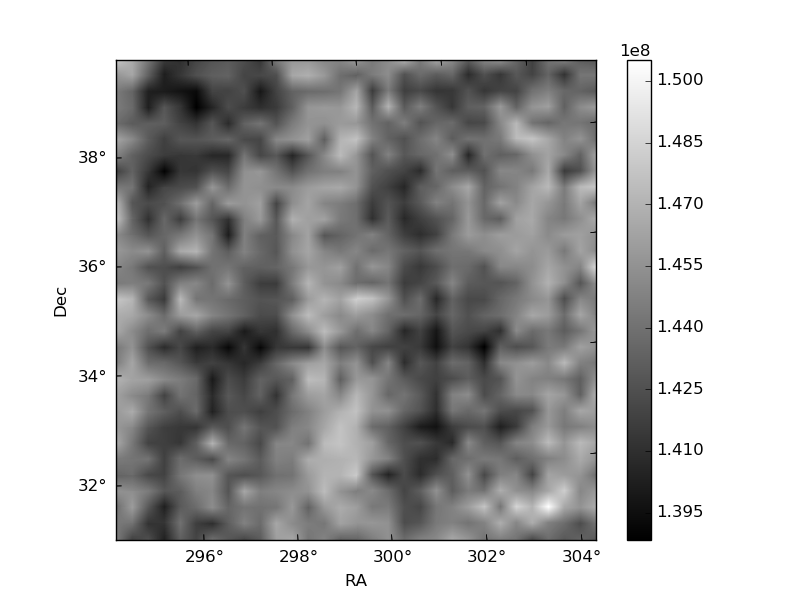
Histogram calculated using DETX and DETY for each event in the final _common_clean file
| Quadrant A | 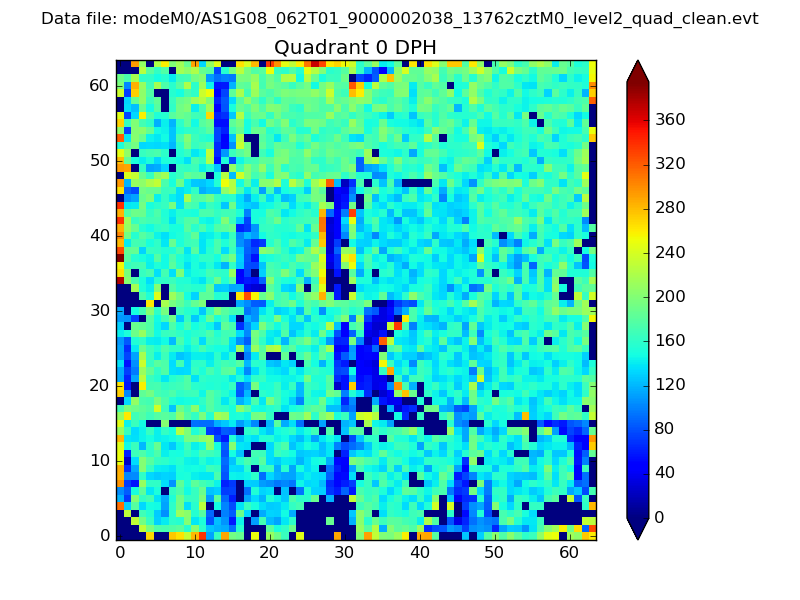 |
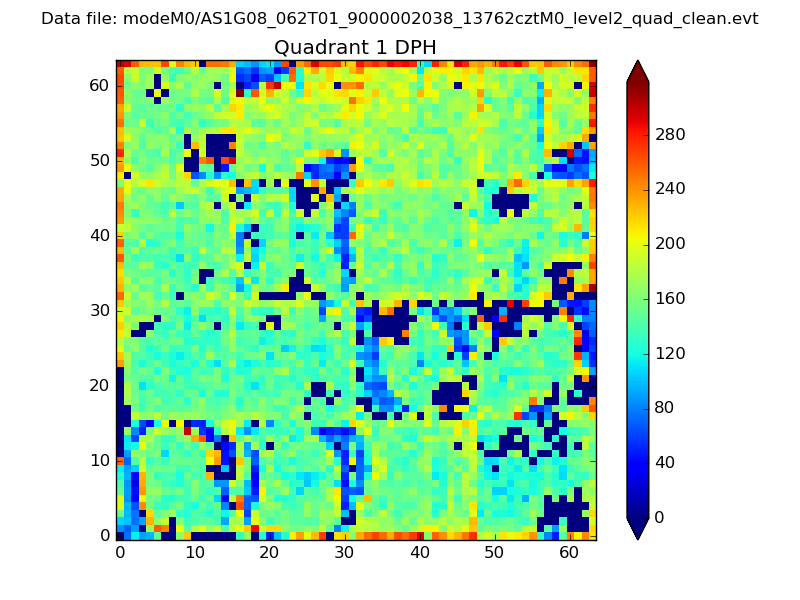 |
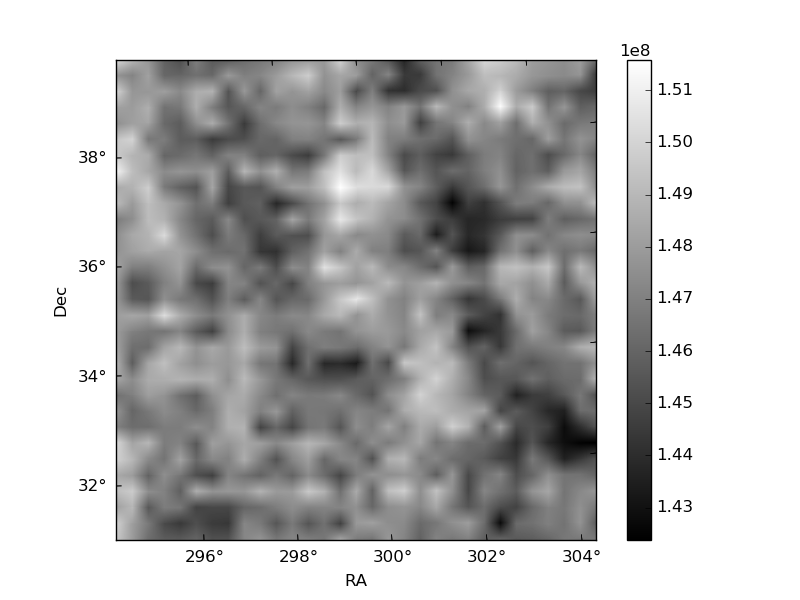
Quadrant B |
|---|---|---|---|
| Quadrant D | 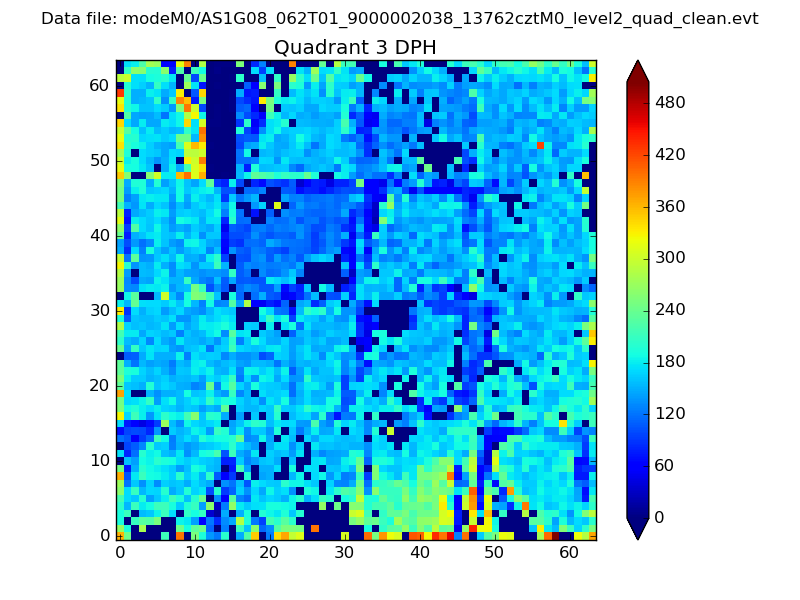 |
 |
Quadrant C |
| Plot type | Count rate plots | Images |
|---|---|---|
| Comparison with Poisson distribution Blue bars denote a histogram of data divided into 1 sec bins. Red curve is a Poisson curve with rate = median count rate of data. |
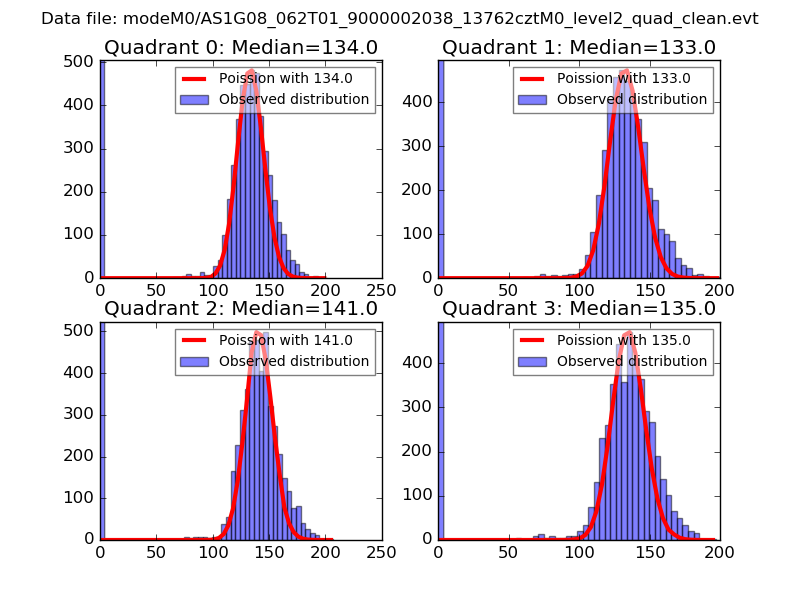 |
 |
| Quadrant-wise count rates Data is divided into 100 sec bins |
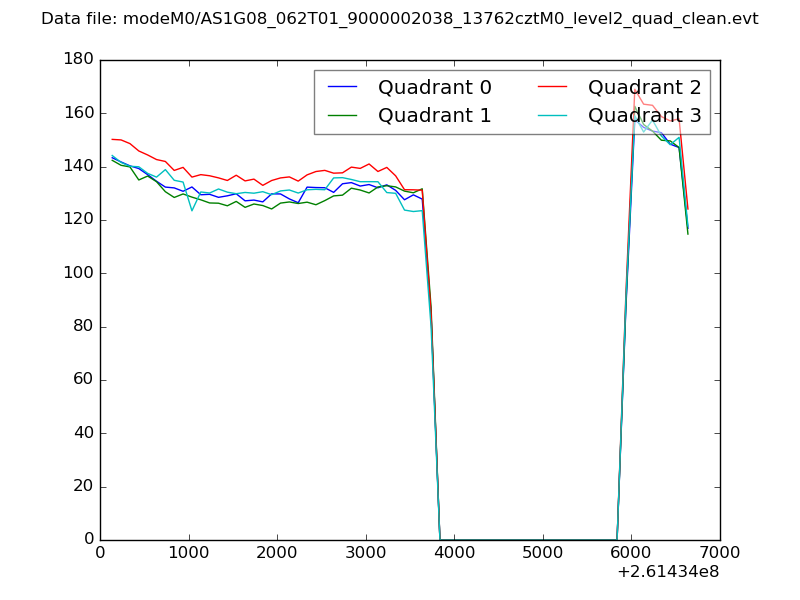 |
|
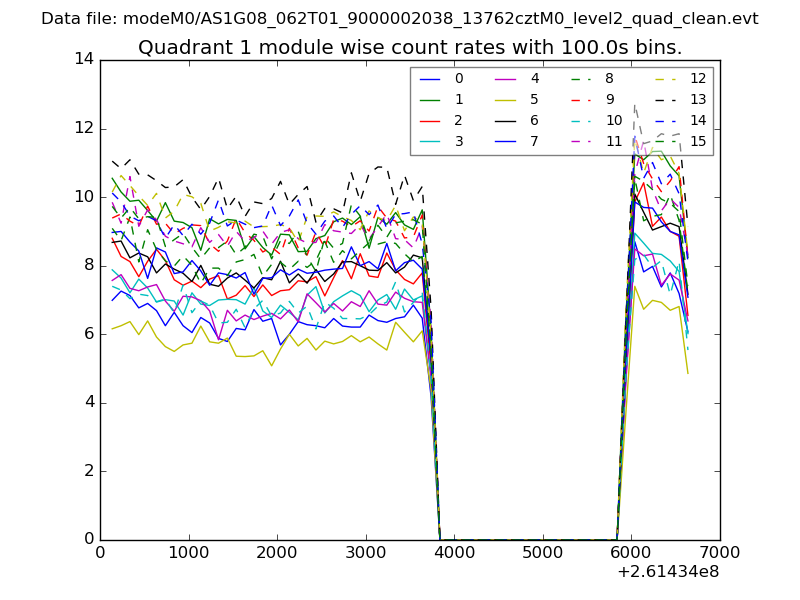
| Module-wise count rates for Quadrant A Data is divided into 100 sec bins |
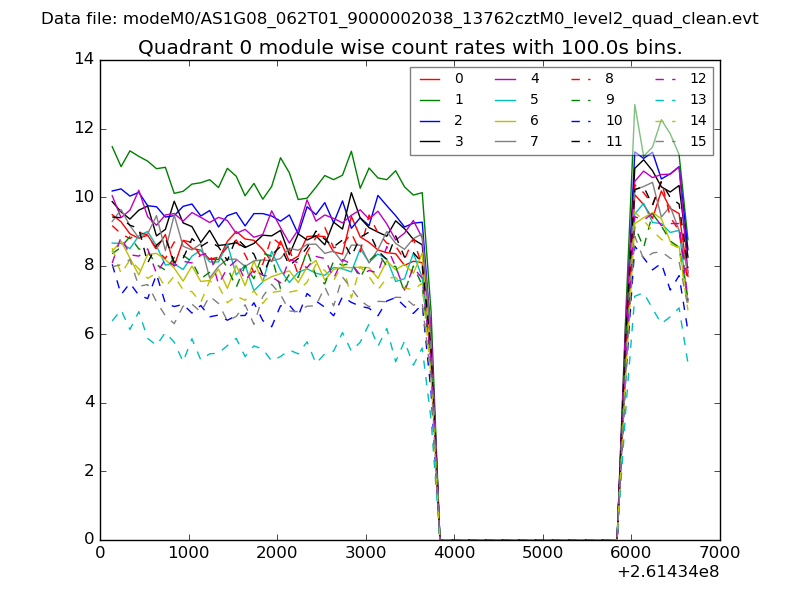 |
 |
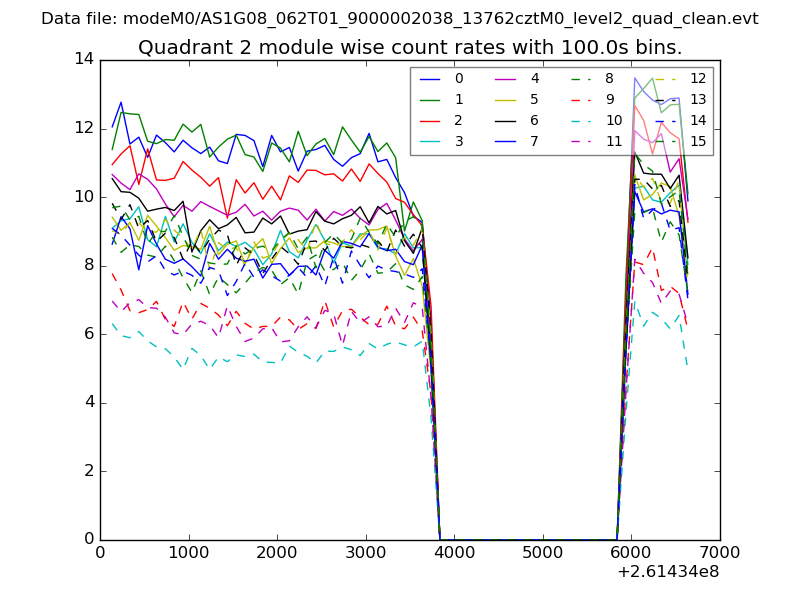
| Module-wise count rates for Quadrant B Data is divided into 100 sec bins |
 |
 |
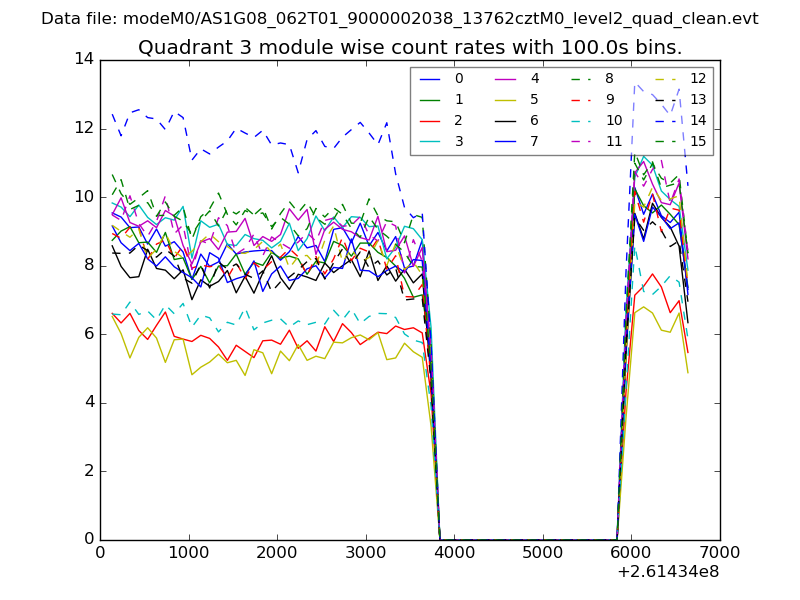
| Module-wise count rates for Quadrant C Data is divided into 100 sec bins |
 |
 |
| Module-wise count rates for Quadrant D Data is divided into 100 sec bins |
 |
 |
| Parameter | Plot |
|---|---|
| CZT HV Monitor | 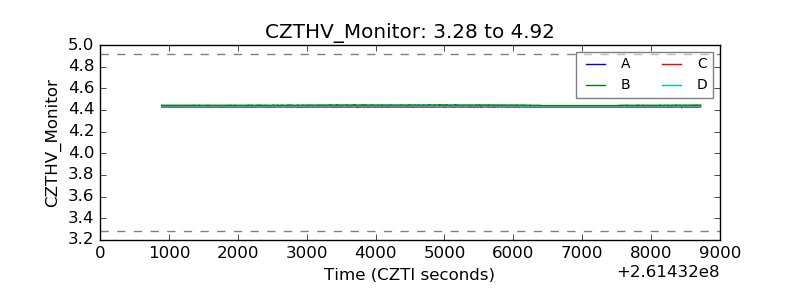 |
| D_VDD | 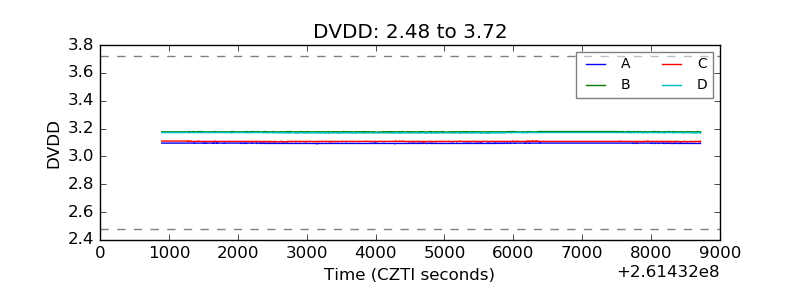 |
| Temperature 1 | 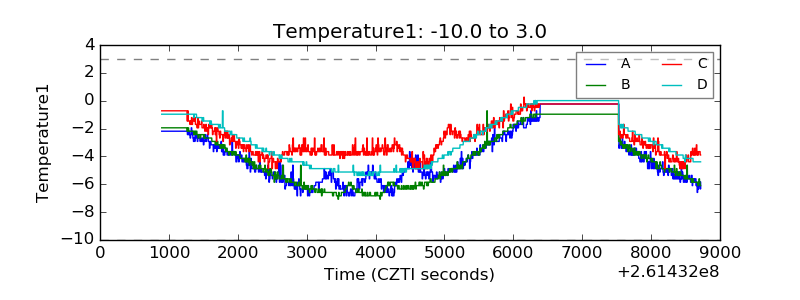 |
| Veto HV Monitor | 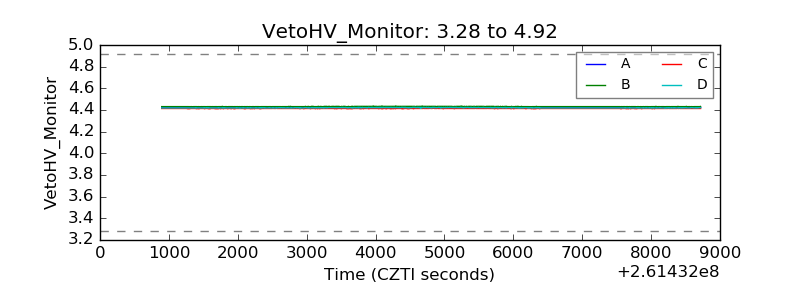 |
| Veto LLD | 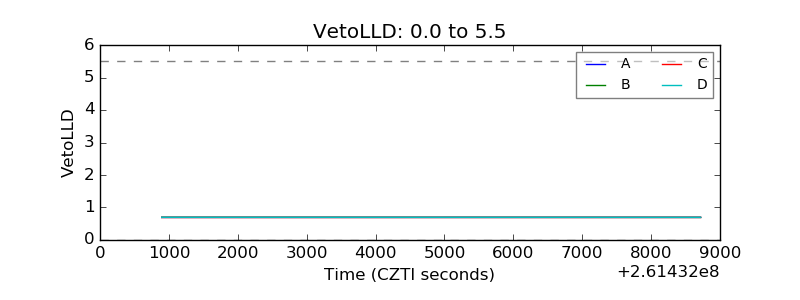 |
| Alpha Counter | 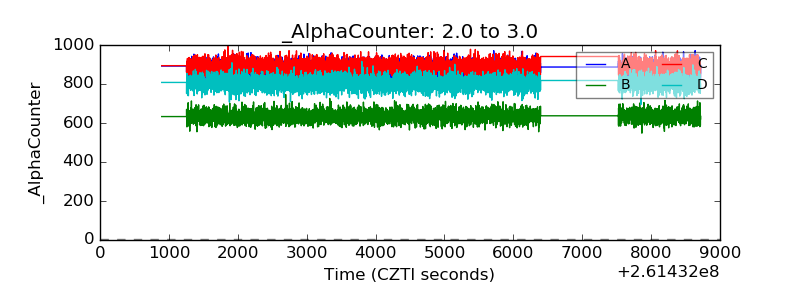 |
| _CPM_Rate | 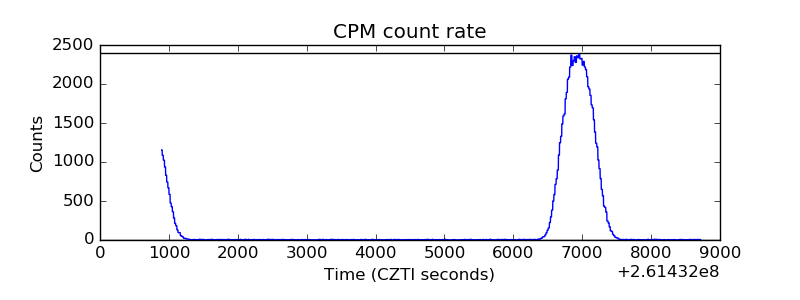 |
| CZT Counter | 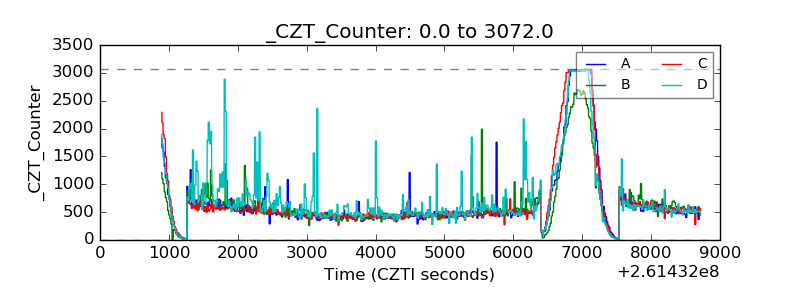 |
| +2.5 Volts monitor |  |
| +5 Volts monitor |  |
| _ROLL_ROT | 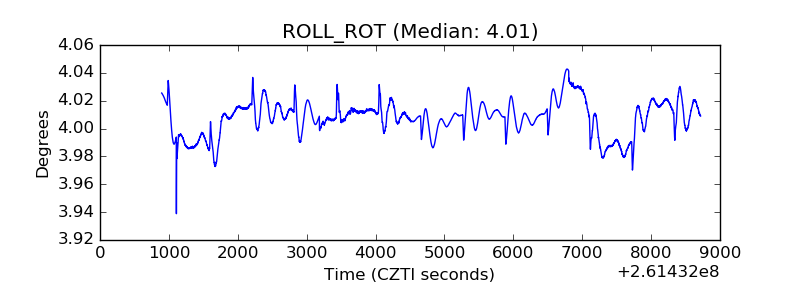 |
| _Roll_DEC | 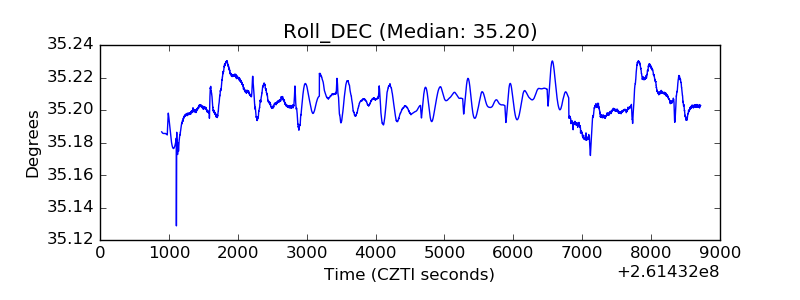 |
| _Roll_RA | 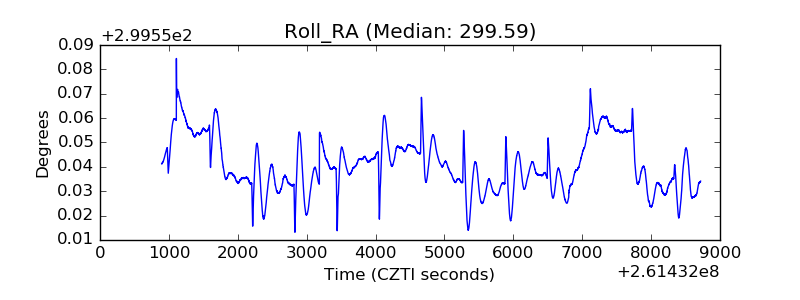 |
| Veto Counter | 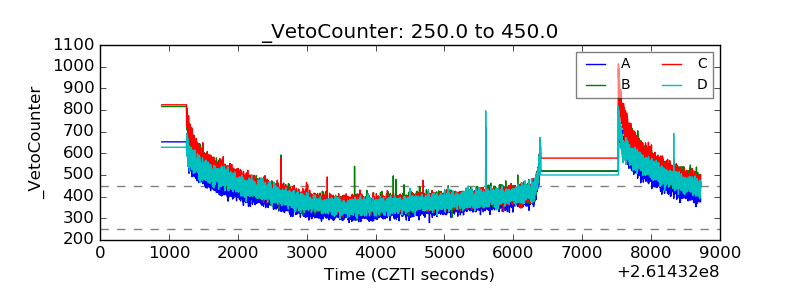 |