| Param | Original file | Final file |
|---|---|---|
| Filename | modeM0/AS1G08_062T01_9000002038_13763cztM0_level2.evt | modeM0/AS1G08_062T01_9000002038_13763cztM0_level2_quad_clean.evt |
| Size (bytes) | 482,230,080 | 109,851,840 |
| Size | 459.9 MB | 104.8 MB |
| Events in quadrant A | 3,449,895 | 714,244 |
| Events in quadrant B | 3,500,803 | 713,428 |
| Events in quadrant C | 3,288,846 | 750,055 |
| Events in quadrant D | 3,933,195 | 705,646 |
| Mode M9 | |||
|---|---|---|---|
| Quadrant | BADHDUFLAG | Total packets | Discarded packets |
| A | 0 | 17 | 0 |
| B | 0 | 17 | 0 |
| C | 0 | 17 | 0 |
| D | 0 | 18 | 0 |
| Mode M0 | |||
|---|---|---|---|
| Quadrant | BADHDUFLAG | Total packets | Discarded packets |
| A | 0 | 14384 | 3 |
| B | 0 | 14755 | 2 |
| C | 0 | 13851 | 2 |
| D | 0 | 15859 | 2 |
| Mode SS | |||
|---|---|---|---|
| Quadrant | BADHDUFLAG | Total packets | Discarded packets |
| A | 0 | 130 | 0 |
| B | 0 | 130 | 0 |
| C | 0 | 130 | 0 |
| D | 0 | 130 | 0 |
| Quadrant | Total seconds | Saturated seconds | Saturation percentage |
|---|---|---|---|
| A | 6355 | 96 | 1.510622% |
| B | 6355 | 77 | 1.211644% |
| C | 6355 | 25 | 0.393391% |
| D | 6355 | 189 | 2.974036% |
Noise dominated data is calculated using 1-second bins in cleaned event files. If a bin has >2000 counts, and if more than 50% of those come from <1% of pixels, then it is considered to be noise-dominated and hence unusable.
| Quadrant | # 1 sec bins | Bins with >0 counts | Bins with >2000 counts | High rate bins dominated by noise | Noise dominated (total time) | Noise dominated (detector-on time) | Marked lightcurve |
|---|---|---|---|---|---|---|---|
| A | 7581 | 6357 | 45 | 45 | 0.59% | 0.71% | 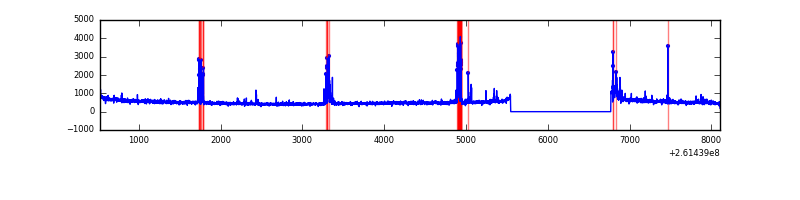 |
| B | 7581 | 6357 | 7 | 7 | 0.09% | 0.11% | 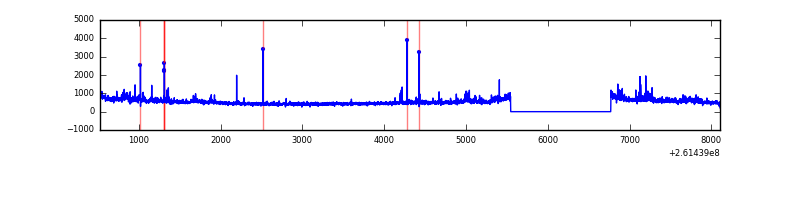 |
| C | 7581 | 6357 | 0 | 0 | 0.00% | 0.00% | 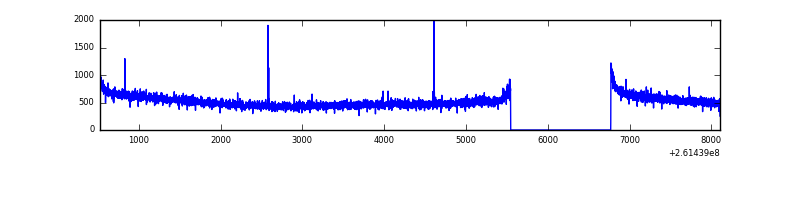 |
| D | 7581 | 6357 | 114 | 114 | 1.50% | 1.79% | 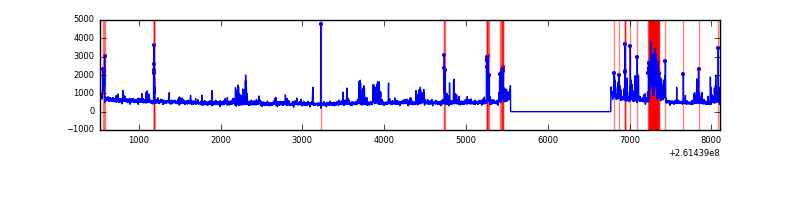 |
Top three noisy pixels from each quadrant. If the there are fewer than three noisy pixels in the level2.evt file, extra rows are filled as -1
| Pixel properties | Quadrant properties | ||||||
|---|---|---|---|---|---|---|---|
| Quadrant | DetID | PixID | Counts | Sigma | Mean | Median | Sigma |
| A | 9 | 143 | 259989 | 1576.9 | 816 | 800 | 164.4 |
| A | 1 | 162 | 18307 | 106.51 | 816 | 800 | 164.4 |
| A | 0 | 23 | 13329 | 76.23 | 816 | 800 | 164.4 |
| B | 0 | 219 | 152653 | 985.41 | 821 | 804 | 154.1 |
| B | 4 | 142 | 30682 | 193.89 | 821 | 804 | 154.1 |
| B | 0 | 189 | 27685 | 174.44 | 821 | 804 | 154.1 |
| C | 3 | 233 | 98770 | 515.21 | 816 | 824 | 190.1 |
| C | 12 | 4 | 10097 | 48.78 | 816 | 824 | 190.1 |
| C | 13 | 61 | 5750 | 25.91 | 816 | 824 | 190.1 |
| D | 5 | 222 | 487653 | 2495.17 | 801 | 778 | 195.1 |
| D | 13 | 249 | 148390 | 756.49 | 801 | 778 | 195.1 |
| D | 10 | 157 | 124716 | 635.17 | 801 | 778 | 195.1 |
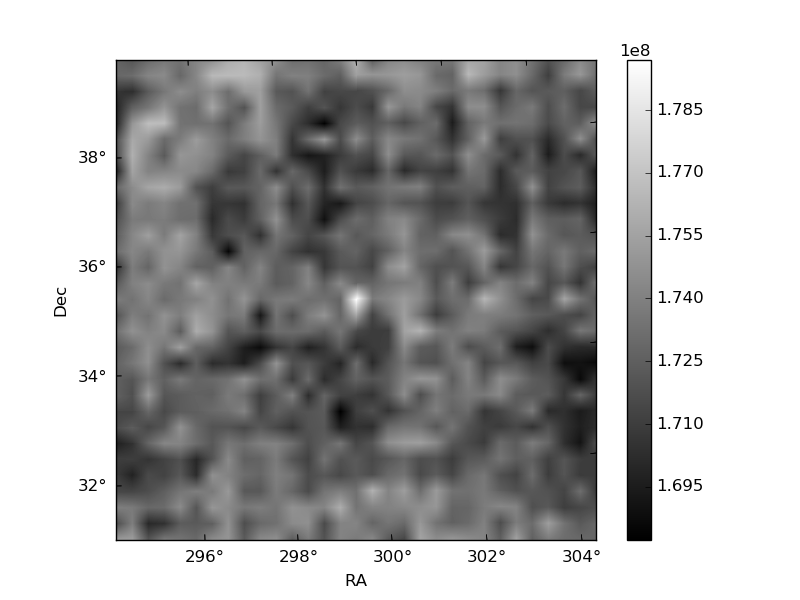
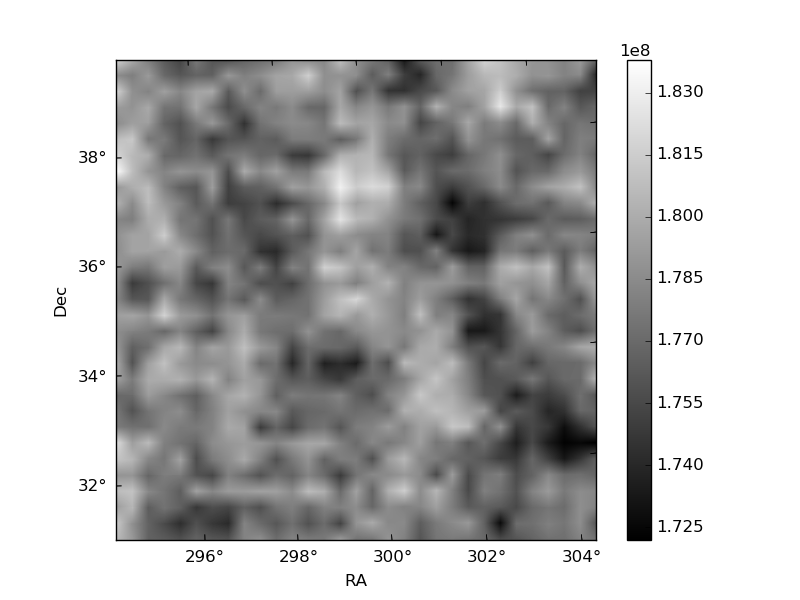
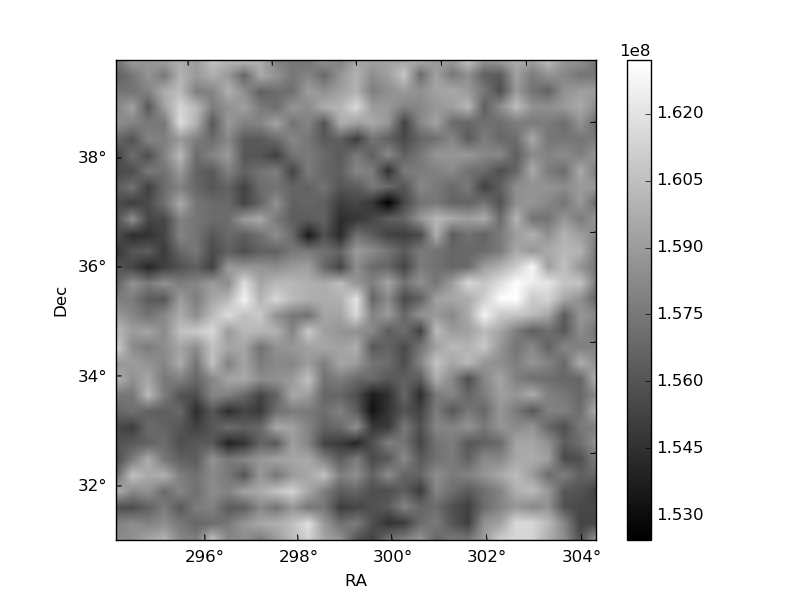
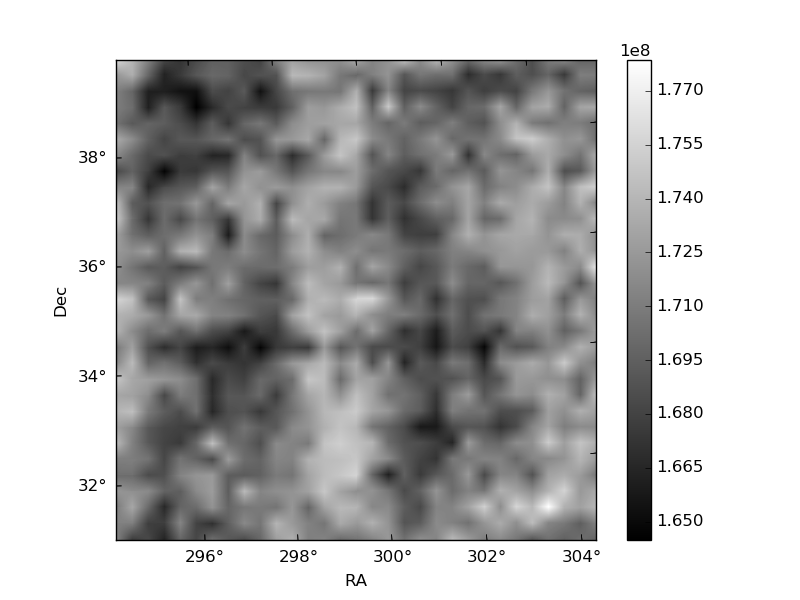
Histogram calculated using DETX and DETY for each event in the final _common_clean file
| Quadrant A | 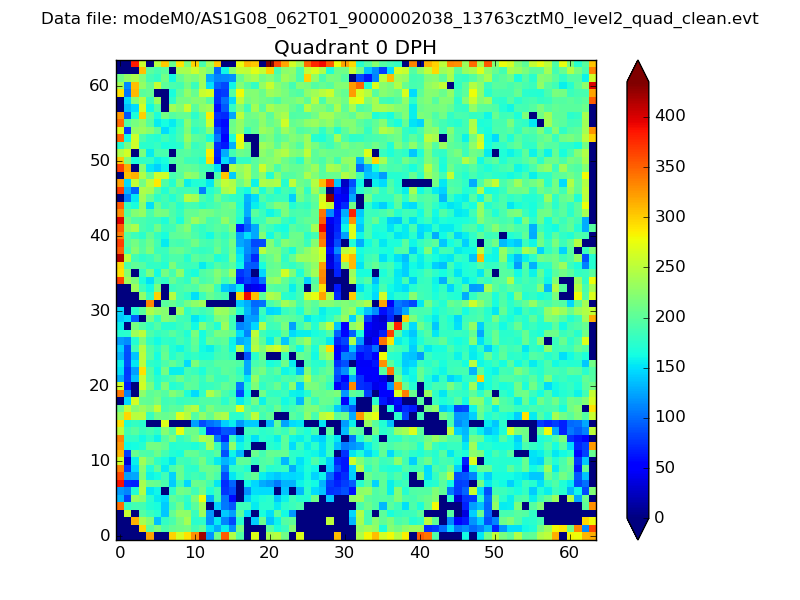 |
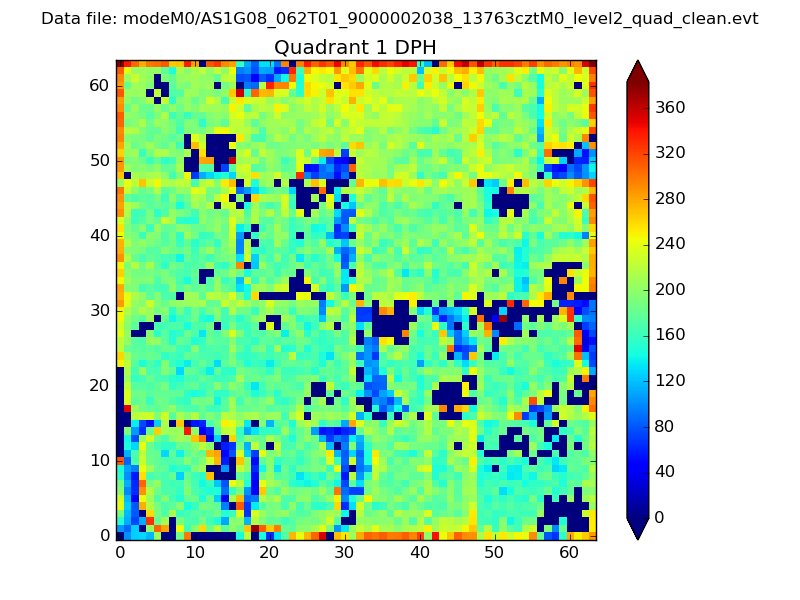 |
Quadrant B |
|---|---|---|---|
| Quadrant D | 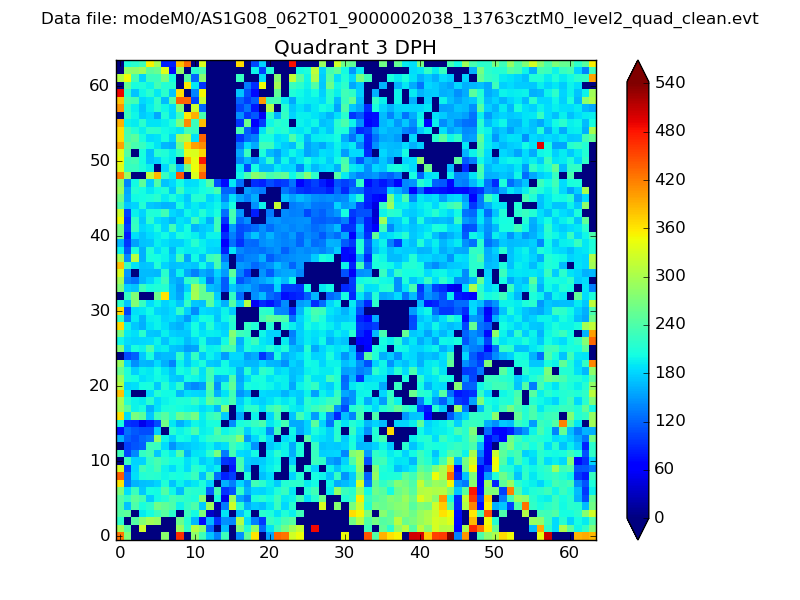 |
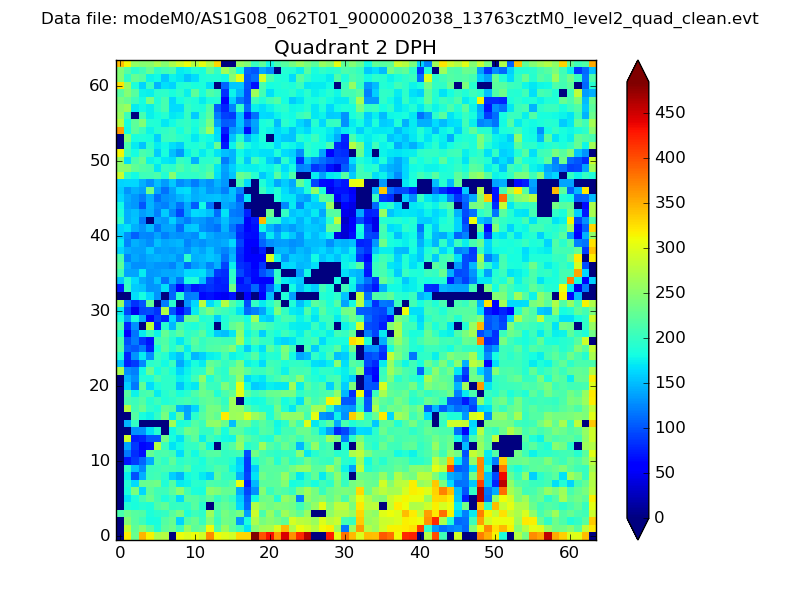 |
Quadrant C |
| Plot type | Count rate plots | Images |
|---|---|---|
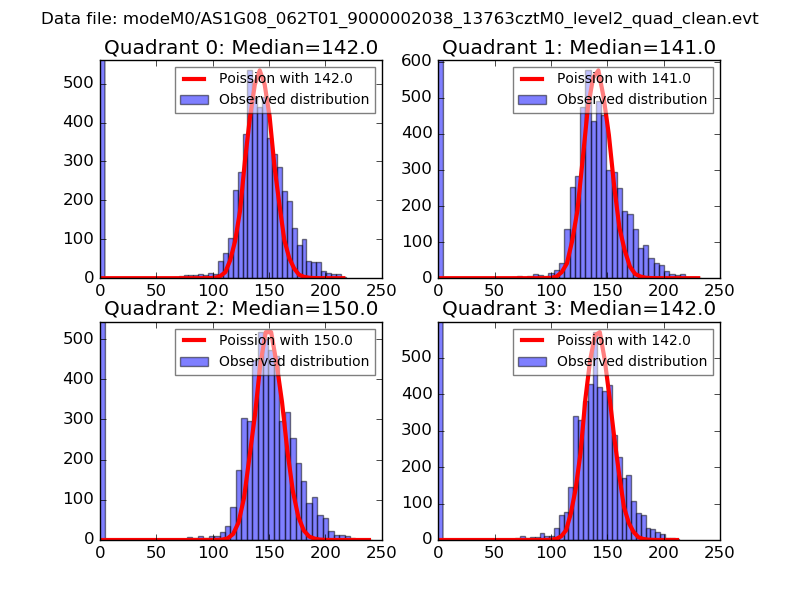
| Comparison with Poisson distribution Blue bars denote a histogram of data divided into 1 sec bins. Red curve is a Poisson curve with rate = median count rate of data. |
 |
 |
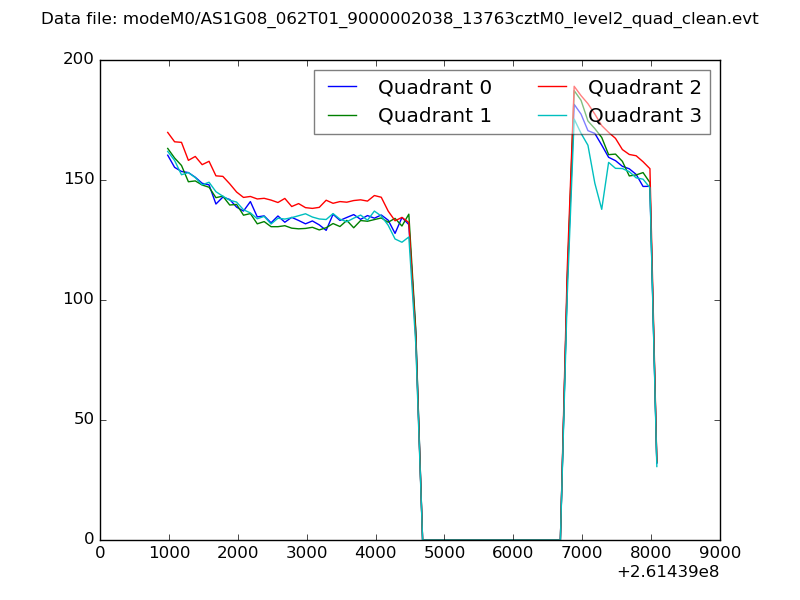
| Quadrant-wise count rates Data is divided into 100 sec bins |
 |
|
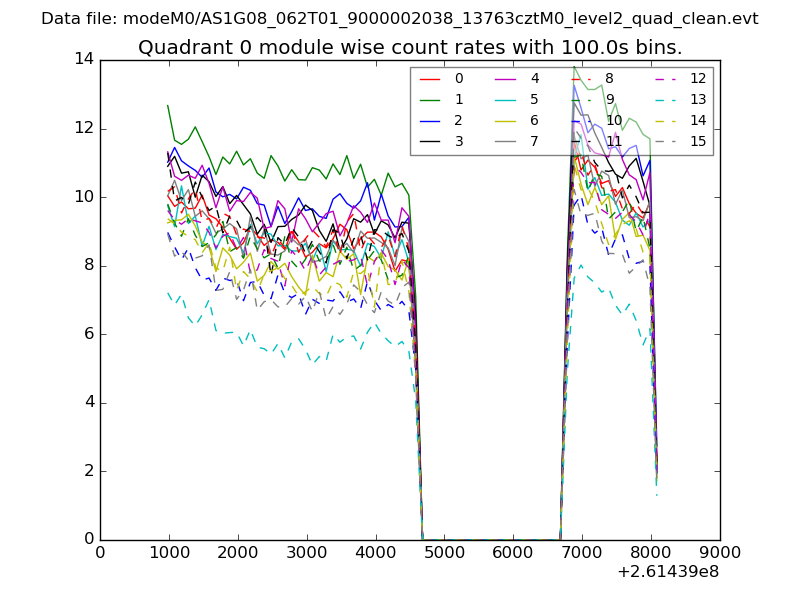
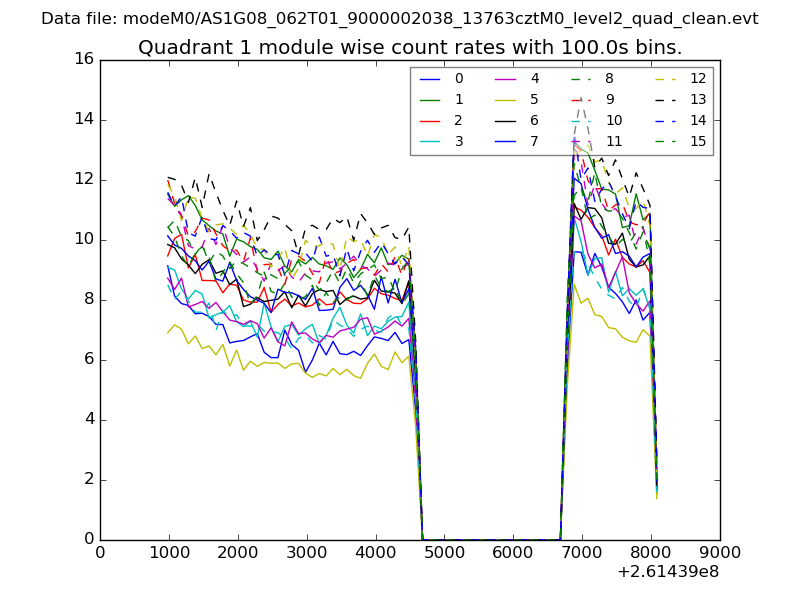
| Module-wise count rates for Quadrant A Data is divided into 100 sec bins |
 |
 |
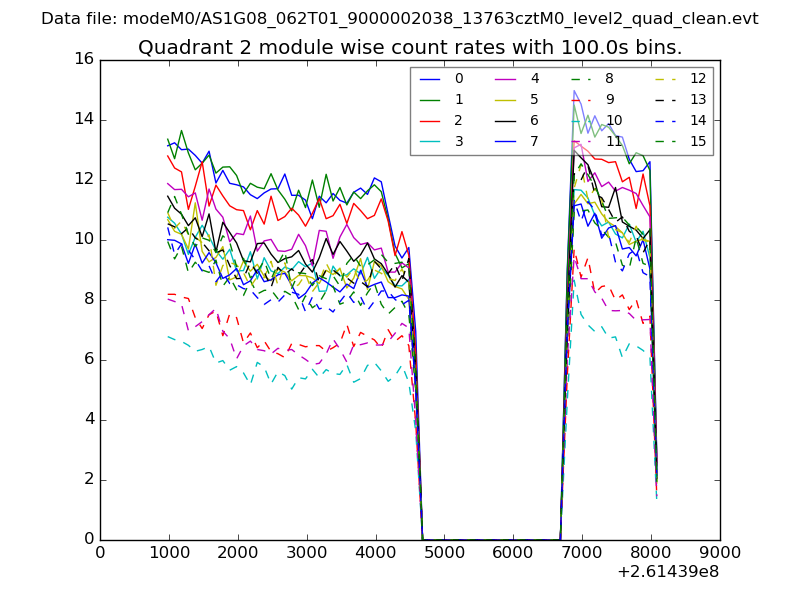
| Module-wise count rates for Quadrant B Data is divided into 100 sec bins |
 |
 |
| Module-wise count rates for Quadrant C Data is divided into 100 sec bins |
 |
 |
| Module-wise count rates for Quadrant D Data is divided into 100 sec bins |
 |
 |
| Parameter | Plot |
|---|---|
| CZT HV Monitor | 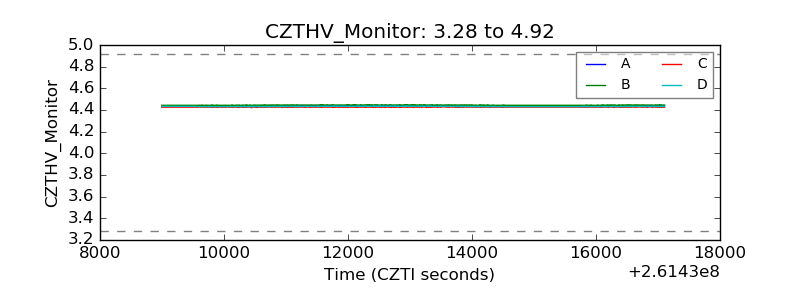 |
| D_VDD | 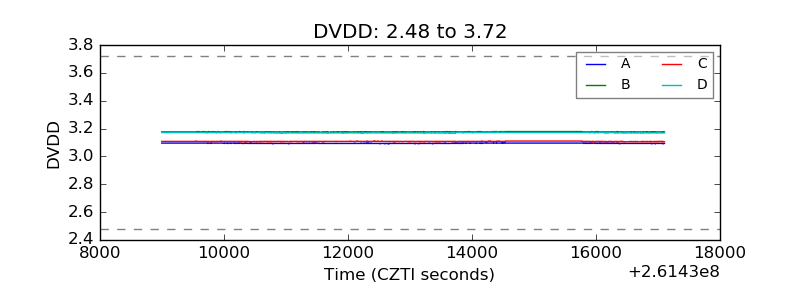 |
| Temperature 1 | 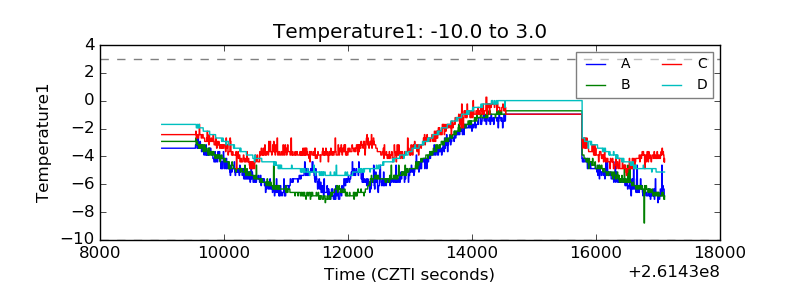 |
| Veto HV Monitor | 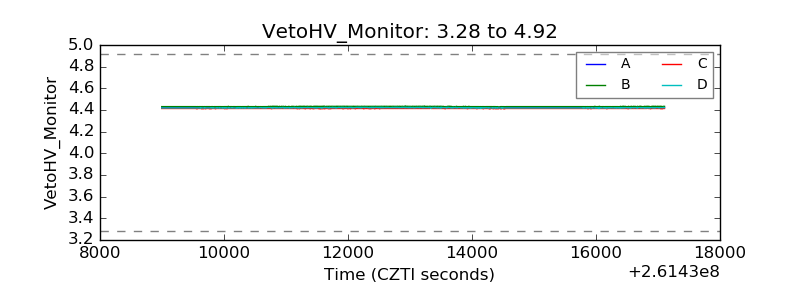 |
| Veto LLD | 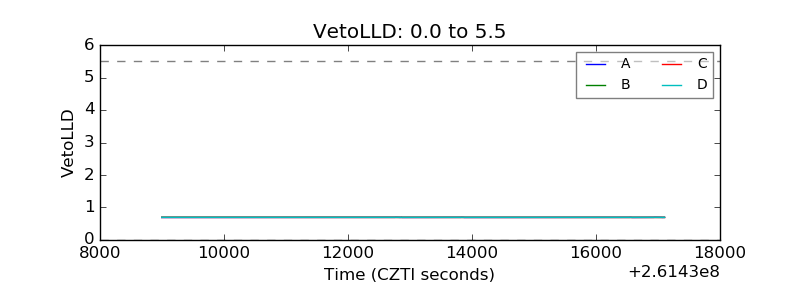 |
| Alpha Counter | 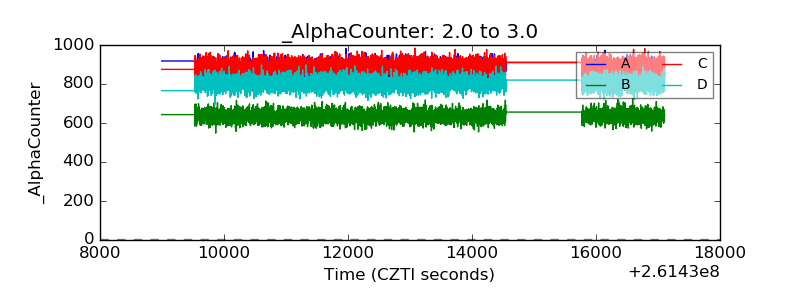 |
| _CPM_Rate | 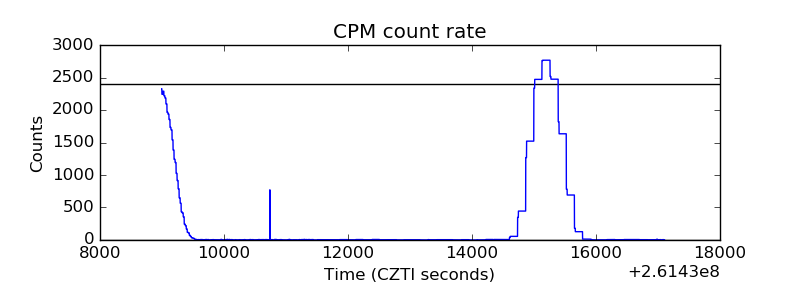 |
| CZT Counter | 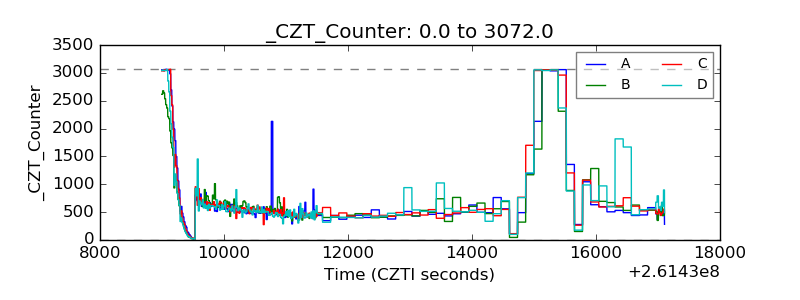 |
| +2.5 Volts monitor |  |
| +5 Volts monitor |  |
| _ROLL_ROT |  |
| _Roll_DEC | 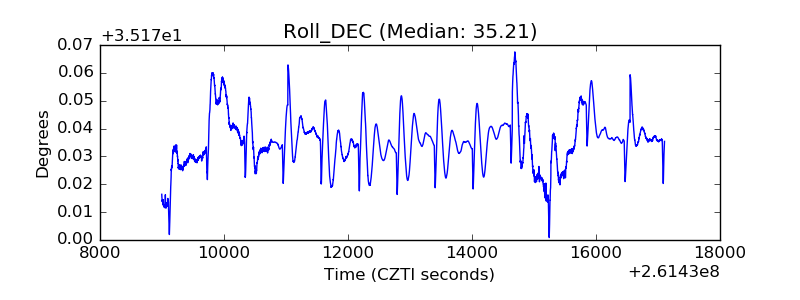 |
| _Roll_RA | 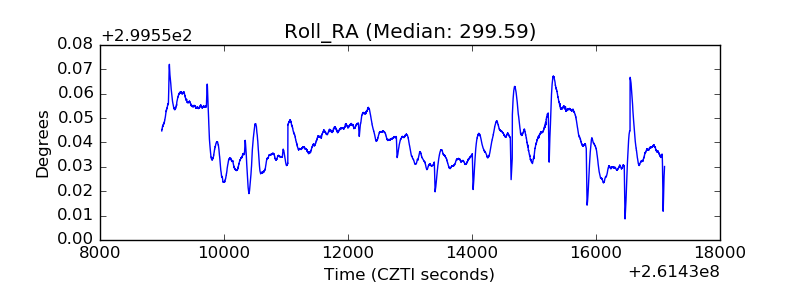 |
| Veto Counter | 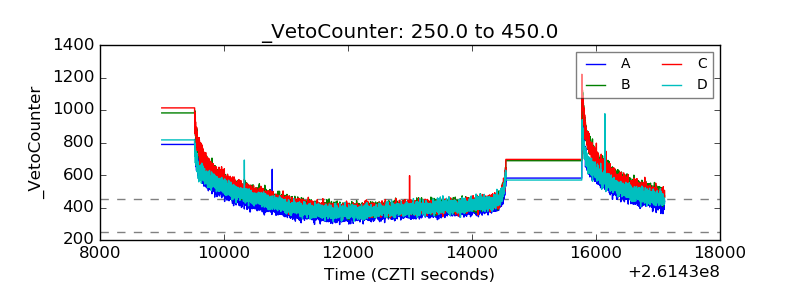 |