| Param | Original file | Final file |
|---|---|---|
| Filename | modeM0/AS1G08_062T01_9000002038_13765cztM0_level2.evt | modeM0/AS1G08_062T01_9000002038_13765cztM0_level2_quad_clean.evt |
| Size (bytes) | 538,237,440 | 112,380,480 |
| Size | 513.3 MB | 107.2 MB |
| Events in quadrant A | 3,477,560 | 736,164 |
| Events in quadrant B | 3,546,118 | 742,937 |
| Events in quadrant C | 3,320,145 | 767,070 |
| Events in quadrant D | 5,516,335 | 704,369 |
| Mode M9 | |||
|---|---|---|---|
| Quadrant | BADHDUFLAG | Total packets | Discarded packets |
| A | 0 | 17 | 0 |
| B | 0 | 17 | 0 |
| C | 0 | 17 | 0 |
| D | 0 | 18 | 0 |
| Mode M0 | |||
|---|---|---|---|
| Quadrant | BADHDUFLAG | Total packets | Discarded packets |
| A | 0 | 14484 | 3 |
| B | 0 | 14717 | 2 |
| C | 0 | 13909 | 2 |
| D | 0 | 20750 | 2 |
| Mode SS | |||
|---|---|---|---|
| Quadrant | BADHDUFLAG | Total packets | Discarded packets |
| A | 0 | 134 | 0 |
| B | 0 | 134 | 0 |
| C | 0 | 134 | 0 |
| D | 0 | 134 | 0 |
| Quadrant | Total seconds | Saturated seconds | Saturation percentage |
|---|---|---|---|
| A | 6489 | 61 | 0.940052% |
| B | 6489 | 62 | 0.955463% |
| C | 6489 | 37 | 0.570196% |
| D | 6489 | 510 | 7.859454% |
Noise dominated data is calculated using 1-second bins in cleaned event files. If a bin has >2000 counts, and if more than 50% of those come from <1% of pixels, then it is considered to be noise-dominated and hence unusable.
| Quadrant | # 1 sec bins | Bins with >0 counts | Bins with >2000 counts | High rate bins dominated by noise | Noise dominated (total time) | Noise dominated (detector-on time) | Marked lightcurve |
|---|---|---|---|---|---|---|---|
| A | 7840 | 6491 | 35 | 35 | 0.45% | 0.54% | 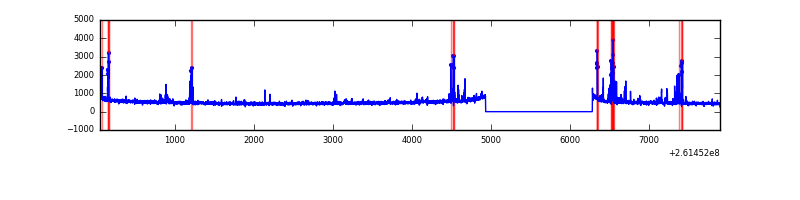 |
| B | 7840 | 6491 | 18 | 18 | 0.23% | 0.28% | 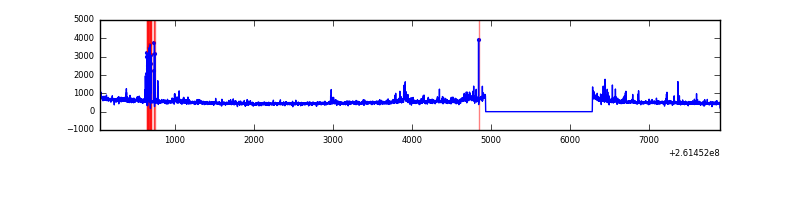 |
| C | 7840 | 6491 | 4 | 4 | 0.05% | 0.06% | 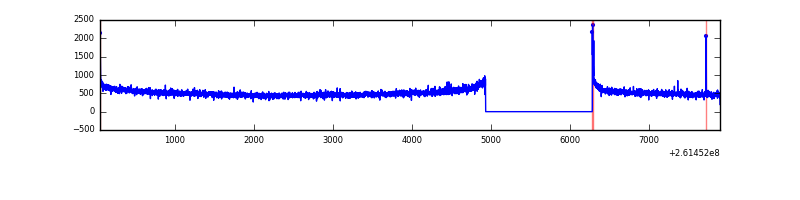 |
| D | 7840 | 6491 | 316 | 316 | 4.03% | 4.87% | 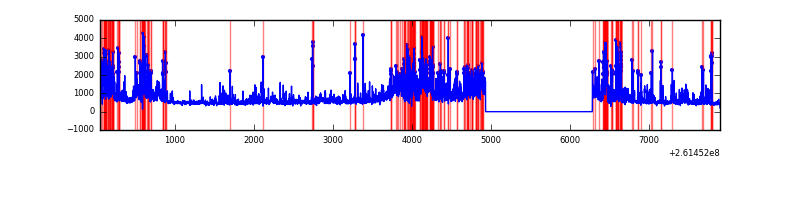 |
Top three noisy pixels from each quadrant. If the there are fewer than three noisy pixels in the level2.evt file, extra rows are filled as -1
| Pixel properties | Quadrant properties | ||||||
|---|---|---|---|---|---|---|---|
| Quadrant | DetID | PixID | Counts | Sigma | Mean | Median | Sigma |
| A | 9 | 143 | 258758 | 1559.5 | 824 | 810 | 165.4 |
| A | 1 | 162 | 18330 | 105.92 | 824 | 810 | 165.4 |
| A | 0 | 23 | 14598 | 83.36 | 824 | 810 | 165.4 |
| B | 0 | 219 | 213772 | 1380.27 | 829 | 811 | 154.3 |
| B | 10 | 244 | 34296 | 217.03 | 829 | 811 | 154.3 |
| B | 12 | 111 | 17099 | 105.57 | 829 | 811 | 154.3 |
| C | 3 | 233 | 130482 | 690.67 | 814 | 821 | 187.7 |
| C | 6 | 253 | 8160 | 39.09 | 814 | 821 | 187.7 |
| C | 14 | 234 | 6836 | 32.04 | 814 | 821 | 187.7 |
| D | 5 | 222 | 1369630 | 7236.66 | 778 | 758 | 189.2 |
| D | 1 | 52 | 606705 | 3203.39 | 778 | 758 | 189.2 |
| D | 13 | 249 | 344446 | 1816.94 | 778 | 758 | 189.2 |
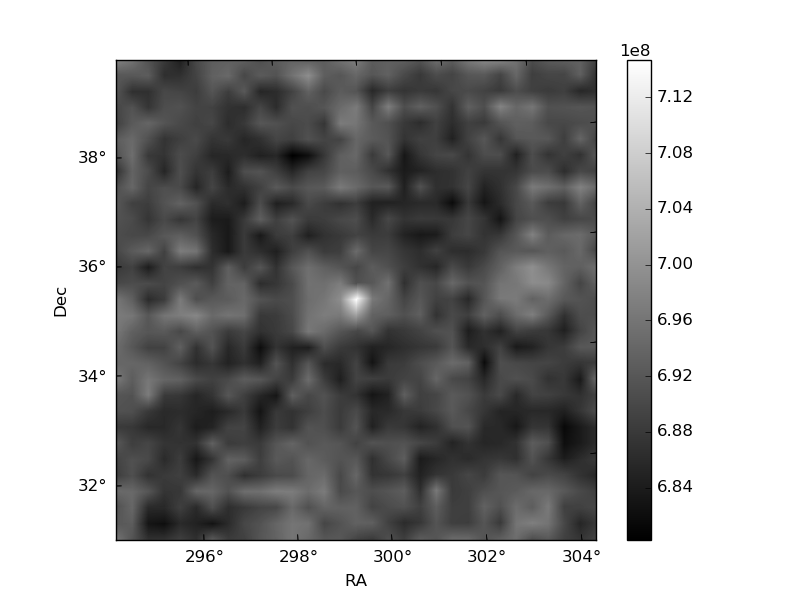
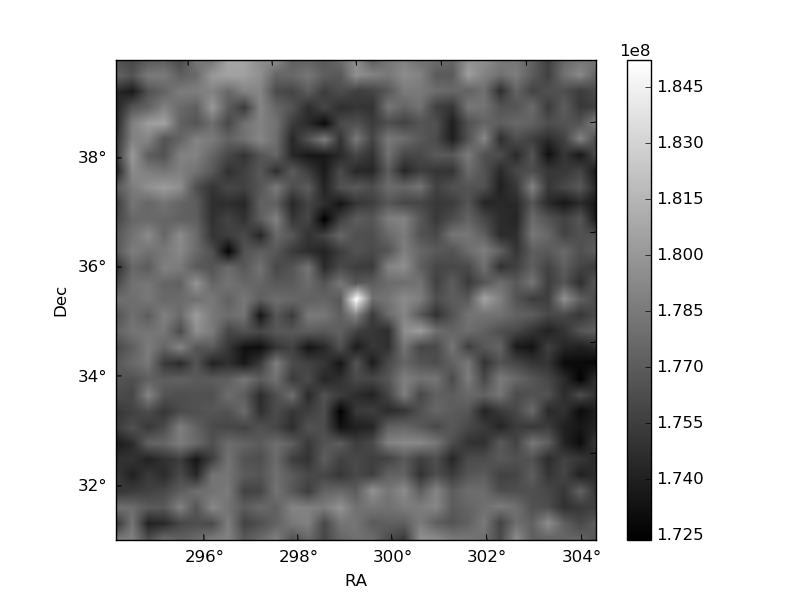
Histogram calculated using DETX and DETY for each event in the final _common_clean file
| Quadrant A | 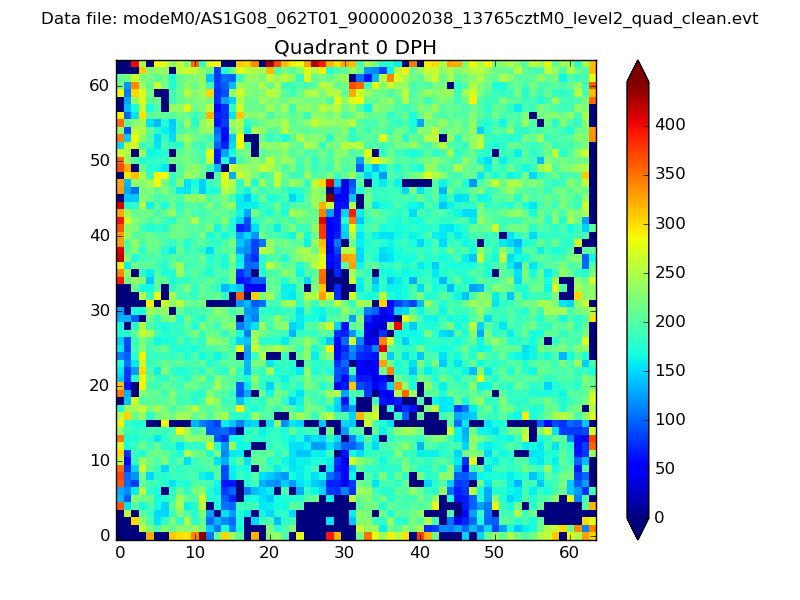 |
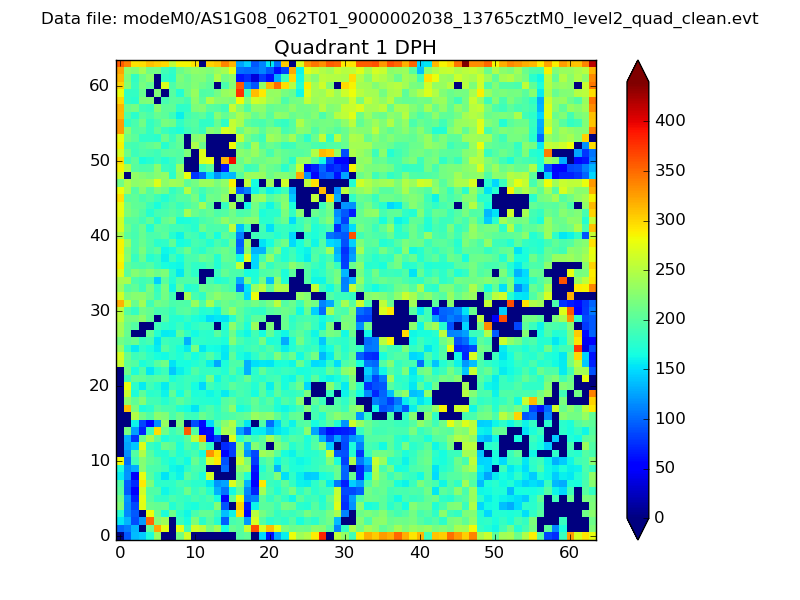 |
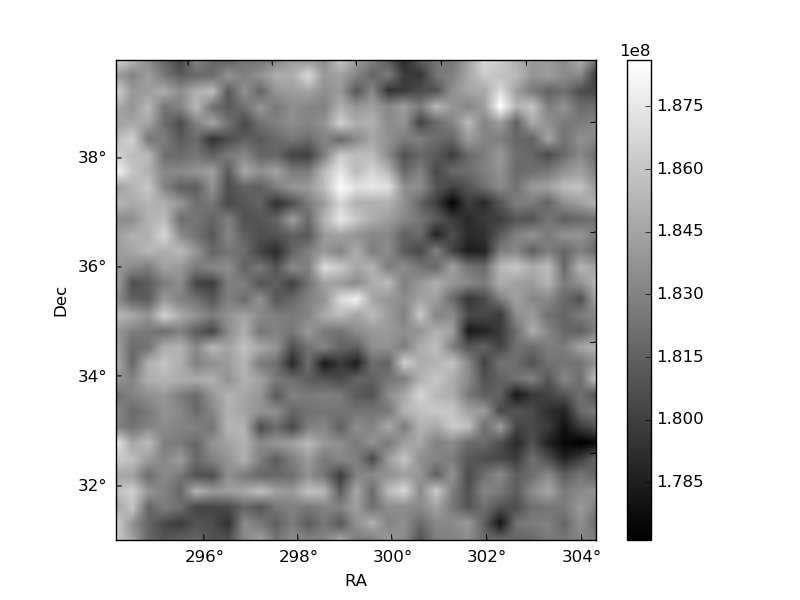
Quadrant B |
|---|---|---|---|
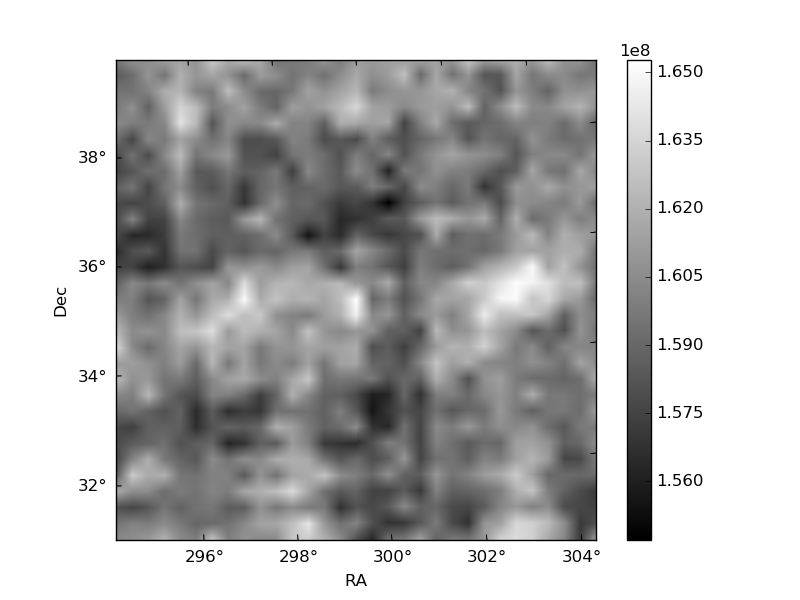
| Quadrant D | 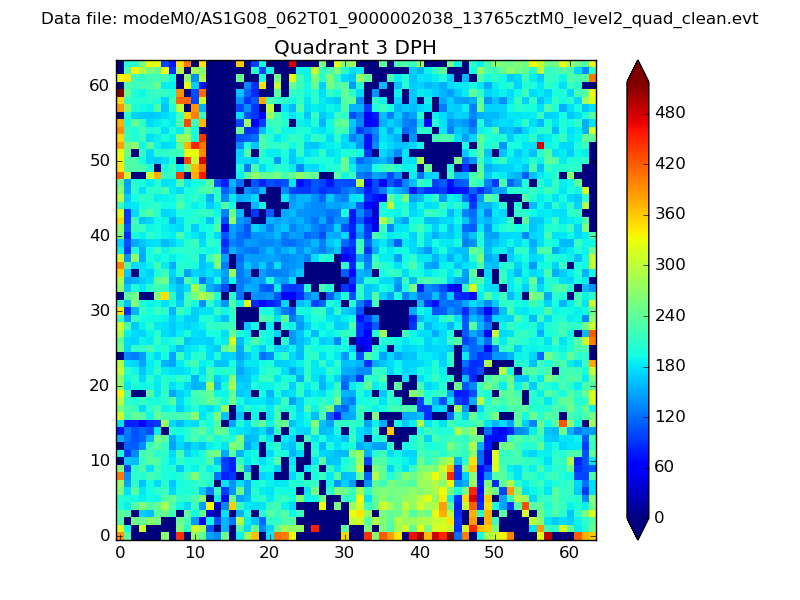 |
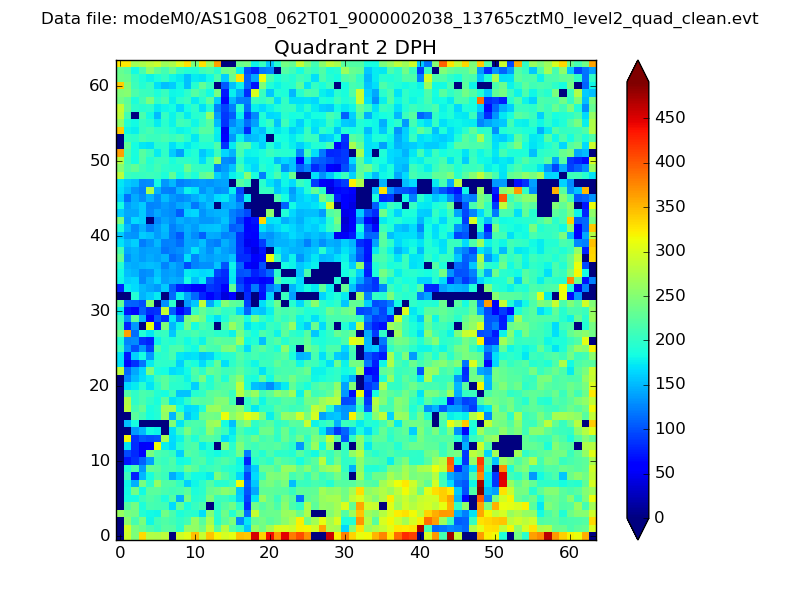 |
Quadrant C |
| Plot type | Count rate plots | Images |
|---|---|---|
| Comparison with Poisson distribution Blue bars denote a histogram of data divided into 1 sec bins. Red curve is a Poisson curve with rate = median count rate of data. |
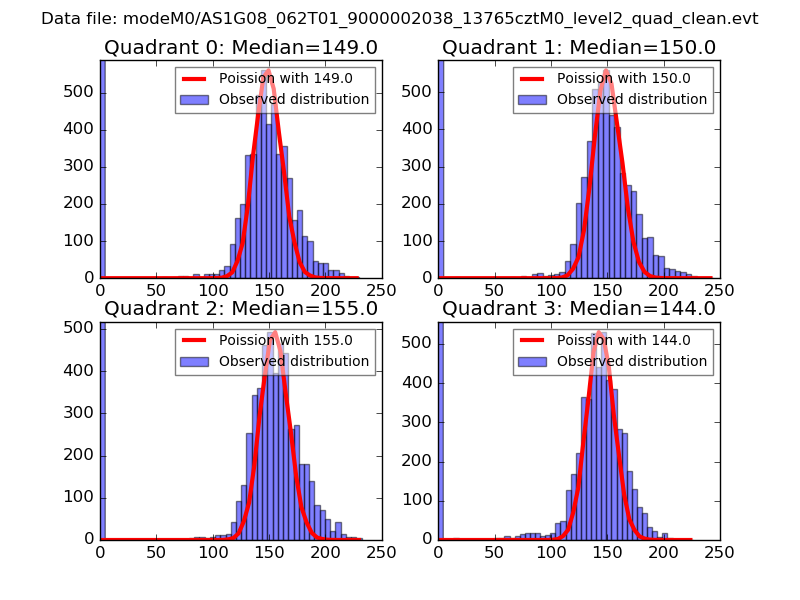 |
 |
| Quadrant-wise count rates Data is divided into 100 sec bins |
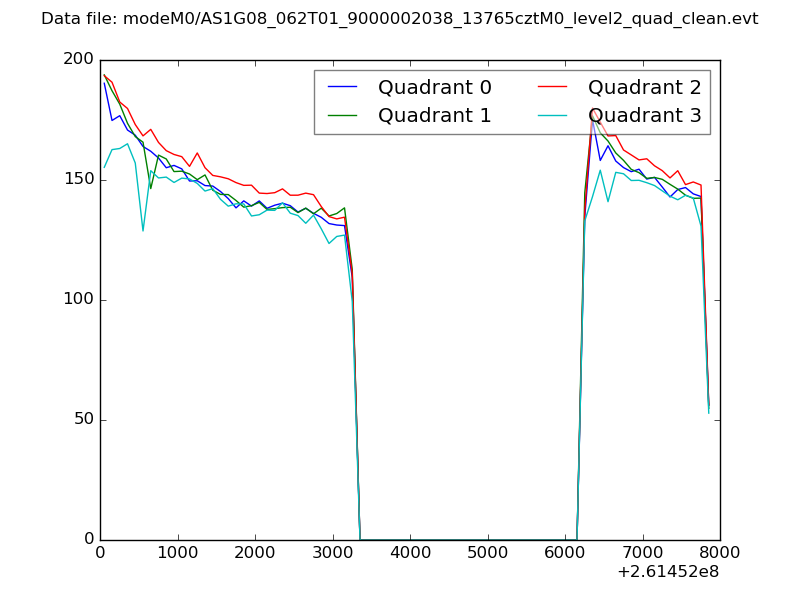 |
|
| Module-wise count rates for Quadrant A Data is divided into 100 sec bins |
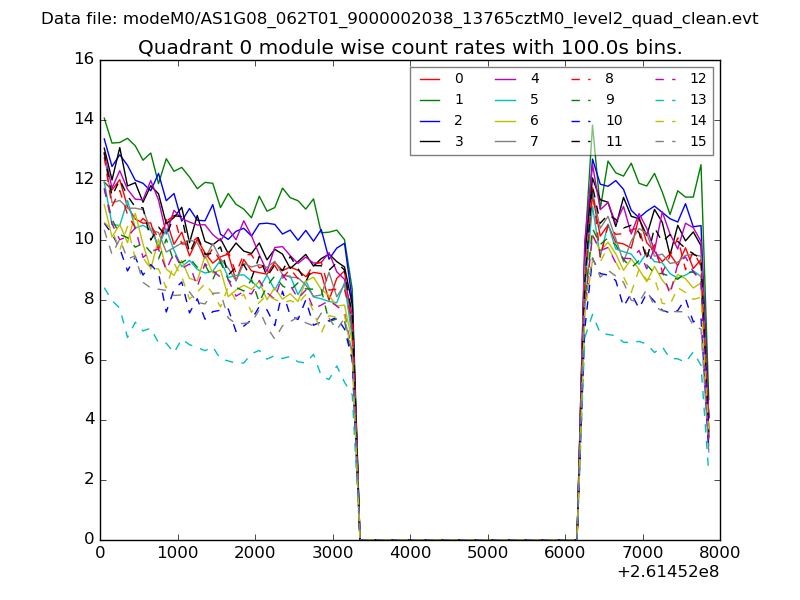 |
 |
| Module-wise count rates for Quadrant B Data is divided into 100 sec bins |
 |
 |
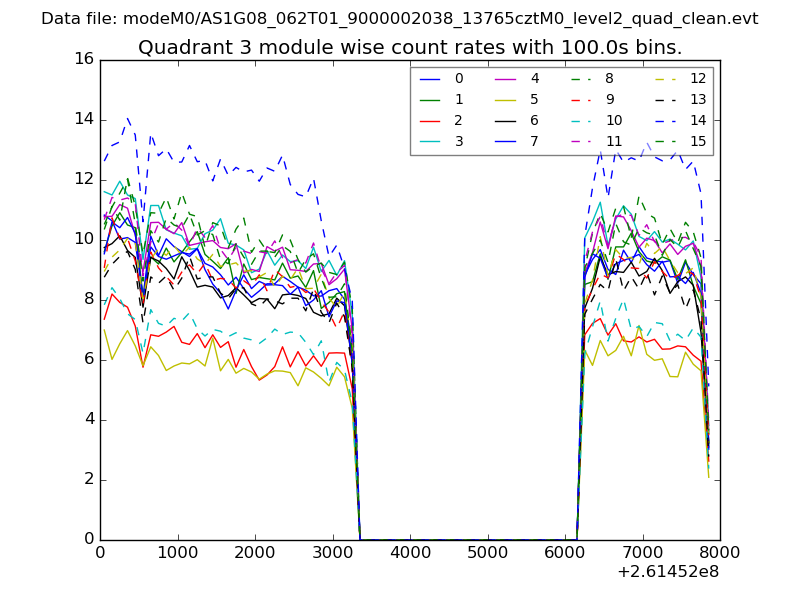
| Module-wise count rates for Quadrant C Data is divided into 100 sec bins |
 |
 |
| Module-wise count rates for Quadrant D Data is divided into 100 sec bins |
 |
 |
| Parameter | Plot |
|---|---|
| CZT HV Monitor |  |
| D_VDD | 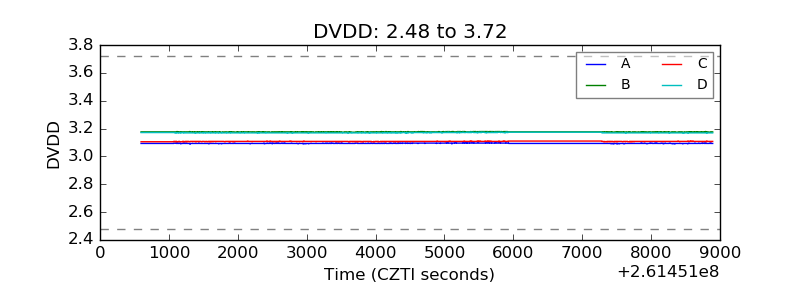 |
| Temperature 1 | 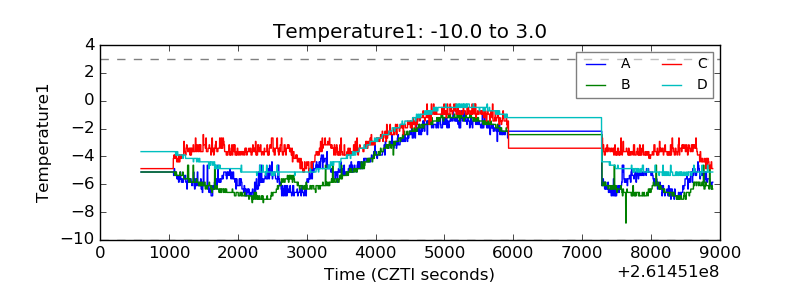 |
| Veto HV Monitor | 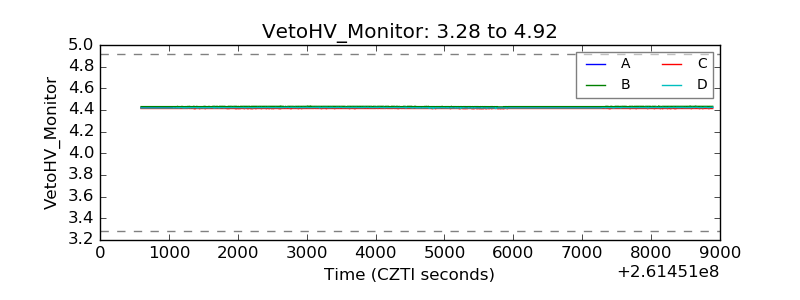 |
| Veto LLD | 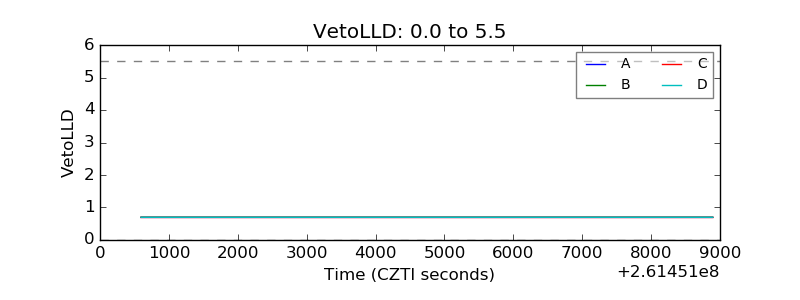 |
| Alpha Counter | 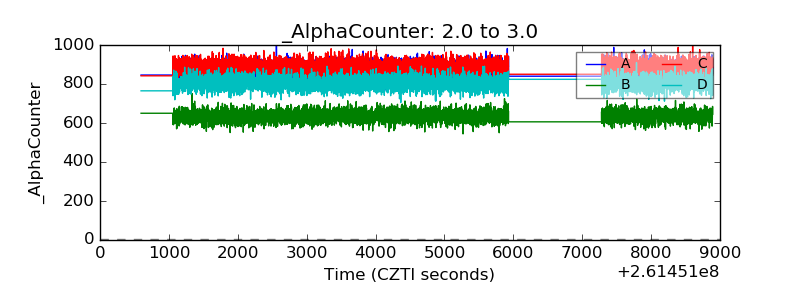 |
| _CPM_Rate | 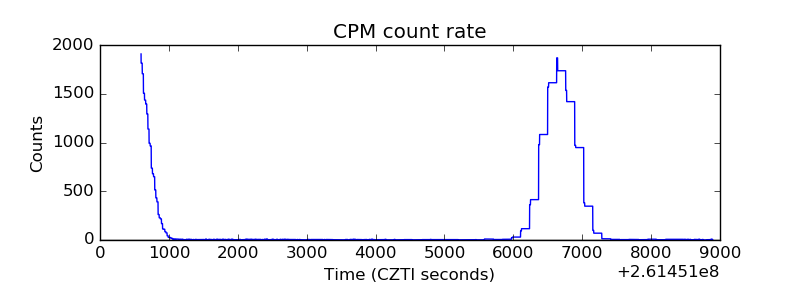 |
| CZT Counter | 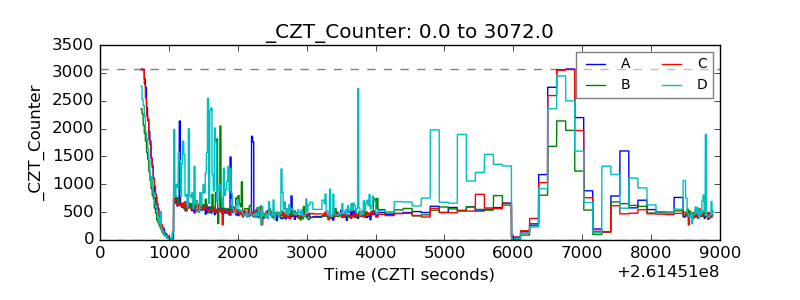 |
| +2.5 Volts monitor |  |
| +5 Volts monitor |  |
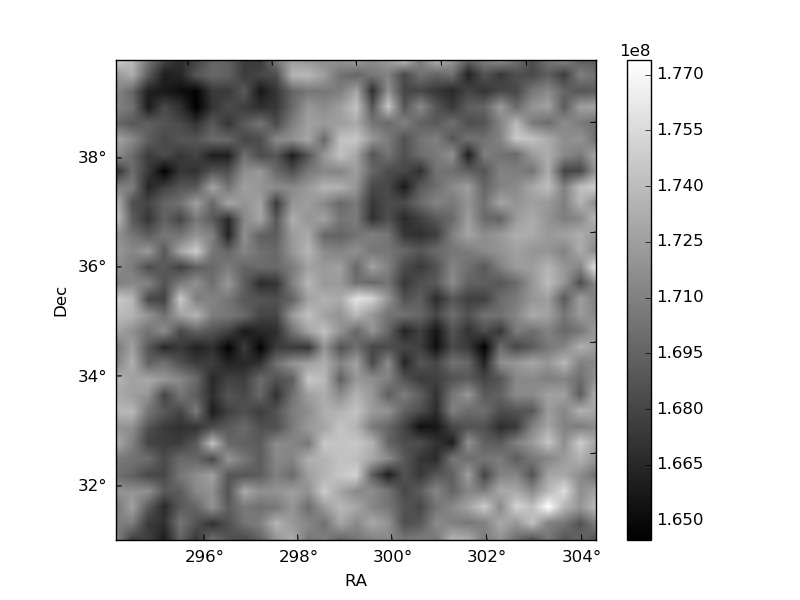
| _ROLL_ROT |  |
| _Roll_DEC | 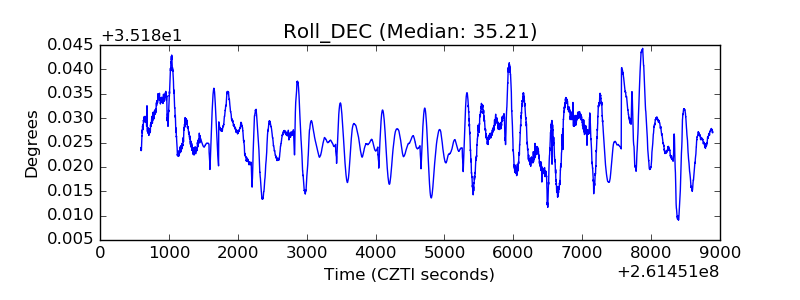 |
| _Roll_RA | 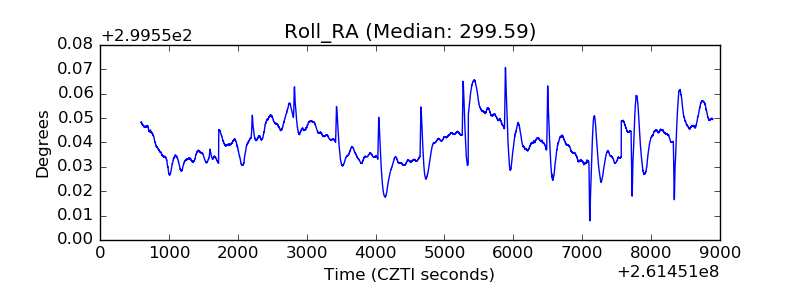 |
| Veto Counter | 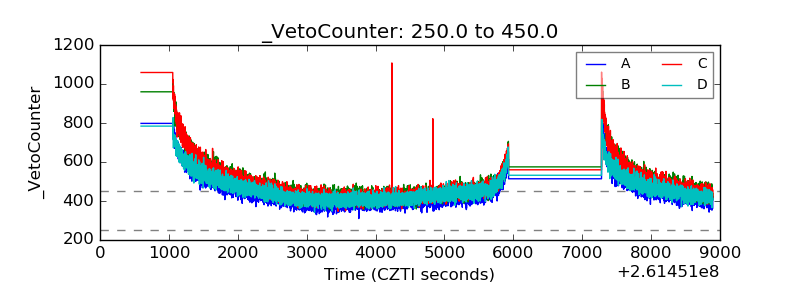 |