| Param | Original file | Final file |
|---|---|---|
| Filename | modeM0/AS1G08_062T01_9000002038_13767cztM0_level2.evt | modeM0/AS1G08_062T01_9000002038_13767cztM0_level2_quad_clean.evt |
| Size (bytes) | 522,607,680 | 83,373,120 |
| Size | 498.4 MB | 79.5 MB |
| Events in quadrant A | 3,060,725 | 526,733 |
| Events in quadrant B | 3,034,212 | 525,537 |
| Events in quadrant C | 5,110,145 | 540,780 |
| Events in quadrant D | 4,212,402 | 509,517 |
| Mode M9 | |||
|---|---|---|---|
| Quadrant | BADHDUFLAG | Total packets | Discarded packets |
| A | 0 | 10 | 0 |
| B | 0 | 10 | 0 |
| C | 0 | 10 | 0 |
| D | 0 | 10 | 0 |
| Mode M0 | |||
|---|---|---|---|
| Quadrant | BADHDUFLAG | Total packets | Discarded packets |
| A | 0 | 13013 | 2 |
| B | 0 | 12958 | 1 |
| C | 0 | 19285 | 1 |
| D | 0 | 16534 | 1 |
| Mode SS | |||
|---|---|---|---|
| Quadrant | BADHDUFLAG | Total packets | Discarded packets |
| A | 0 | 122 | 0 |
| B | 0 | 122 | 0 |
| C | 0 | 122 | 0 |
| D | 0 | 122 | 0 |
| Quadrant | Total seconds | Saturated seconds | Saturation percentage |
|---|---|---|---|
| A | 6045 | 90 | 1.488834% |
| B | 6045 | 91 | 1.505376% |
| C | 6045 | 666 | 11.017370% |
| D | 6045 | 233 | 3.854425% |
Noise dominated data is calculated using 1-second bins in cleaned event files. If a bin has >2000 counts, and if more than 50% of those come from <1% of pixels, then it is considered to be noise-dominated and hence unusable.
| Quadrant | # 1 sec bins | Bins with >0 counts | Bins with >2000 counts | High rate bins dominated by noise | Noise dominated (total time) | Noise dominated (detector-on time) | Marked lightcurve |
|---|---|---|---|---|---|---|---|
| A | 7016 | 6047 | 26 | 26 | 0.37% | 0.43% | 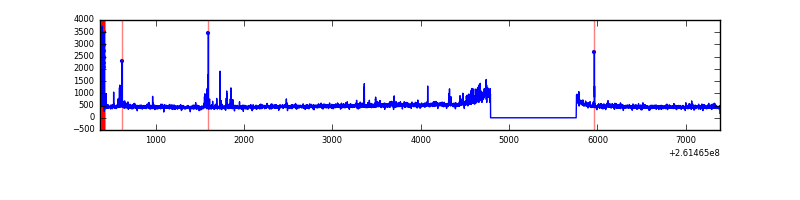 |
| B | 7016 | 6047 | 4 | 4 | 0.06% | 0.07% | 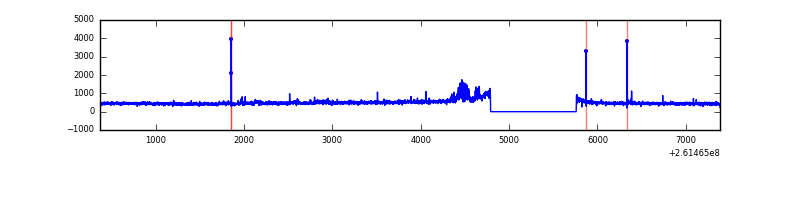 |
| C | 7016 | 6047 | 486 | 486 | 6.93% | 8.04% | 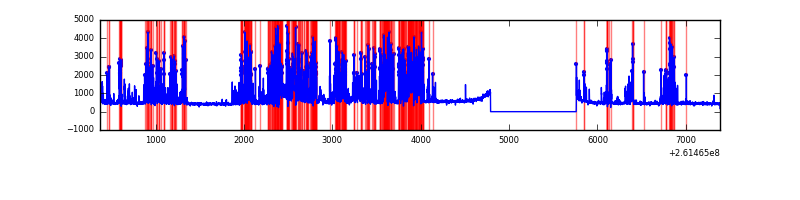 |
| D | 7016 | 6047 | 120 | 120 | 1.71% | 1.98% | 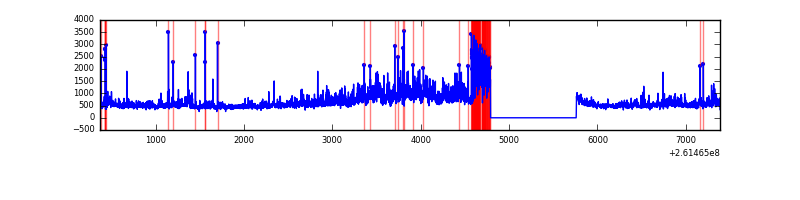 |
Top three noisy pixels from each quadrant. If the there are fewer than three noisy pixels in the level2.evt file, extra rows are filled as -1
| Pixel properties | Quadrant properties | ||||||
|---|---|---|---|---|---|---|---|
| Quadrant | DetID | PixID | Counts | Sigma | Mean | Median | Sigma |
| A | 9 | 143 | 142613 | 943.88 | 741 | 727 | 150.3 |
| A | 0 | 23 | 43335 | 283.45 | 741 | 727 | 150.3 |
| A | 1 | 162 | 11538 | 71.92 | 741 | 727 | 150.3 |
| B | 0 | 219 | 103294 | 727.44 | 736 | 719 | 141.0 |
| B | 4 | 80 | 18777 | 128.06 | 736 | 719 | 141.0 |
| B | 12 | 111 | 15679 | 106.09 | 736 | 719 | 141.0 |
| C | 9 | 236 | 2283258 | 14092.69 | 696 | 702 | 162.0 |
| C | 3 | 233 | 69120 | 422.42 | 696 | 702 | 162.0 |
| C | 14 | 234 | 44859 | 272.63 | 696 | 702 | 162.0 |
| D | 1 | 52 | 1154381 | 6650.82 | 706 | 687 | 173.5 |
| D | 5 | 222 | 171741 | 986.09 | 706 | 687 | 173.5 |
| D | 10 | 157 | 123072 | 705.53 | 706 | 687 | 173.5 |
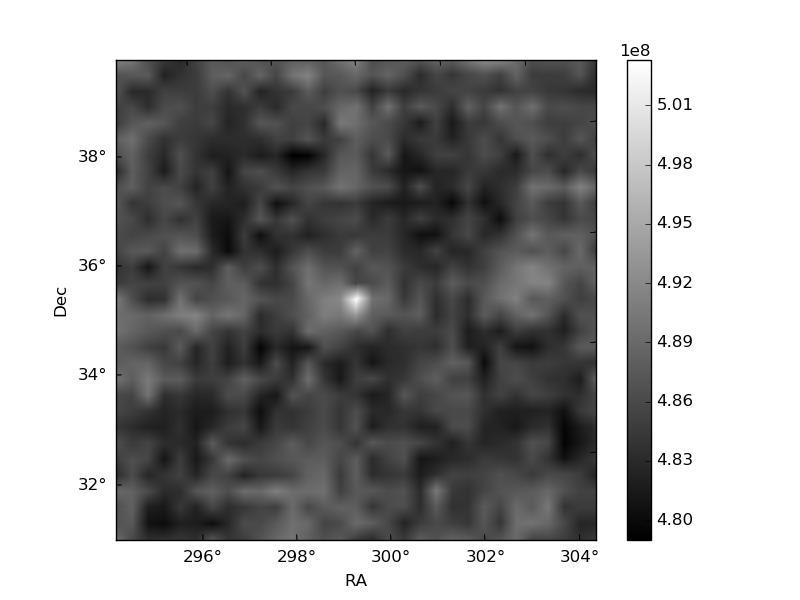
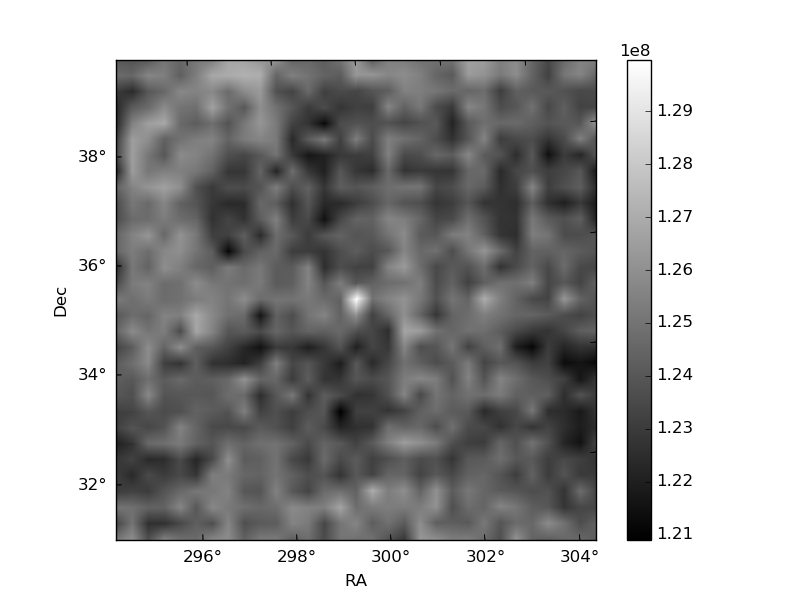
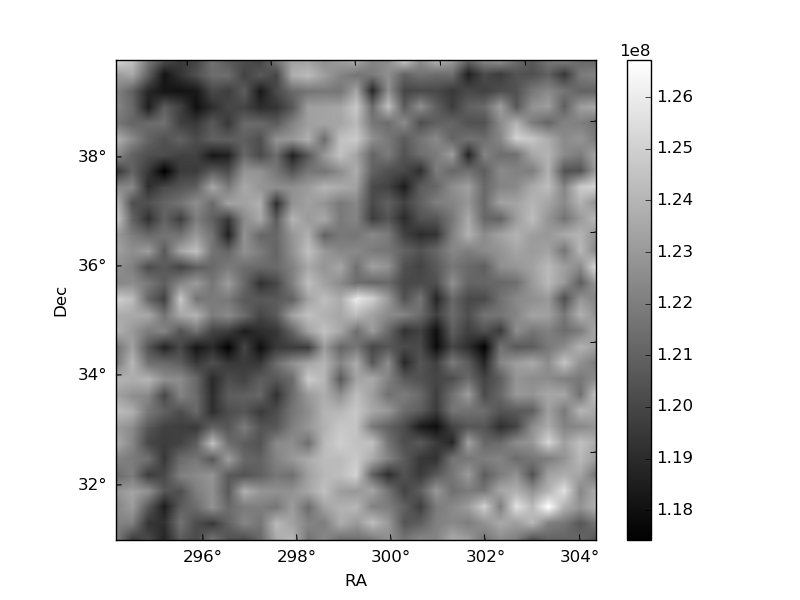
Histogram calculated using DETX and DETY for each event in the final _common_clean file
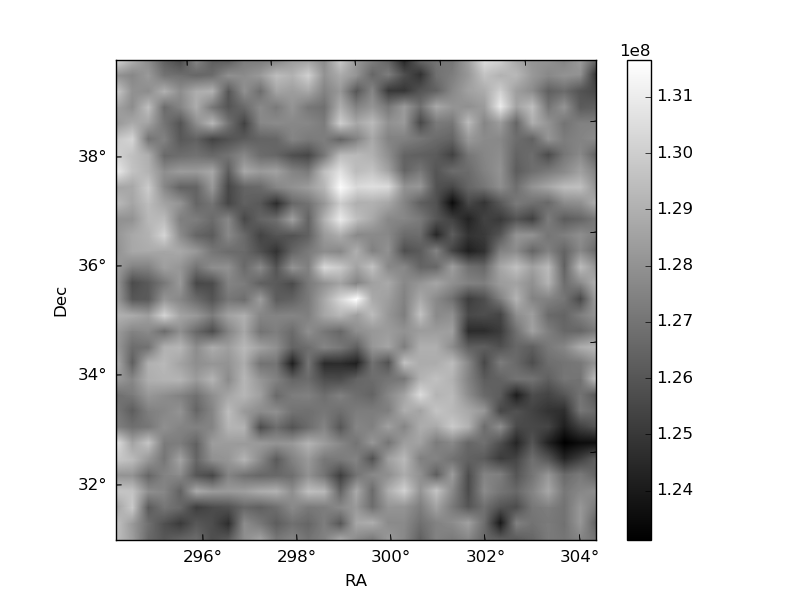
| Quadrant A | 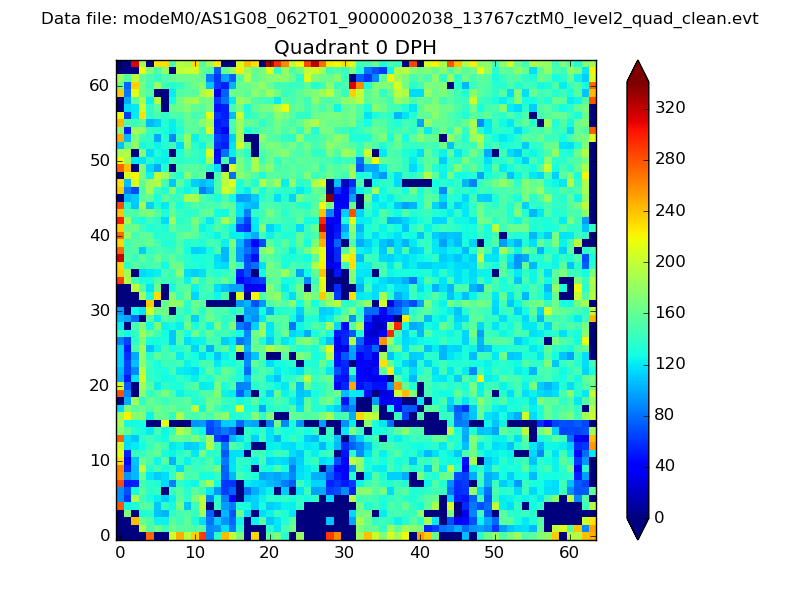 |
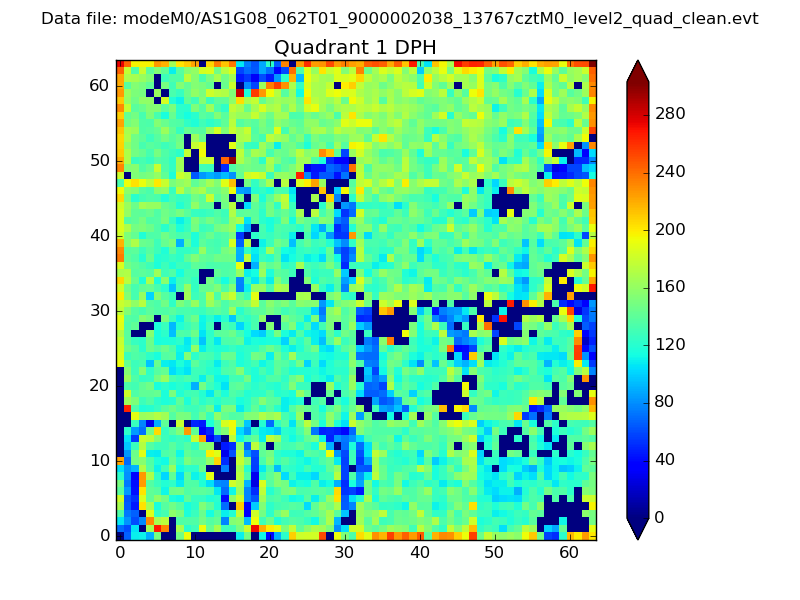 |
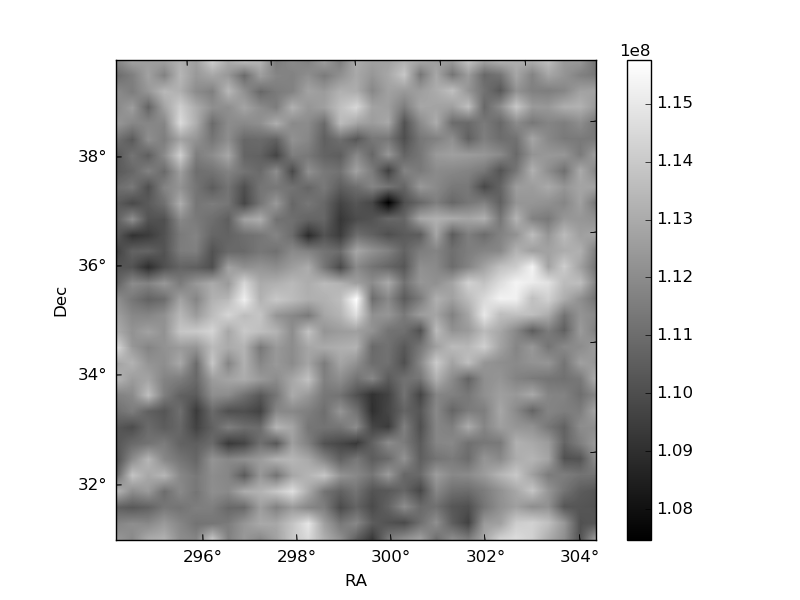
Quadrant B |
|---|---|---|---|
| Quadrant D | 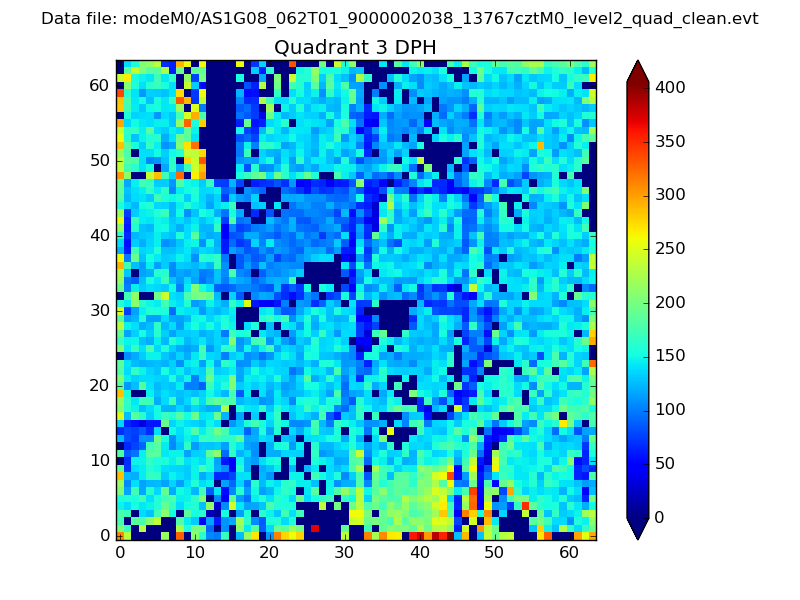 |
 |
Quadrant C |
| Plot type | Count rate plots | Images |
|---|---|---|
| Comparison with Poisson distribution Blue bars denote a histogram of data divided into 1 sec bins. Red curve is a Poisson curve with rate = median count rate of data. |
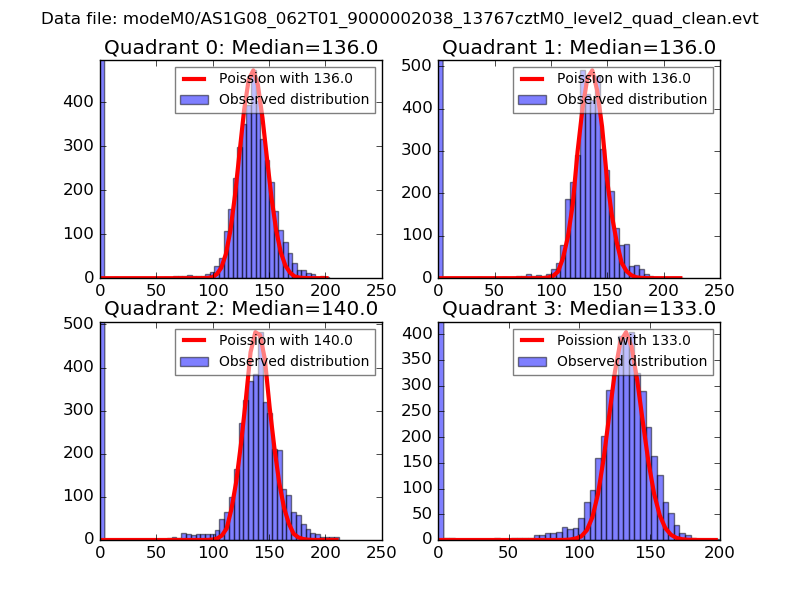 |
 |
| Quadrant-wise count rates Data is divided into 100 sec bins |
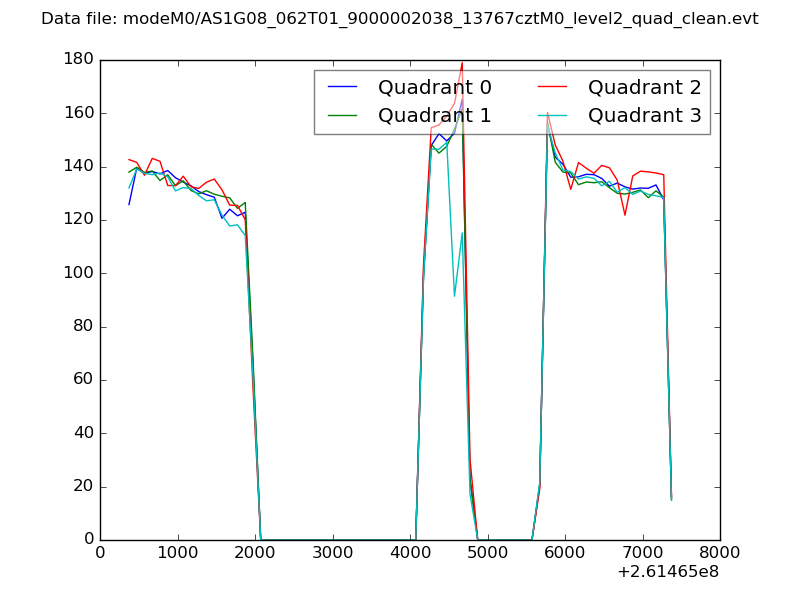 |
|
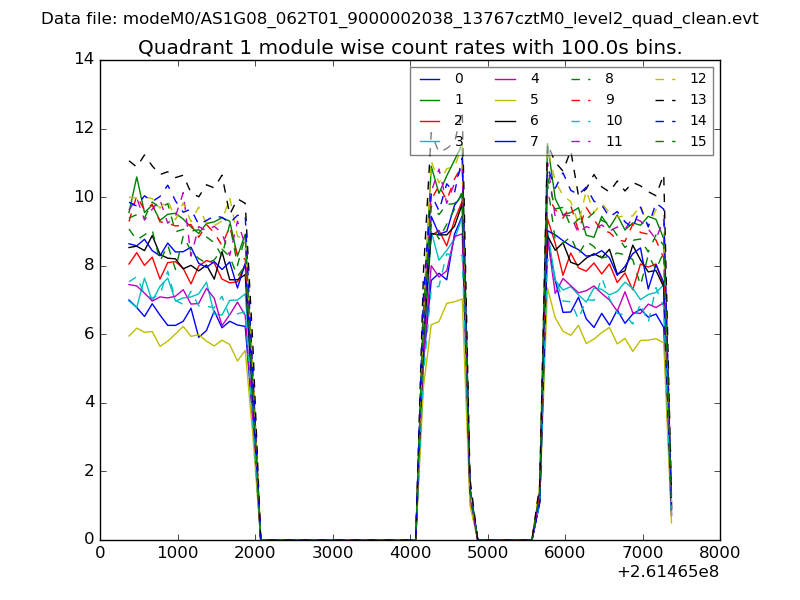
| Module-wise count rates for Quadrant A Data is divided into 100 sec bins |
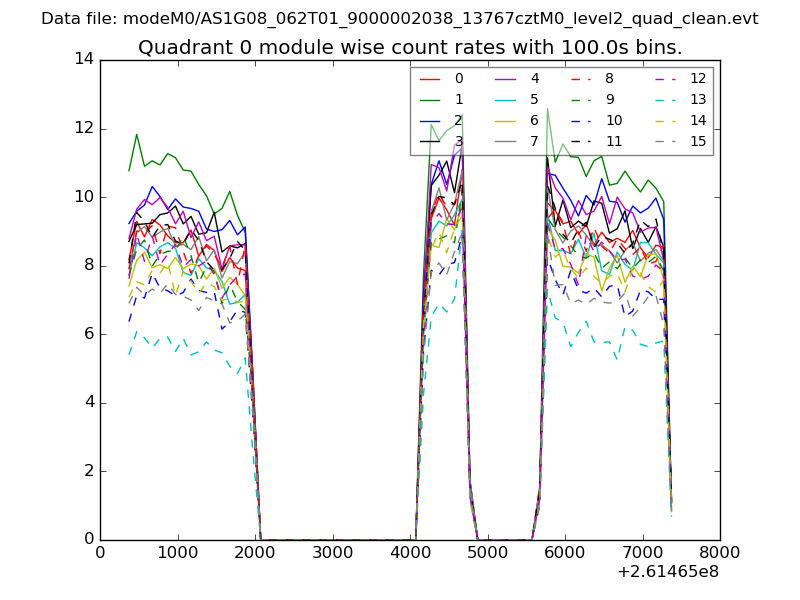 |
 |
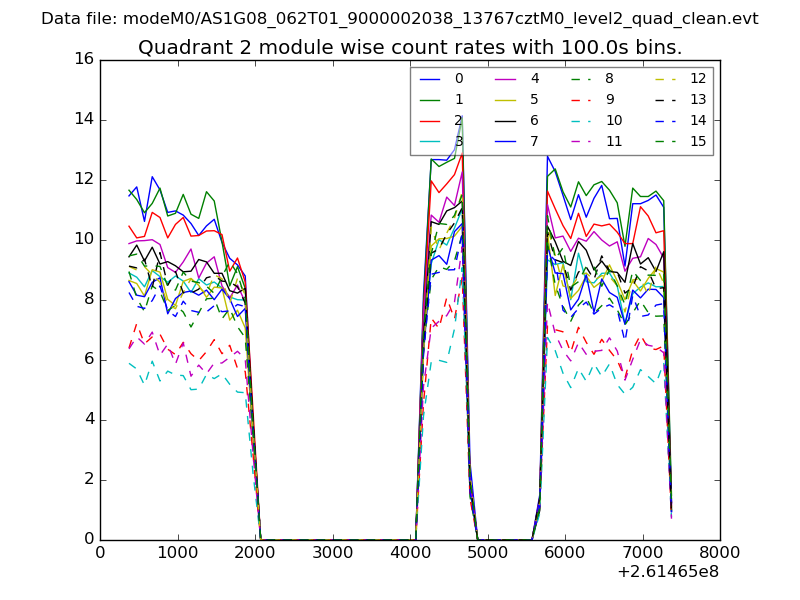
| Module-wise count rates for Quadrant B Data is divided into 100 sec bins |
 |
 |
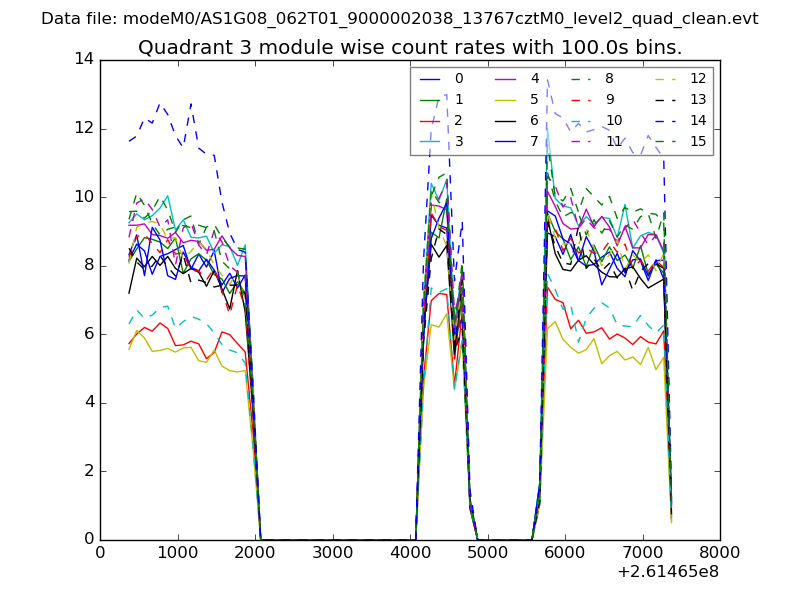
| Module-wise count rates for Quadrant C Data is divided into 100 sec bins |
 |
 |
| Module-wise count rates for Quadrant D Data is divided into 100 sec bins |
 |
 |
| Parameter | Plot |
|---|---|
| CZT HV Monitor | 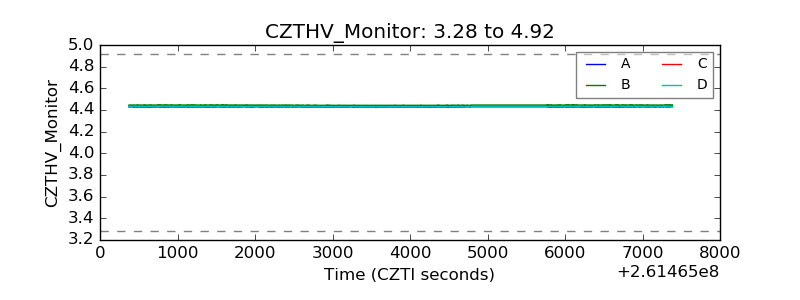 |
| D_VDD | 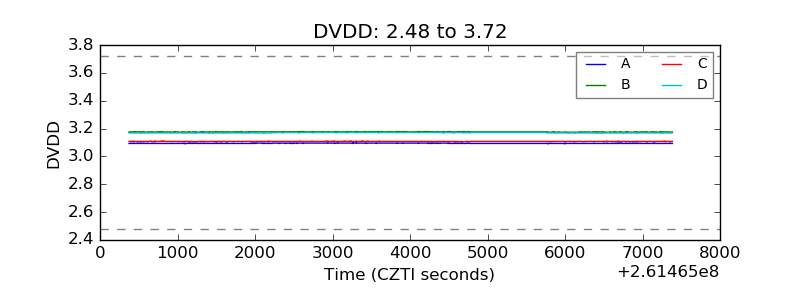 |
| Temperature 1 | 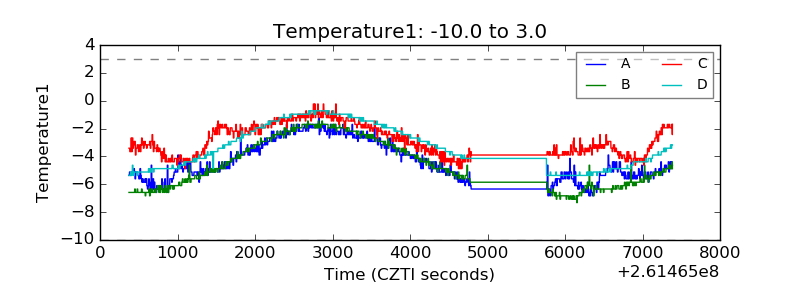 |
| Veto HV Monitor | 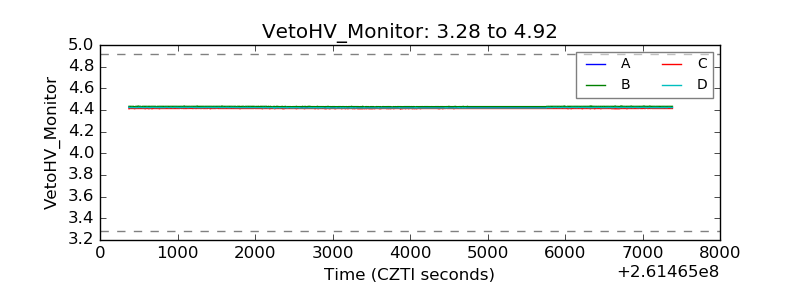 |
| Veto LLD | 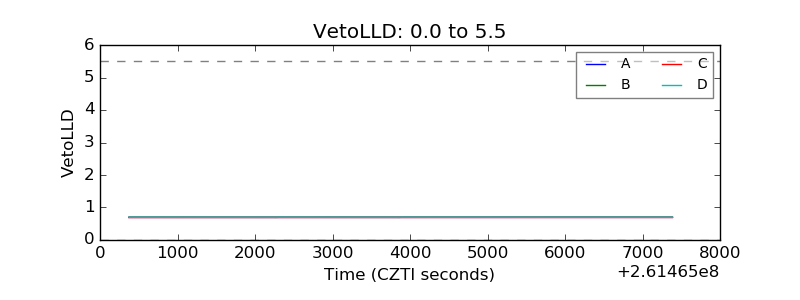 |
| Alpha Counter | 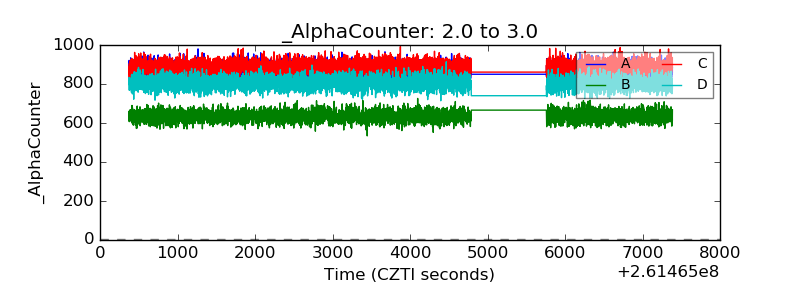 |
| _CPM_Rate | 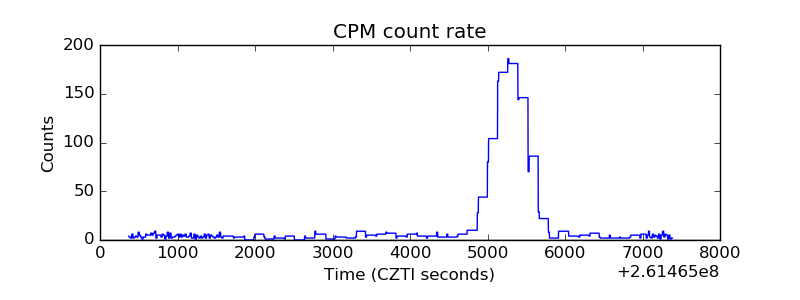 |
| CZT Counter | 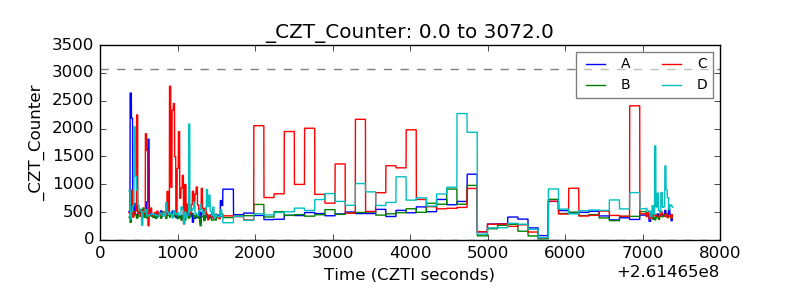 |
| +2.5 Volts monitor |  |
| +5 Volts monitor |  |
| _ROLL_ROT | 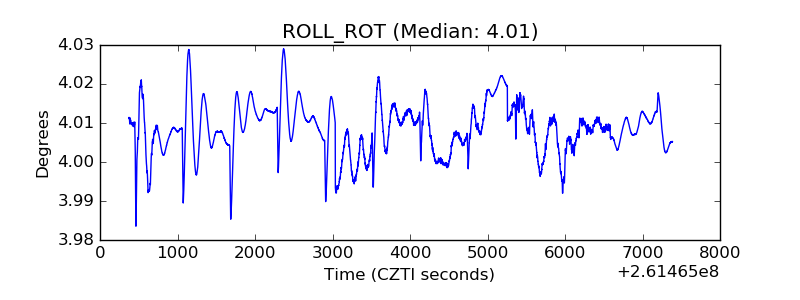 |
| _Roll_DEC | 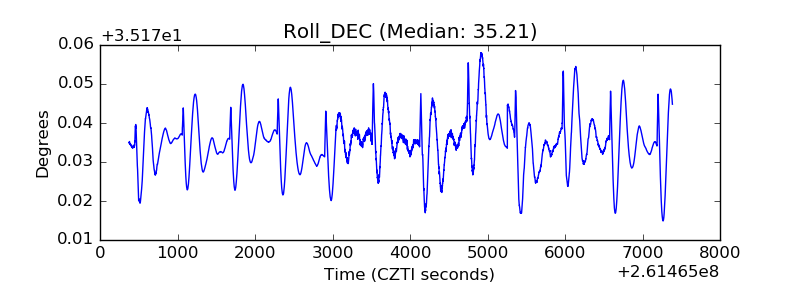 |
| _Roll_RA | 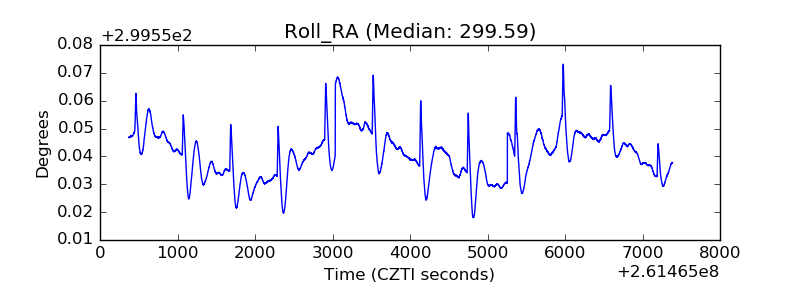 |
| Veto Counter | 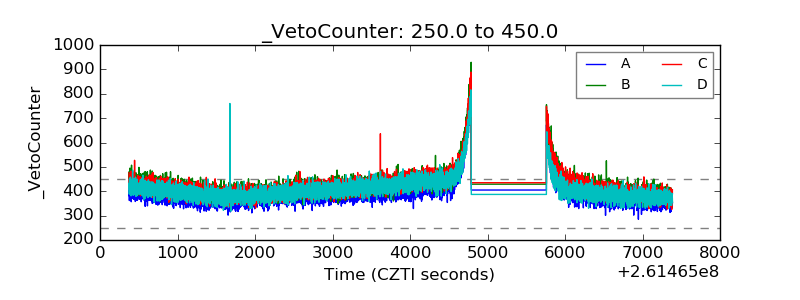 |