| Param | Original file | Final file |
|---|---|---|
| Filename | modeM0/AS1G08_062T01_9000002038_13768cztM0_level2.evt | modeM0/AS1G08_062T01_9000002038_13768cztM0_level2_quad_clean.evt |
| Size (bytes) | 518,558,400 | 94,501,440 |
| Size | 494.5 MB | 90.1 MB |
| Events in quadrant A | 3,400,530 | 593,835 |
| Events in quadrant B | 3,228,571 | 593,850 |
| Events in quadrant C | 3,856,359 | 621,134 |
| Events in quadrant D | 4,768,743 | 589,983 |
| Mode M9 | |||
|---|---|---|---|
| Quadrant | BADHDUFLAG | Total packets | Discarded packets |
| A | 0 | 6 | 0 |
| B | 0 | 6 | 0 |
| C | 0 | 6 | 0 |
| D | 0 | 6 | 0 |
| Mode M0 | |||
|---|---|---|---|
| Quadrant | BADHDUFLAG | Total packets | Discarded packets |
| A | 0 | 14416 | 2 |
| B | 0 | 13917 | 1 |
| C | 0 | 15741 | 1 |
| D | 0 | 18762 | 1 |
| Mode SS | |||
|---|---|---|---|
| Quadrant | BADHDUFLAG | Total packets | Discarded packets |
| A | 0 | 134 | 0 |
| B | 0 | 134 | 0 |
| C | 0 | 134 | 0 |
| D | 0 | 134 | 0 |
| Quadrant | Total seconds | Saturated seconds | Saturation percentage |
|---|---|---|---|
| A | 6642 | 160 | 2.408913% |
| B | 6642 | 83 | 1.249624% |
| C | 6642 | 196 | 2.950918% |
| D | 6642 | 93 | 1.400181% |
Noise dominated data is calculated using 1-second bins in cleaned event files. If a bin has >2000 counts, and if more than 50% of those come from <1% of pixels, then it is considered to be noise-dominated and hence unusable.
| Quadrant | # 1 sec bins | Bins with >0 counts | Bins with >2000 counts | High rate bins dominated by noise | Noise dominated (total time) | Noise dominated (detector-on time) | Marked lightcurve |
|---|---|---|---|---|---|---|---|
| A | 7213 | 6644 | 61 | 61 | 0.85% | 0.92% | 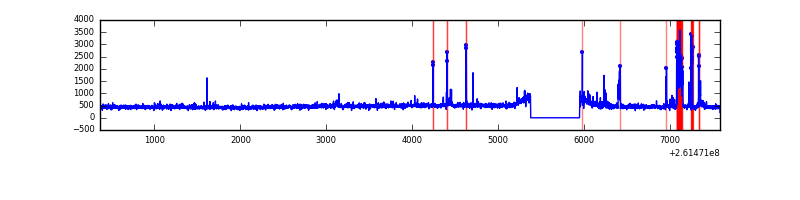 |
| B | 7213 | 6644 | 9 | 9 | 0.12% | 0.14% | 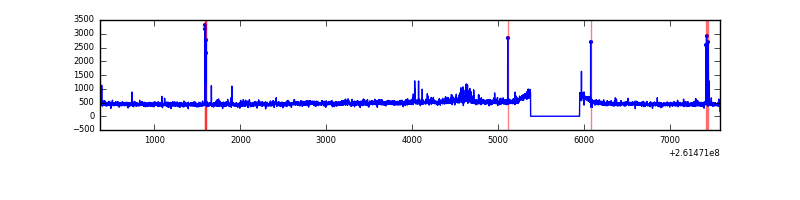 |
| C | 7213 | 6644 | 132 | 132 | 1.83% | 1.99% | 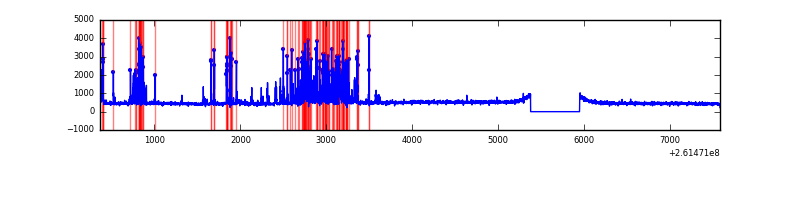 |
| D | 7213 | 6644 | 37 | 37 | 0.51% | 0.56% | 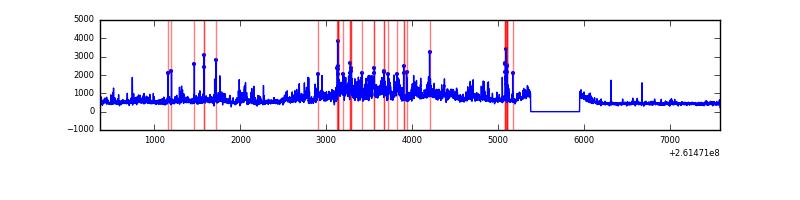 |
Top three noisy pixels from each quadrant. If the there are fewer than three noisy pixels in the level2.evt file, extra rows are filled as -1
| Pixel properties | Quadrant properties | ||||||
|---|---|---|---|---|---|---|---|
| Quadrant | DetID | PixID | Counts | Sigma | Mean | Median | Sigma |
| A | 9 | 143 | 263281 | 1602.04 | 801 | 785 | 163.9 |
| A | 15 | 69 | 19771 | 115.87 | 801 | 785 | 163.9 |
| A | 1 | 162 | 17902 | 104.47 | 801 | 785 | 163.9 |
| B | 0 | 219 | 48750 | 313.28 | 797 | 776 | 153.1 |
| B | 4 | 80 | 38949 | 249.28 | 797 | 776 | 153.1 |
| B | 3 | 209 | 21421 | 134.82 | 797 | 776 | 153.1 |
| C | 9 | 236 | 749628 | 4116.84 | 777 | 781 | 181.9 |
| C | 3 | 233 | 78006 | 424.55 | 777 | 781 | 181.9 |
| C | 13 | 61 | 5724 | 27.17 | 777 | 781 | 181.9 |
| D | 1 | 52 | 1346658 | 7040.92 | 780 | 757 | 191.2 |
| D | 5 | 222 | 201885 | 1052.18 | 780 | 757 | 191.2 |
| D | 10 | 157 | 147595 | 768.17 | 780 | 757 | 191.2 |
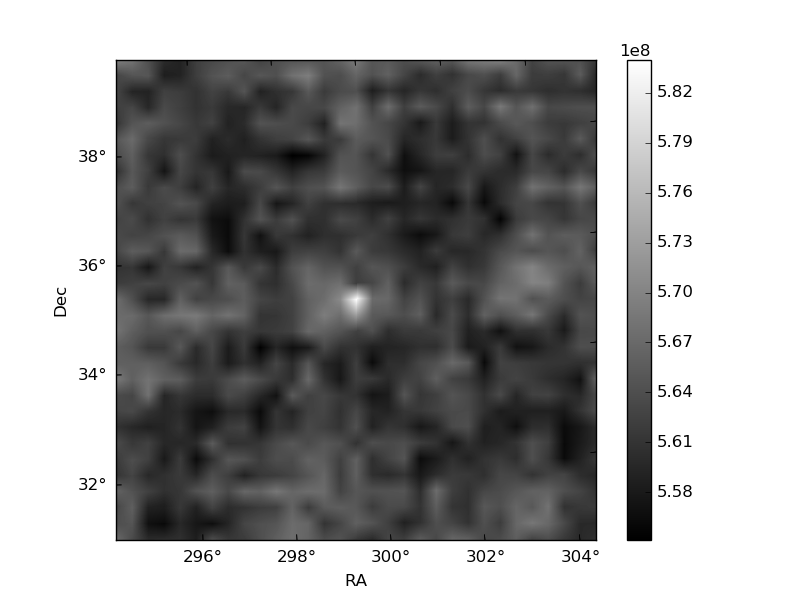
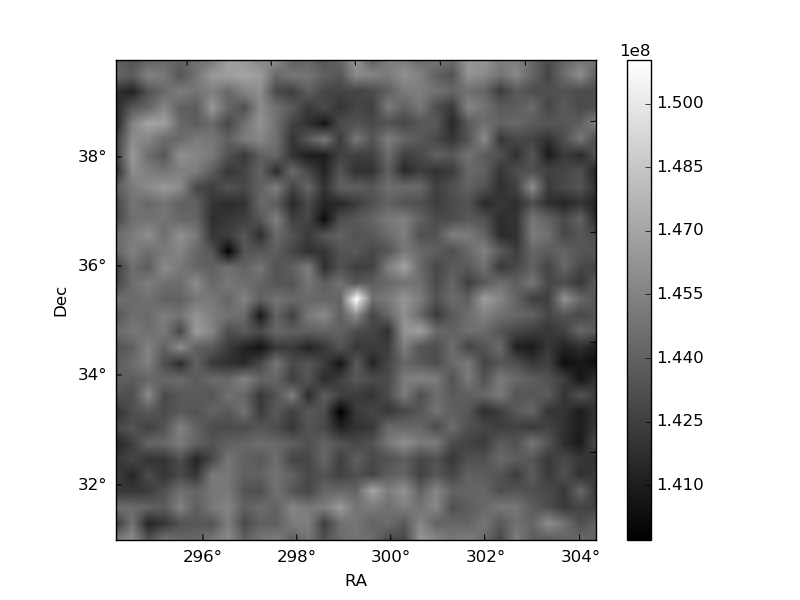
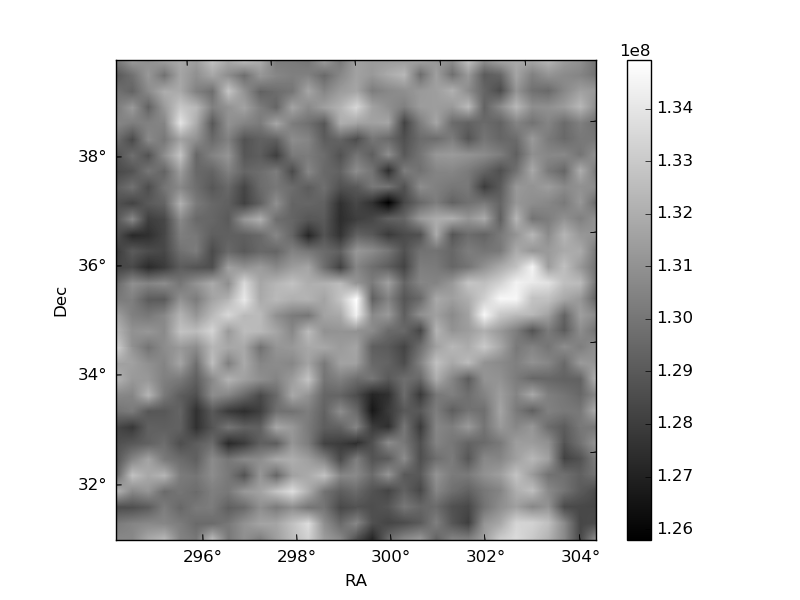
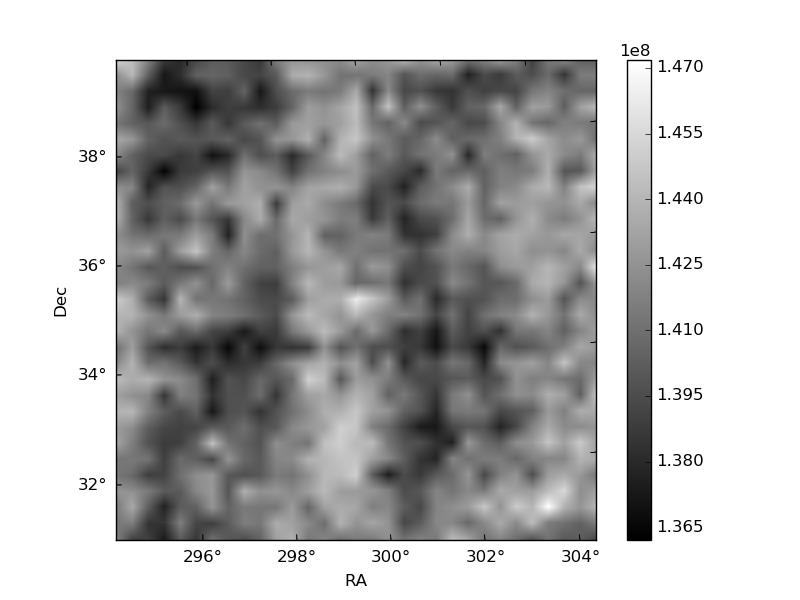
Histogram calculated using DETX and DETY for each event in the final _common_clean file
| Quadrant A | 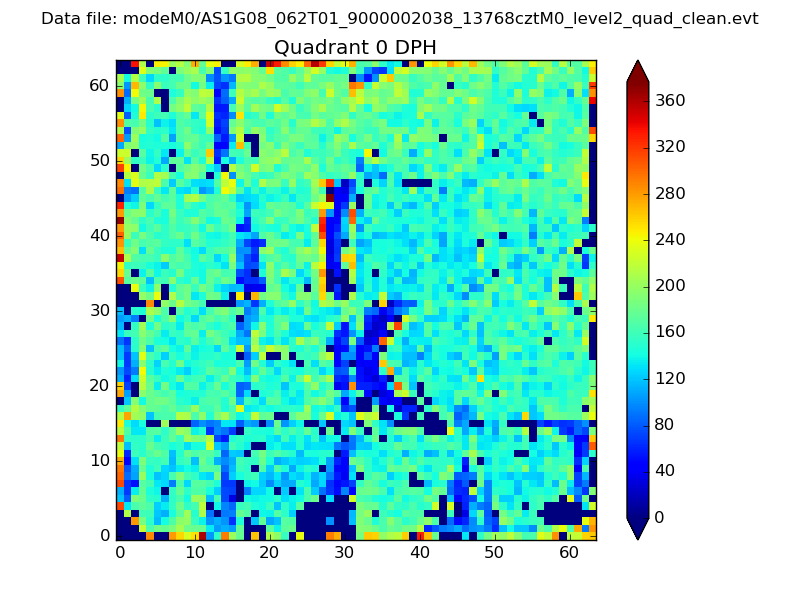 |
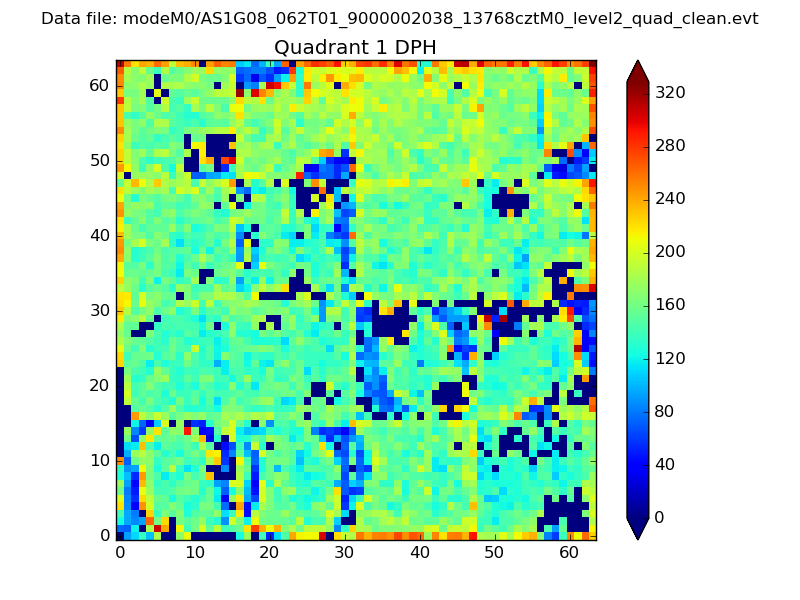 |
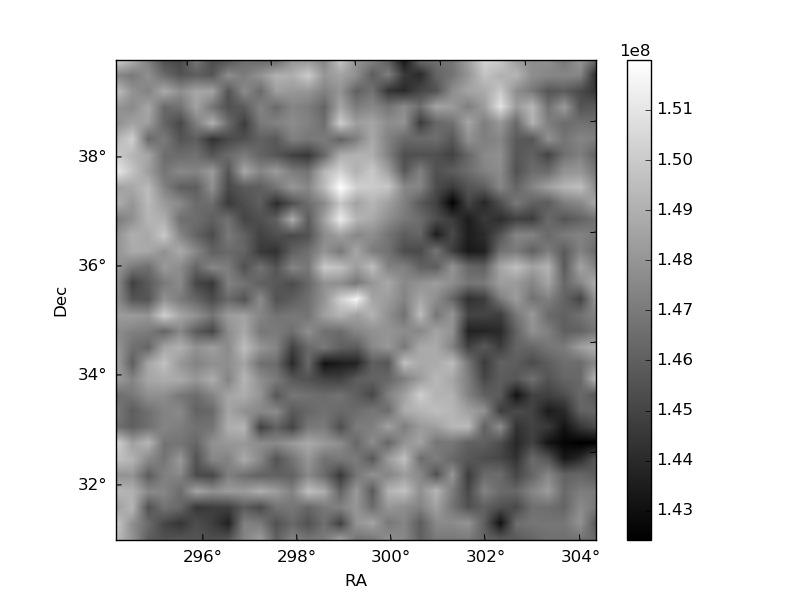
Quadrant B |
|---|---|---|---|
| Quadrant D | 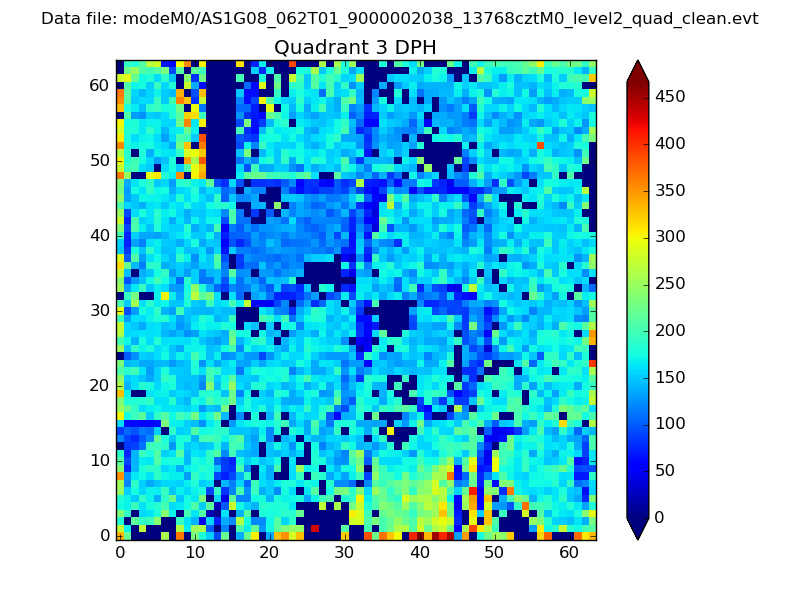 |
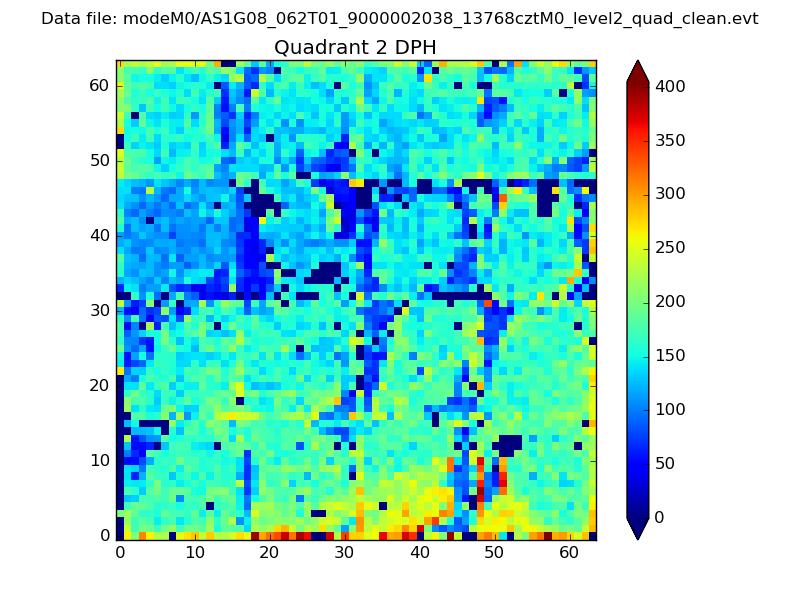 |
Quadrant C |
| Plot type | Count rate plots | Images |
|---|---|---|
| Comparison with Poisson distribution Blue bars denote a histogram of data divided into 1 sec bins. Red curve is a Poisson curve with rate = median count rate of data. |
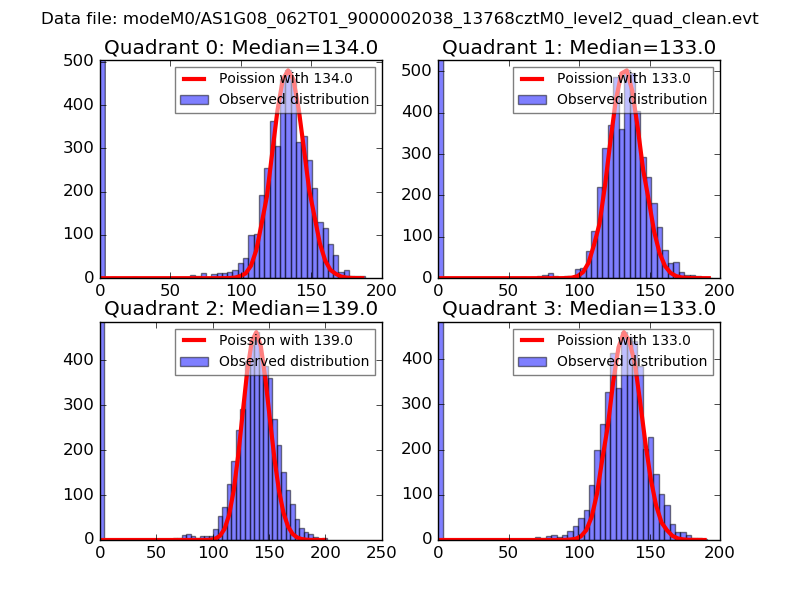 |
 |
| Quadrant-wise count rates Data is divided into 100 sec bins |
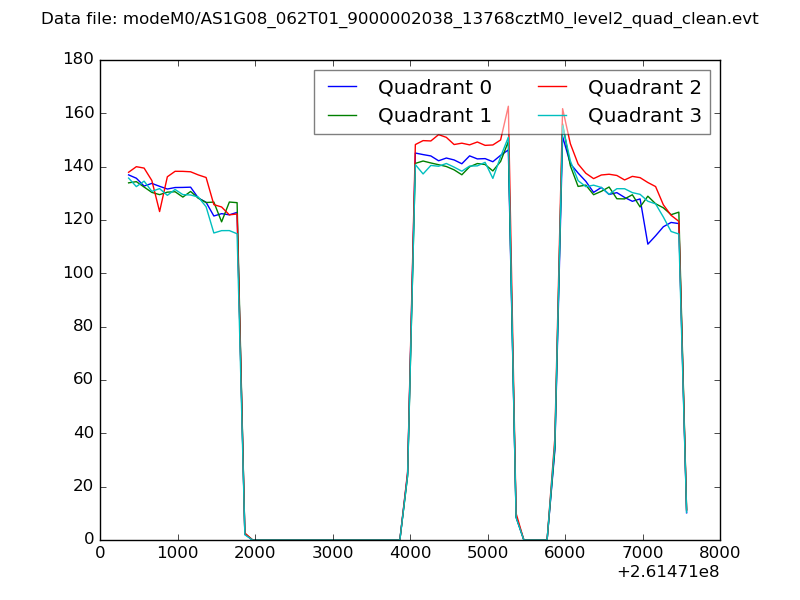 |
|
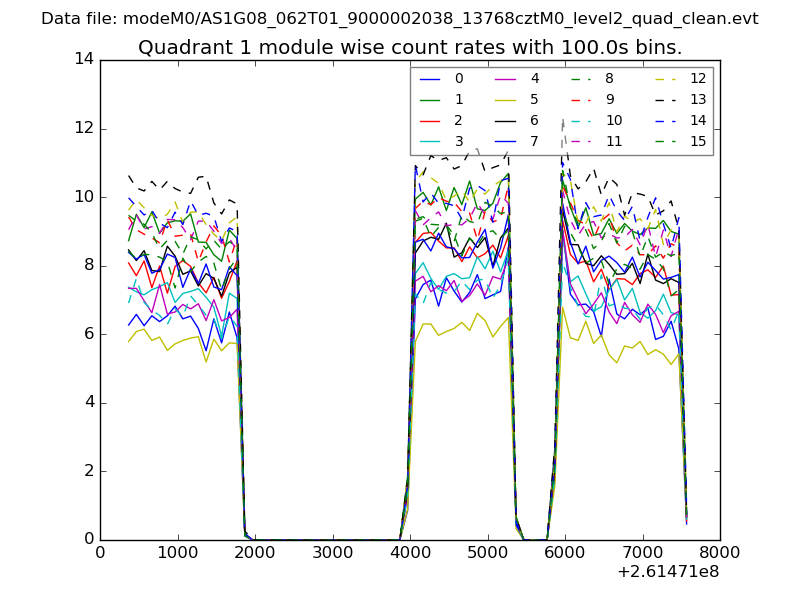
| Module-wise count rates for Quadrant A Data is divided into 100 sec bins |
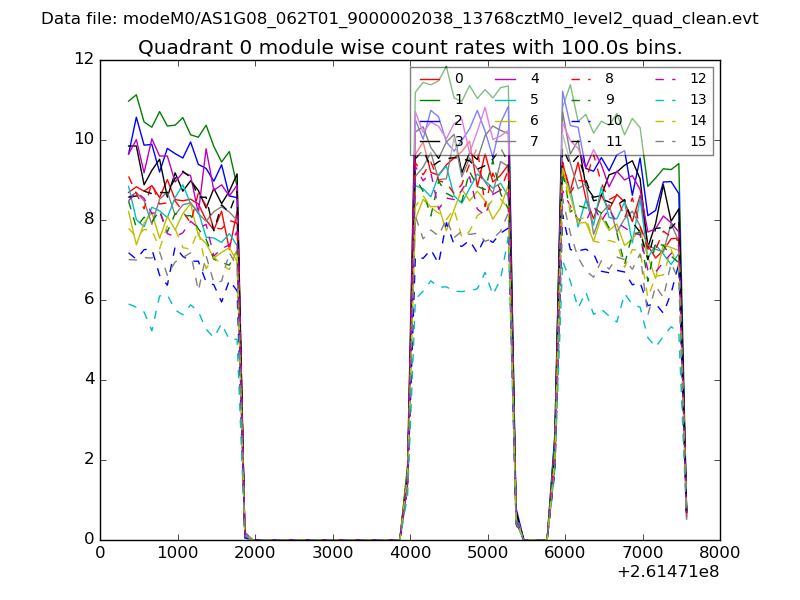 |
 |
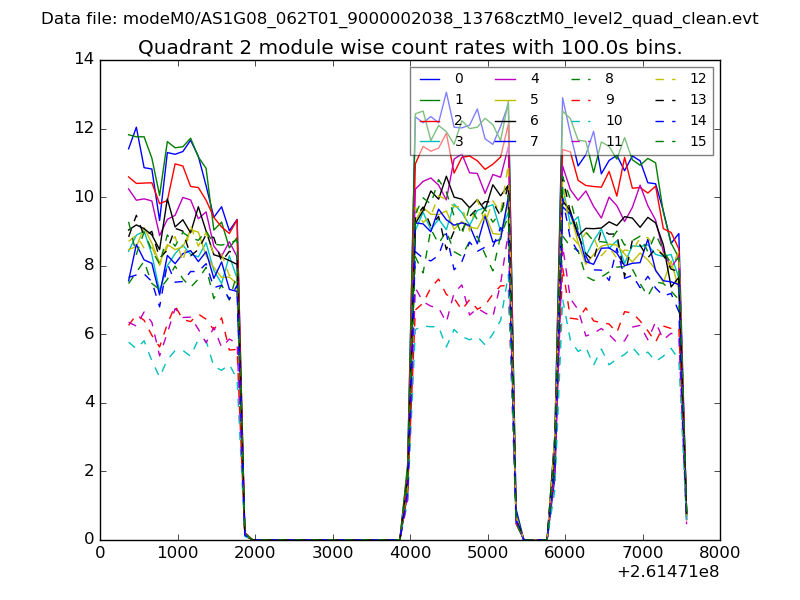
| Module-wise count rates for Quadrant B Data is divided into 100 sec bins |
 |
 |
| Module-wise count rates for Quadrant C Data is divided into 100 sec bins |
 |
 |
| Module-wise count rates for Quadrant D Data is divided into 100 sec bins |
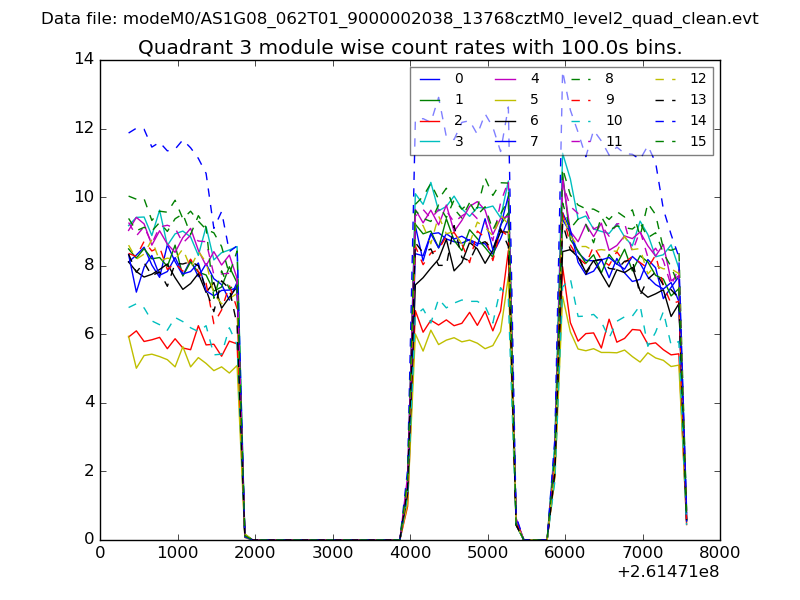 |
 |
| Parameter | Plot |
|---|---|
| CZT HV Monitor | 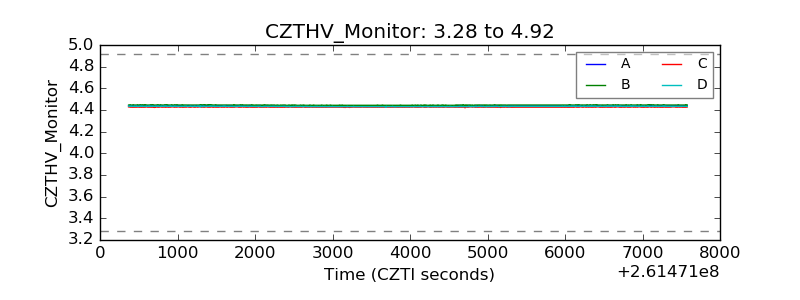 |
| D_VDD | 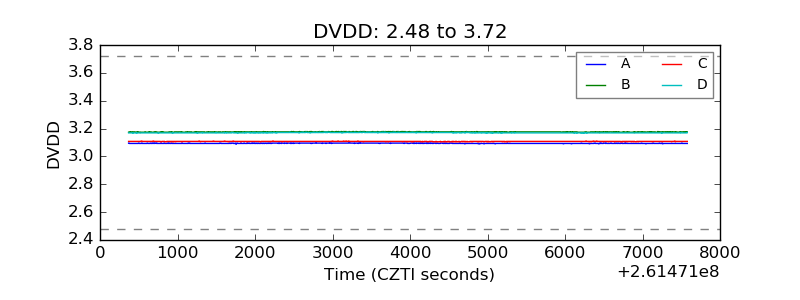 |
| Temperature 1 | 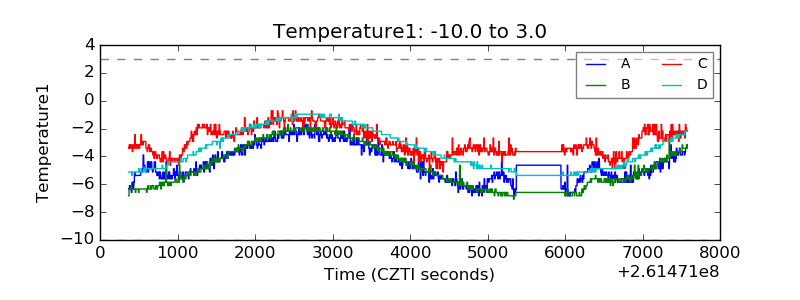 |
| Veto HV Monitor | 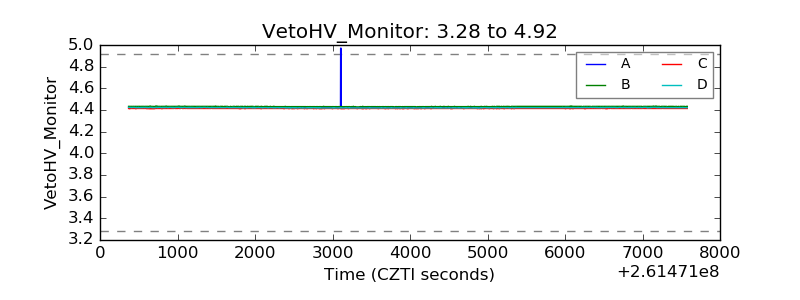 |
| Veto LLD | 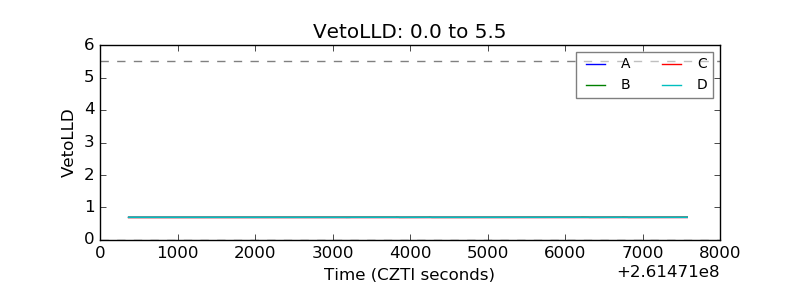 |
| Alpha Counter | 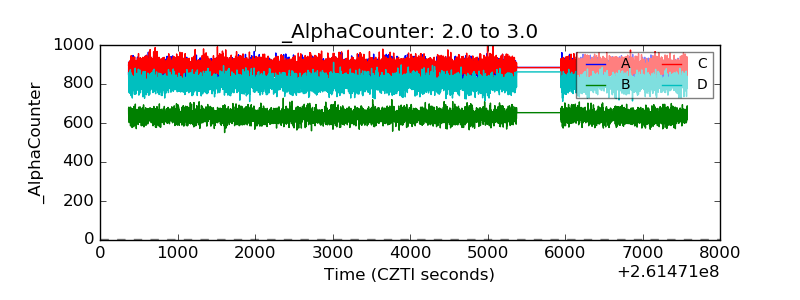 |
| _CPM_Rate | 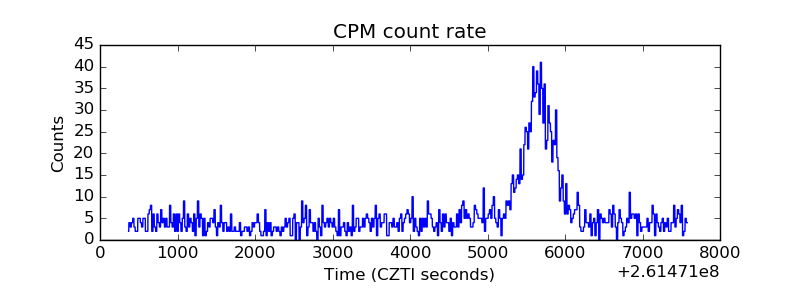 |
| CZT Counter | 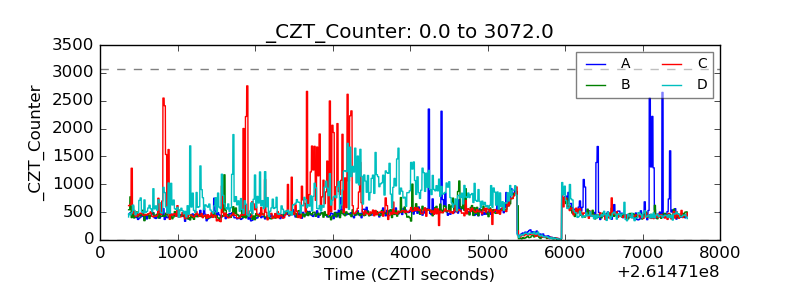 |
| +2.5 Volts monitor | 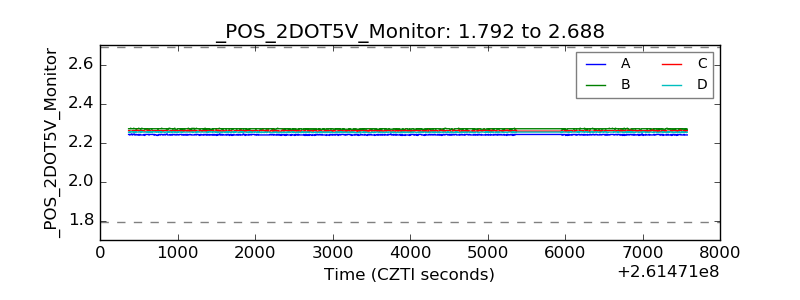 |
| +5 Volts monitor |  |
| _ROLL_ROT |  |
| _Roll_DEC | 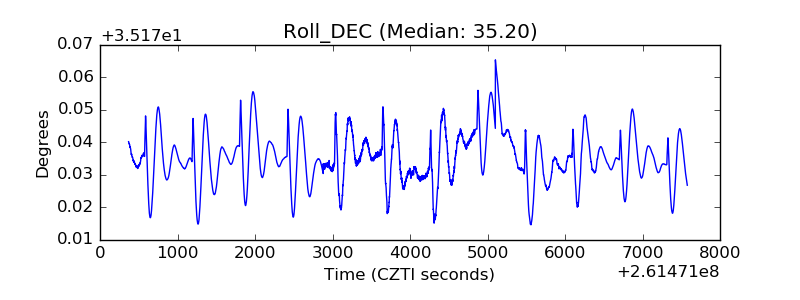 |
| _Roll_RA | 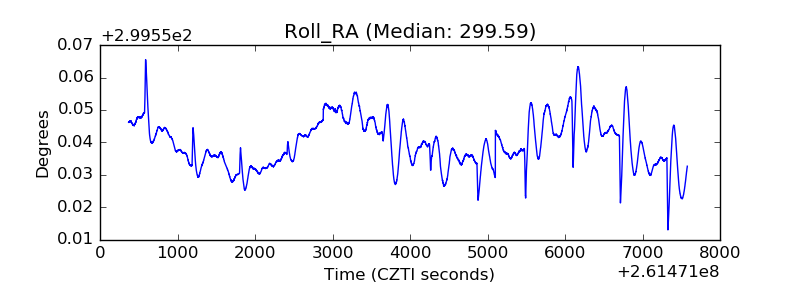 |
| Veto Counter | 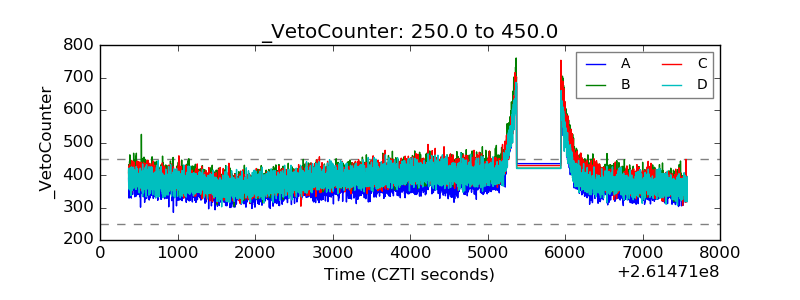 |