| Param | Original file | Final file |
|---|---|---|
| Filename | modeM0/AS1G08_062T01_9000002038_13769cztM0_level2.evt | modeM0/AS1G08_062T01_9000002038_13769cztM0_level2_quad_clean.evt |
| Size (bytes) | 304,194,240 | 48,553,920 |
| Size | 290.1 MB | 46.3 MB |
| Events in quadrant A | 2,251,951 | 285,654 |
| Events in quadrant B | 2,263,829 | 285,761 |
| Events in quadrant C | 2,006,297 | 301,781 |
| Events in quadrant D | 2,390,209 | 287,020 |
| Mode M0 | |||
|---|---|---|---|
| Quadrant | BADHDUFLAG | Total packets | Discarded packets |
| A | 0 | 9533 | 0 |
| B | 0 | 9560 | 0 |
| C | 0 | 8826 | 0 |
| D | 0 | 9991 | 0 |
| Mode SS | |||
|---|---|---|---|
| Quadrant | BADHDUFLAG | Total packets | Discarded packets |
| A | 0 | 88 | 0 |
| B | 0 | 88 | 0 |
| C | 0 | 88 | 0 |
| D | 0 | 88 | 0 |
| Quadrant | Total seconds | Saturated seconds | Saturation percentage |
|---|---|---|---|
| A | 4401 | 79 | 1.795047% |
| B | 4401 | 37 | 0.840718% |
| C | 4401 | 0 | 0.000000% |
| D | 4401 | 55 | 1.249716% |
Noise dominated data is calculated using 1-second bins in cleaned event files. If a bin has >2000 counts, and if more than 50% of those come from <1% of pixels, then it is considered to be noise-dominated and hence unusable.
| Quadrant | # 1 sec bins | Bins with >0 counts | Bins with >2000 counts | High rate bins dominated by noise | Noise dominated (total time) | Noise dominated (detector-on time) | Marked lightcurve |
|---|---|---|---|---|---|---|---|
| A | 4402 | 4402 | 57 | 57 | 1.29% | 1.29% | 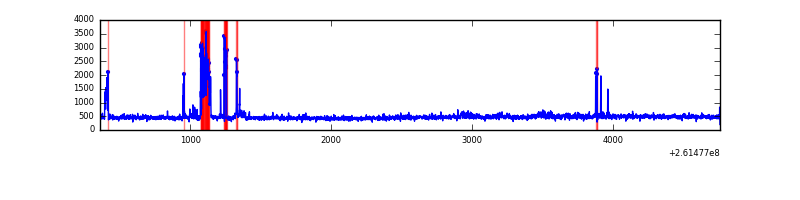 |
| B | 4402 | 4402 | 25 | 25 | 0.57% | 0.57% | 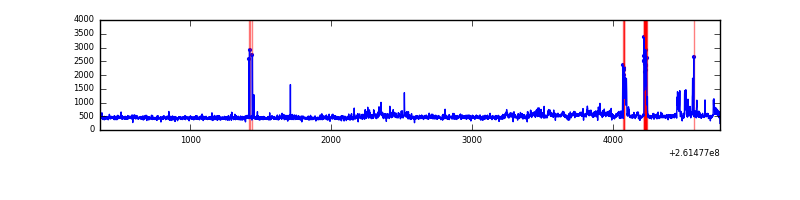 |
| C | 4402 | 4402 | 0 | 0 | 0.00% | 0.00% | 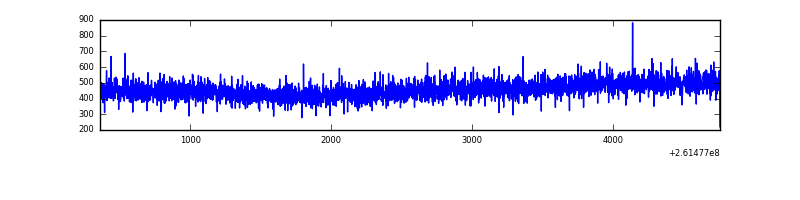 |
| D | 4402 | 4402 | 43 | 43 | 0.98% | 0.98% | 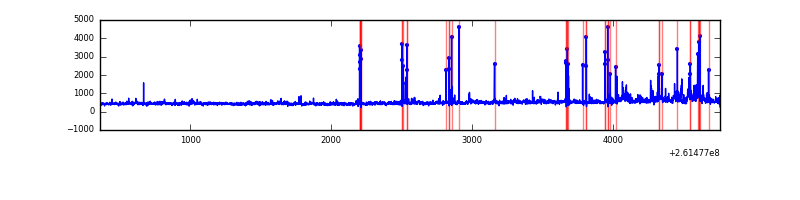 |
Top three noisy pixels from each quadrant. If the there are fewer than three noisy pixels in the level2.evt file, extra rows are filled as -1
| Pixel properties | Quadrant properties | ||||||
|---|---|---|---|---|---|---|---|
| Quadrant | DetID | PixID | Counts | Sigma | Mean | Median | Sigma |
| A | 9 | 143 | 218792 | 2074.87 | 510 | 499 | 105.2 |
| A | 0 | 23 | 32530 | 304.45 | 510 | 499 | 105.2 |
| A | 15 | 69 | 21967 | 204.05 | 510 | 499 | 105.2 |
| B | 3 | 64 | 150769 | 1527.9 | 506 | 492 | 98.4 |
| B | 0 | 219 | 91800 | 928.35 | 506 | 492 | 98.4 |
| B | 3 | 209 | 21276 | 211.32 | 506 | 492 | 98.4 |
| C | 3 | 233 | 58114 | 488.41 | 499 | 503 | 118.0 |
| C | 13 | 61 | 3677 | 26.91 | 499 | 503 | 118.0 |
| C | 12 | 4 | 1572 | 9.06 | 499 | 503 | 118.0 |
| D | 1 | 52 | 305932 | 2503.44 | 498 | 483 | 122.0 |
| D | 10 | 157 | 128933 | 1052.77 | 498 | 483 | 122.0 |
| D | 13 | 249 | 36217 | 292.87 | 498 | 483 | 122.0 |
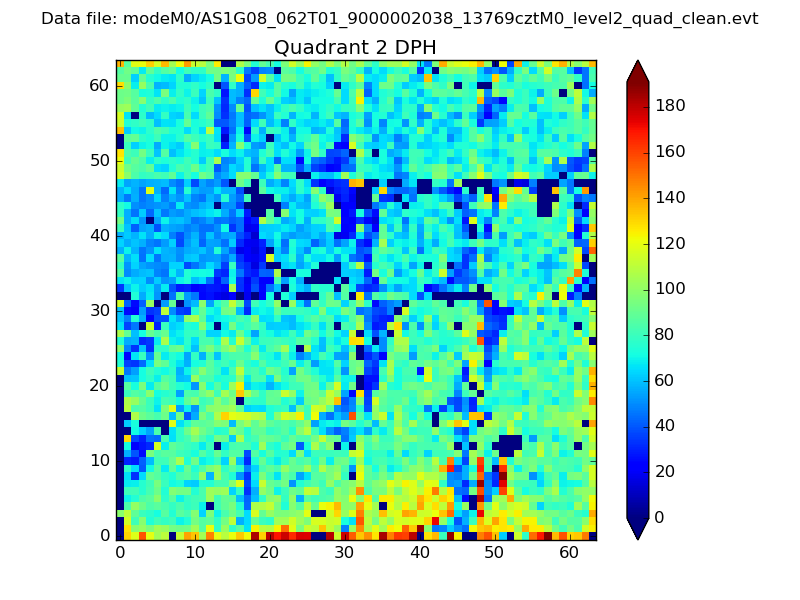
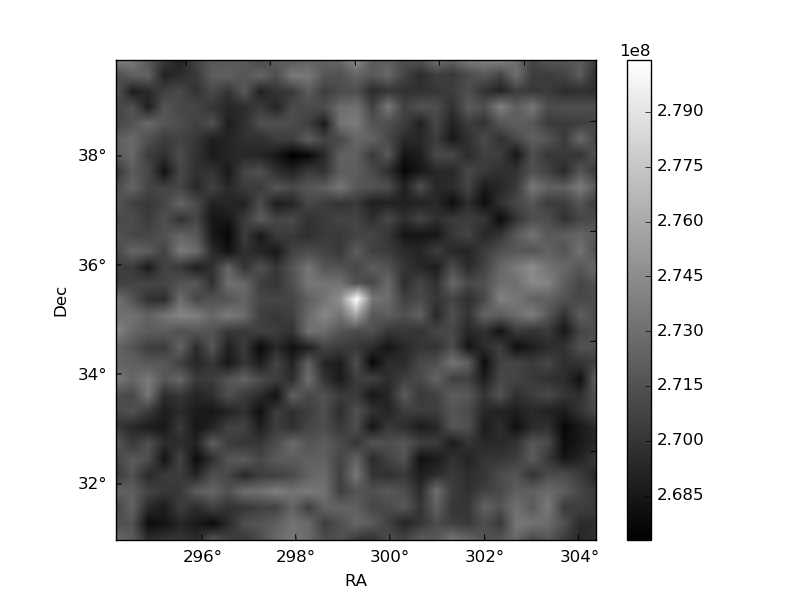
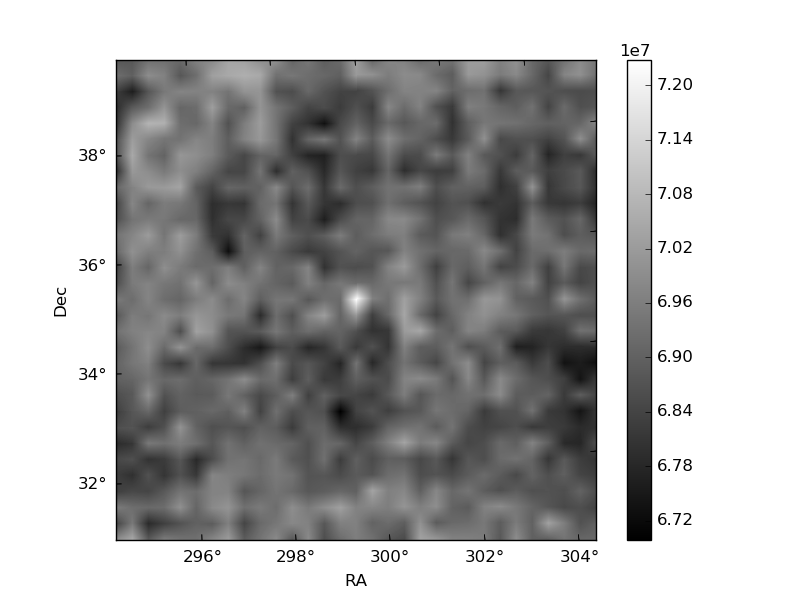
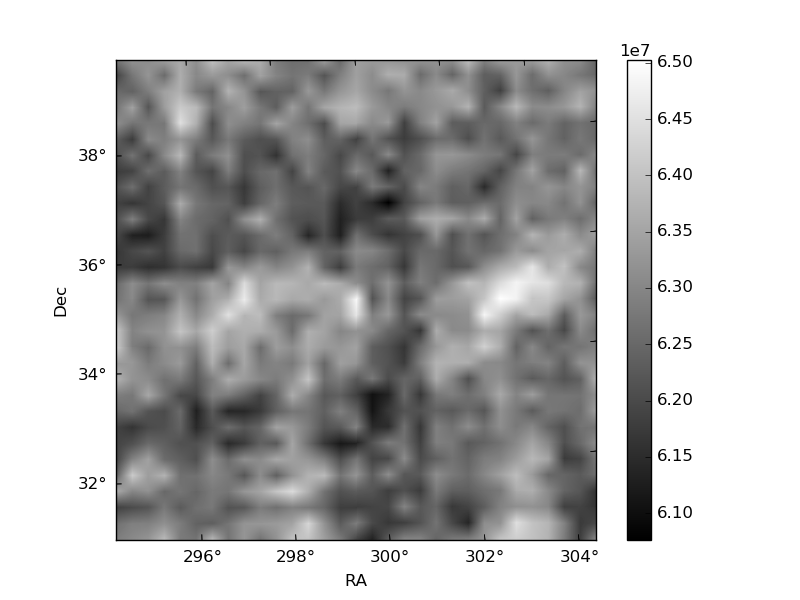
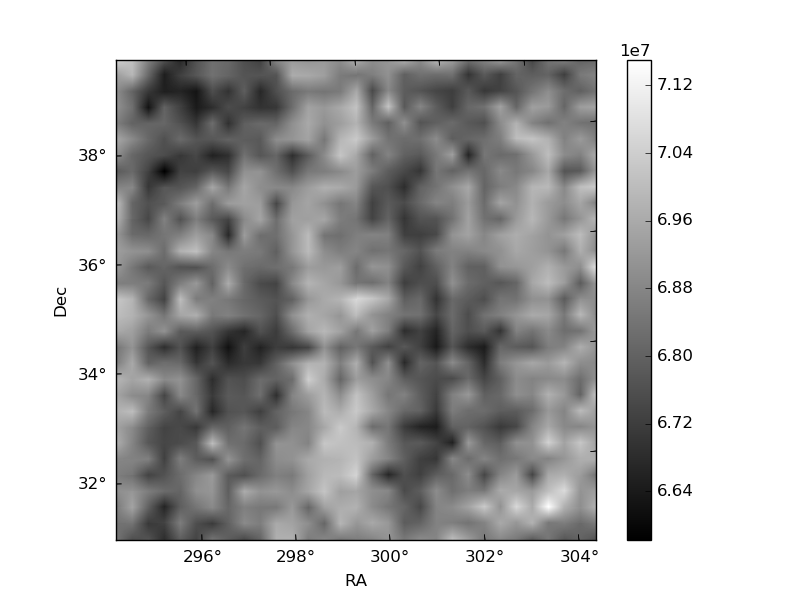
Histogram calculated using DETX and DETY for each event in the final _common_clean file
| Quadrant A | 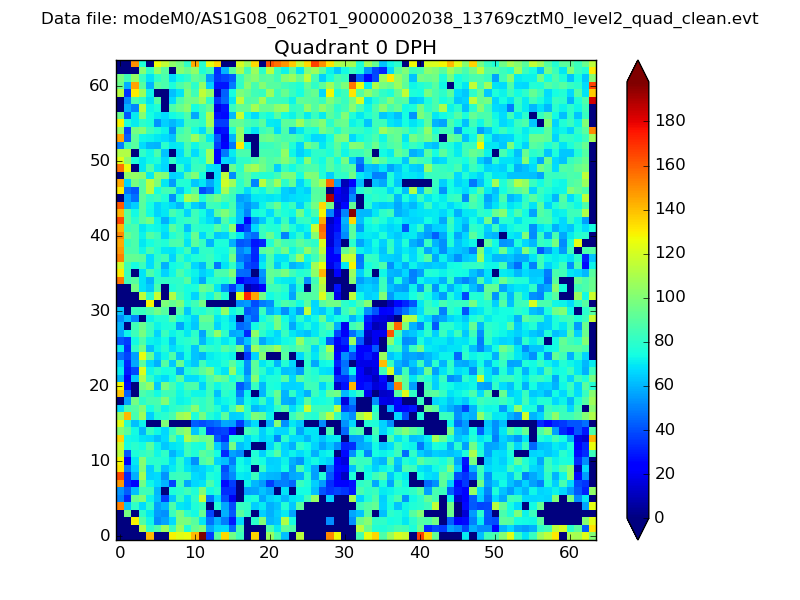 |
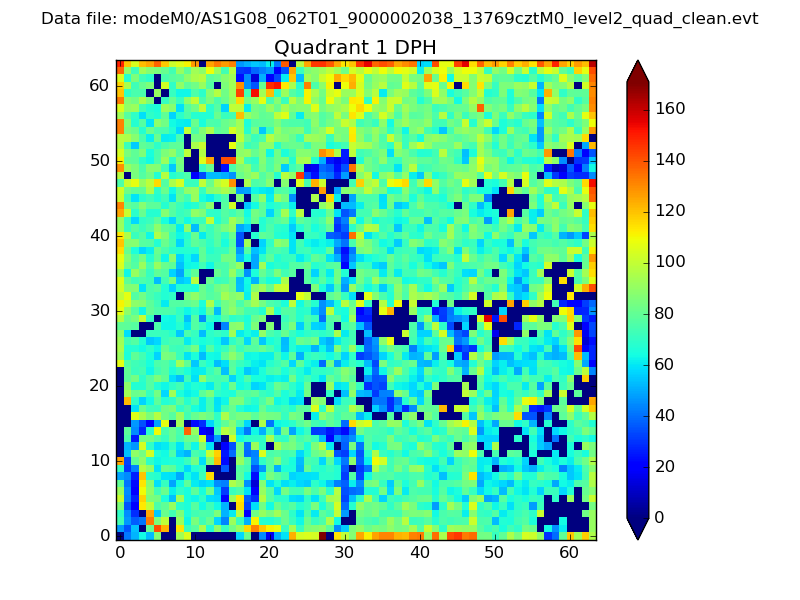 |
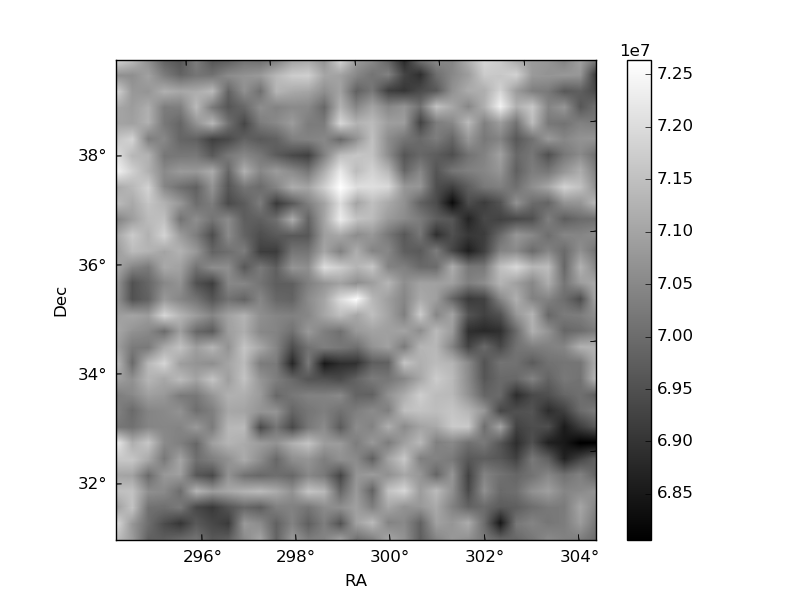
Quadrant B |
|---|---|---|---|
| Quadrant D | 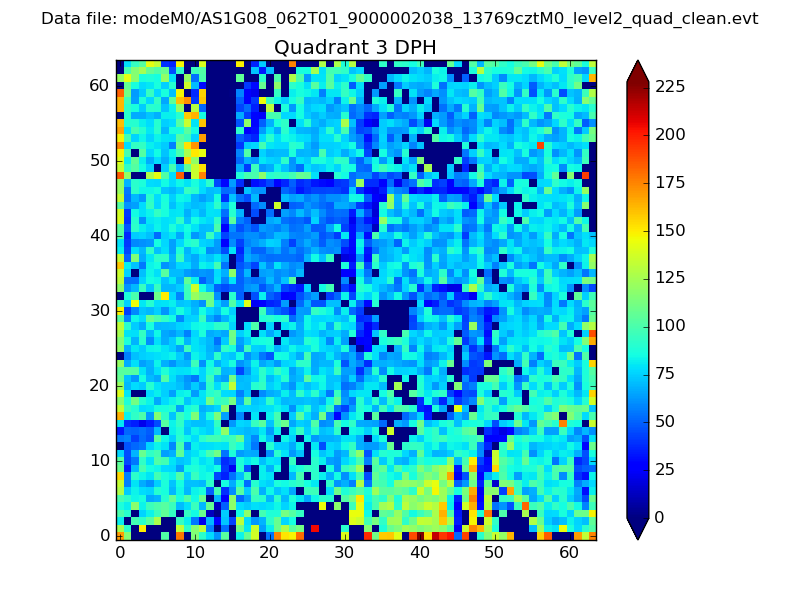 |
 |
Quadrant C |
| Plot type | Count rate plots | Images |
|---|---|---|
| Comparison with Poisson distribution Blue bars denote a histogram of data divided into 1 sec bins. Red curve is a Poisson curve with rate = median count rate of data. |
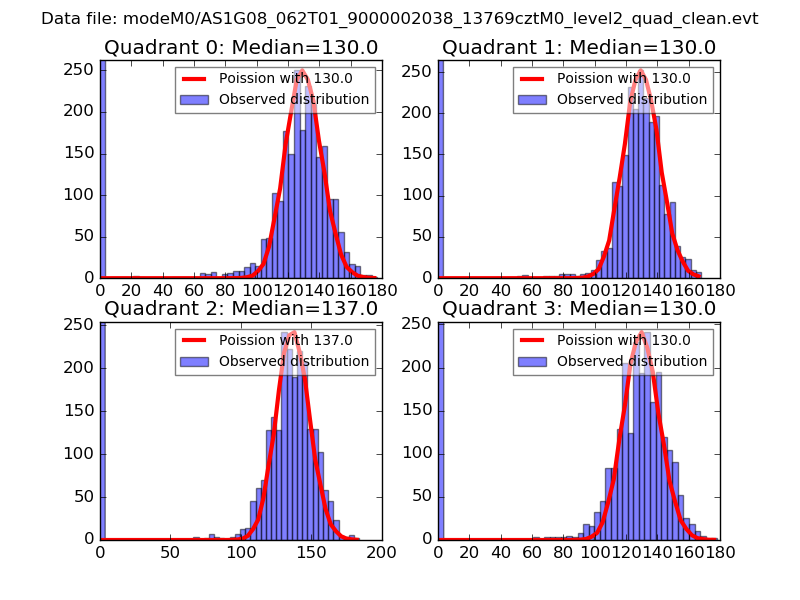 |
 |
| Quadrant-wise count rates Data is divided into 100 sec bins |
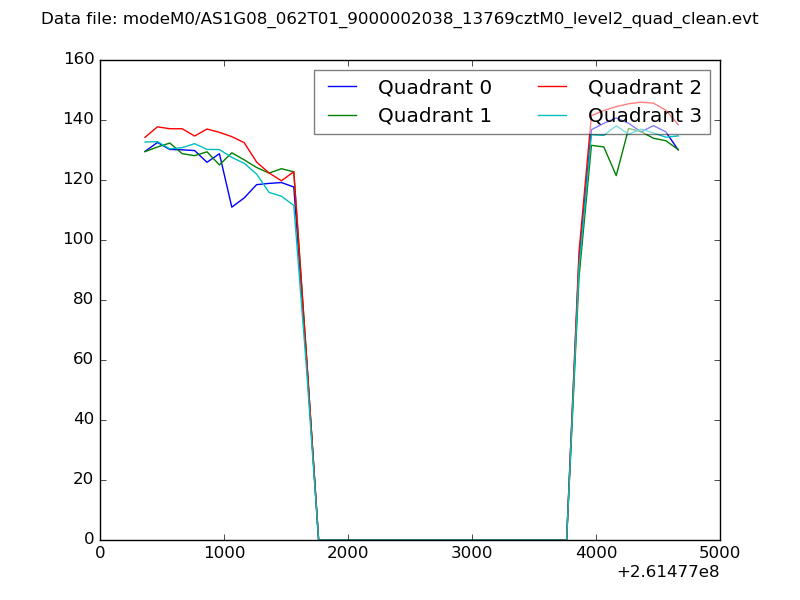 |
|
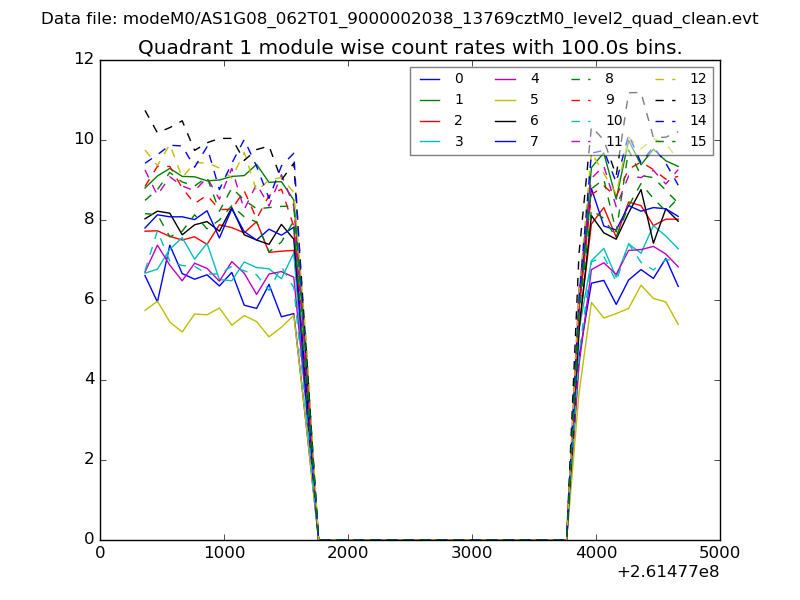
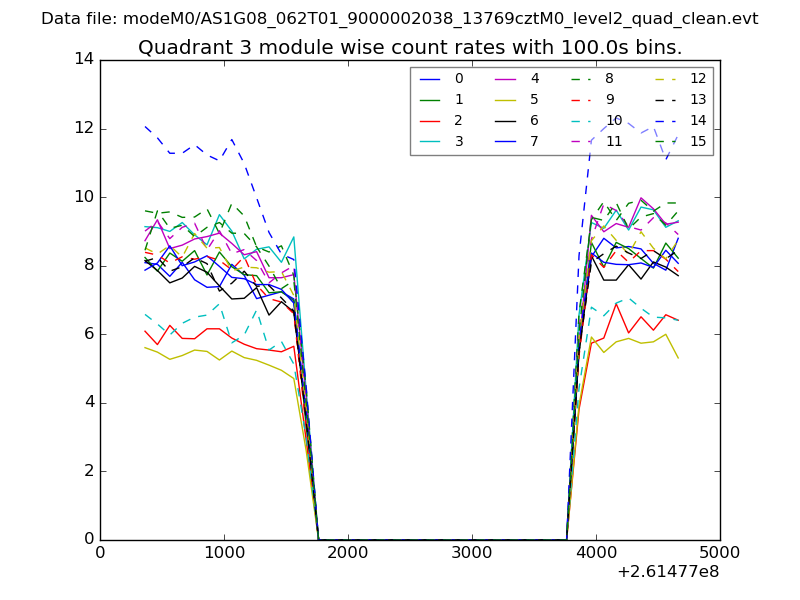
| Module-wise count rates for Quadrant A Data is divided into 100 sec bins |
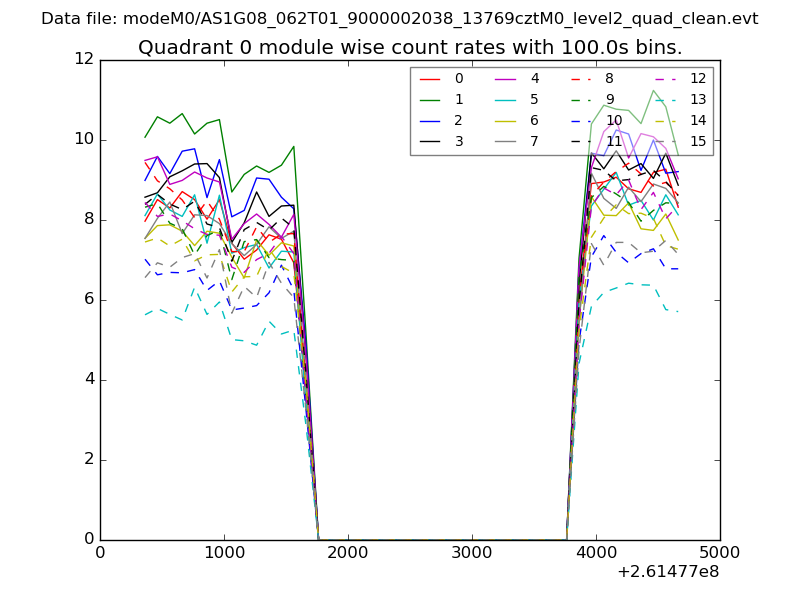 |
 |
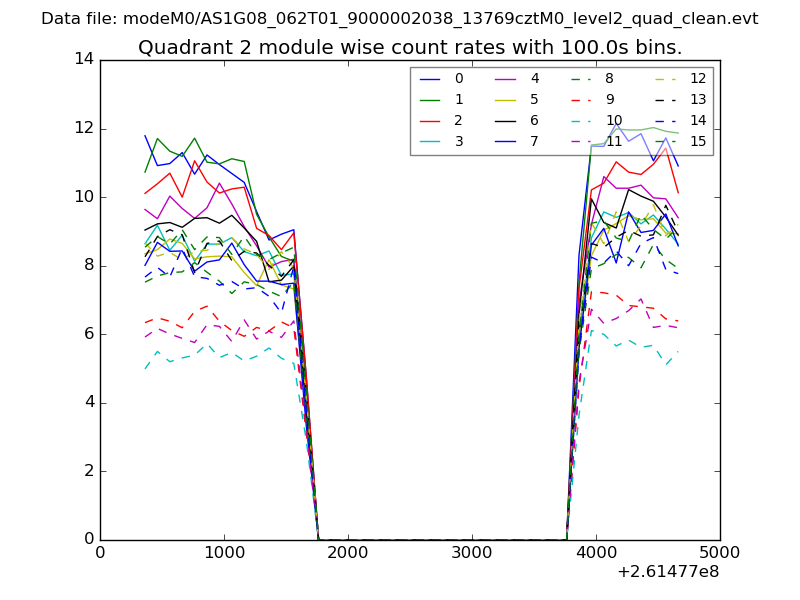
| Module-wise count rates for Quadrant B Data is divided into 100 sec bins |
 |
 |
| Module-wise count rates for Quadrant C Data is divided into 100 sec bins |
 |
 |
| Module-wise count rates for Quadrant D Data is divided into 100 sec bins |
 |
 |
| Parameter | Plot |
|---|---|
| CZT HV Monitor | 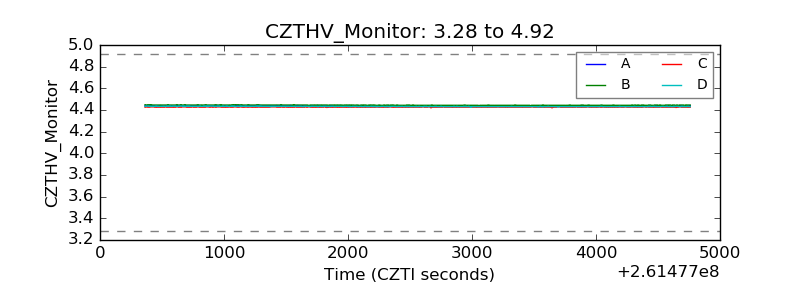 |
| D_VDD | 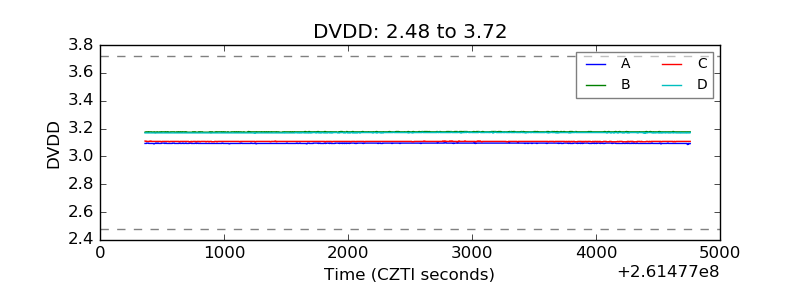 |
| Temperature 1 | 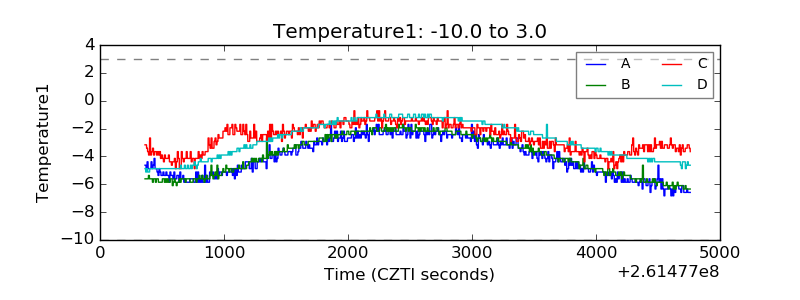 |
| Veto HV Monitor | 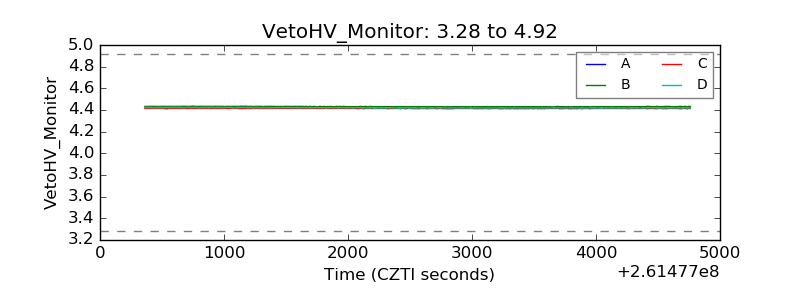 |
| Veto LLD | 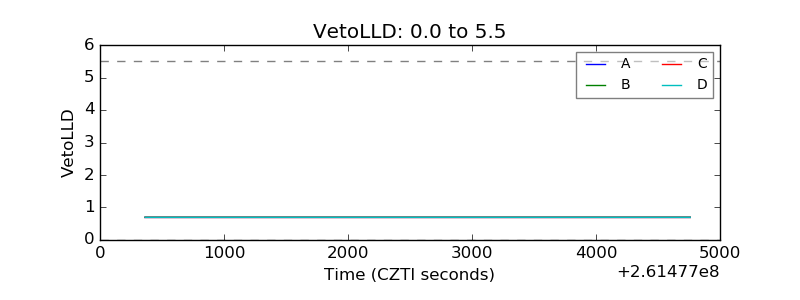 |
| Alpha Counter | 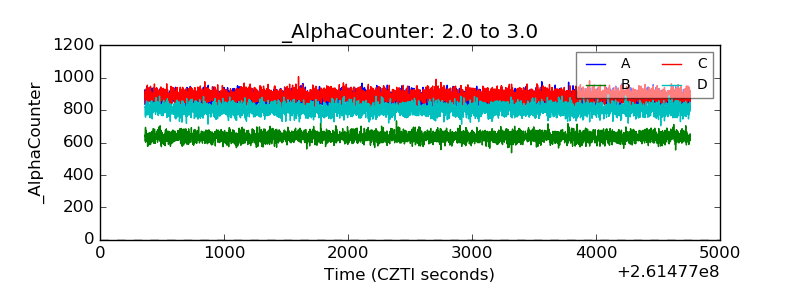 |
| _CPM_Rate | 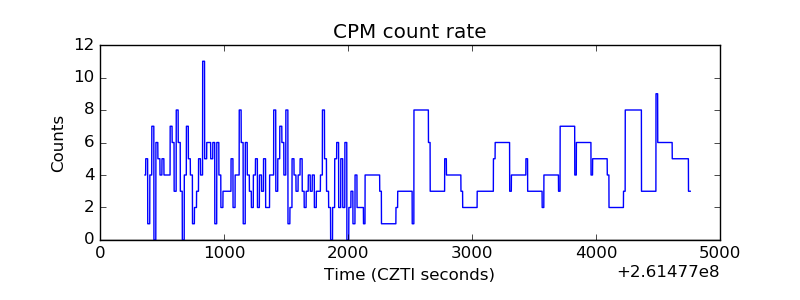 |
| CZT Counter | 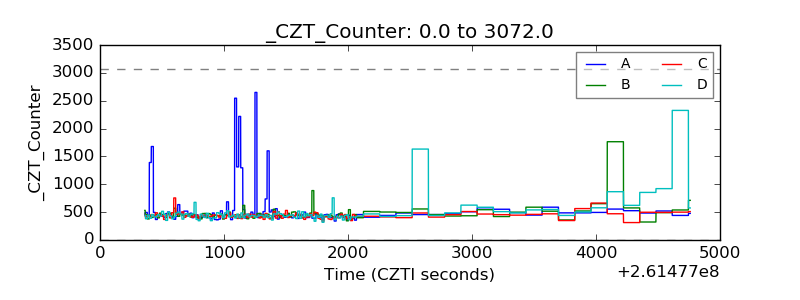 |
| +2.5 Volts monitor | 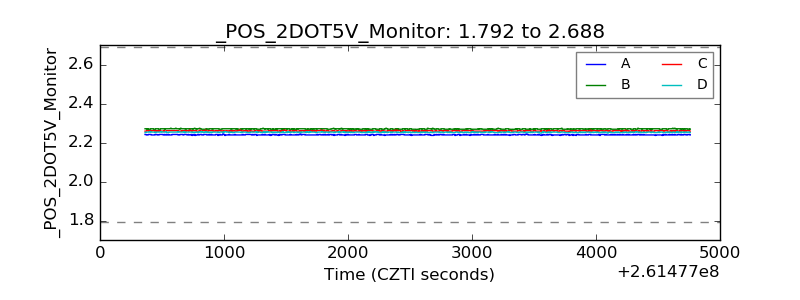 |
| +5 Volts monitor | 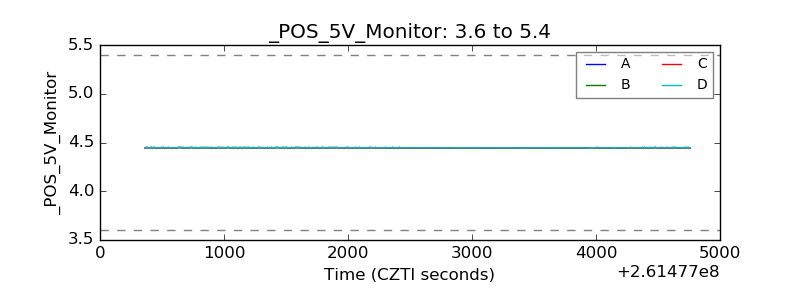 |
| _ROLL_ROT | 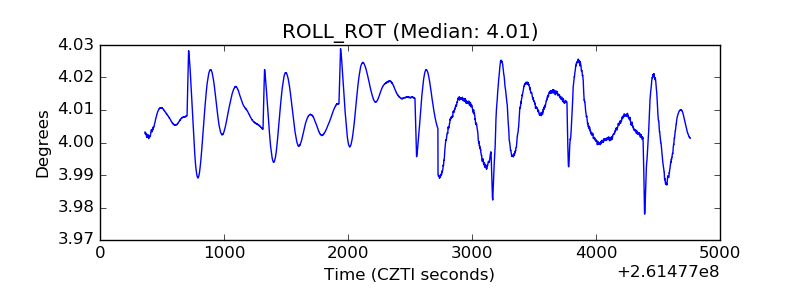 |
| _Roll_DEC | 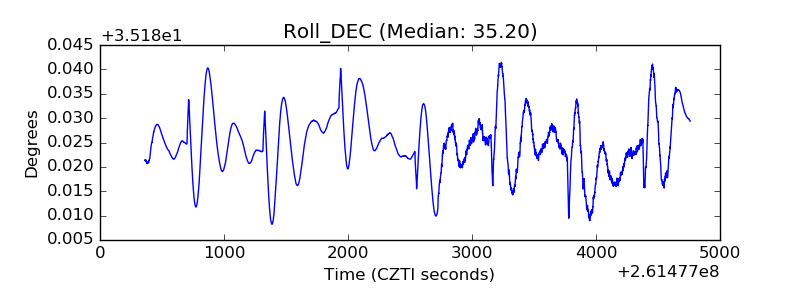 |
| _Roll_RA | 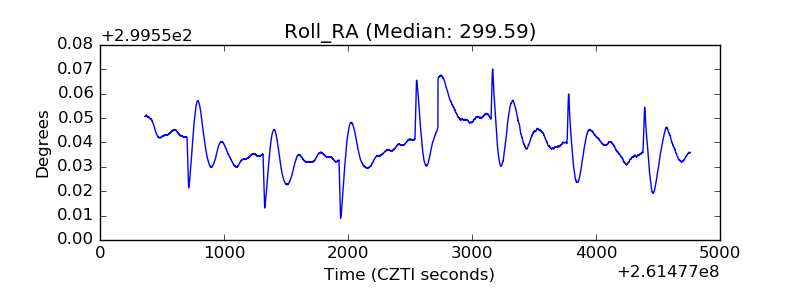 |
| Veto Counter | 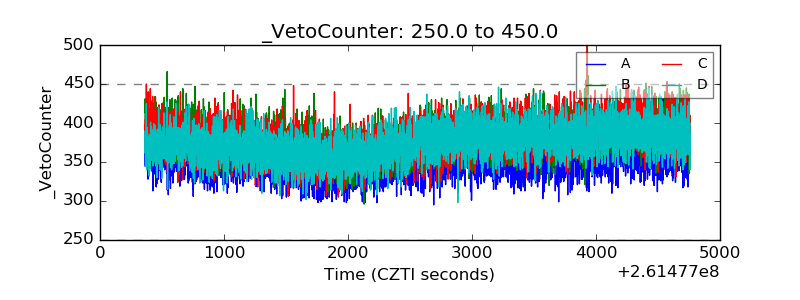 |