| Param | Original file | Final file |
|---|---|---|
| Filename | modeM0/AS1A04_199T01_9000002040_13769cztM0_level2.evt | modeM0/AS1A04_199T01_9000002040_13769cztM0_level2_quad_clean.evt |
| Size (bytes) | 134,942,400 | 15,975,360 |
| Size | 128.7 MB | 15.2 MB |
| Events in quadrant A | 937,918 | 88,502 |
| Events in quadrant B | 944,692 | 91,645 |
| Events in quadrant C | 939,100 | 89,714 |
| Events in quadrant D | 1,142,437 | 84,185 |
| Mode SS | |||
|---|---|---|---|
| Quadrant | BADHDUFLAG | Total packets | Discarded packets |
| A | 0 | 36 | 0 |
| B | 0 | 36 | 0 |
| C | 0 | 36 | 0 |
| D | 0 | 36 | 0 |
| Mode M0 | |||
|---|---|---|---|
| Quadrant | BADHDUFLAG | Total packets | Discarded packets |
| A | 0 | 3883 | 2 |
| B | 0 | 3885 | 1 |
| C | 0 | 3848 | 1 |
| D | 0 | 4503 | 1 |
| Quadrant | Total seconds | Saturated seconds | Saturation percentage |
|---|---|---|---|
| A | 1757 | 194 | 11.041548% |
| B | 1757 | 197 | 11.212294% |
| C | 1757 | 164 | 9.334092% |
| D | 1757 | 199 | 11.326124% |
Noise dominated data is calculated using 1-second bins in cleaned event files. If a bin has >2000 counts, and if more than 50% of those come from <1% of pixels, then it is considered to be noise-dominated and hence unusable.
| Quadrant | # 1 sec bins | Bins with >0 counts | Bins with >2000 counts | High rate bins dominated by noise | Noise dominated (total time) | Noise dominated (detector-on time) | Marked lightcurve |
|---|---|---|---|---|---|---|---|
| A | 1803 | 1759 | 0 | 0 | 0.00% | 0.00% | 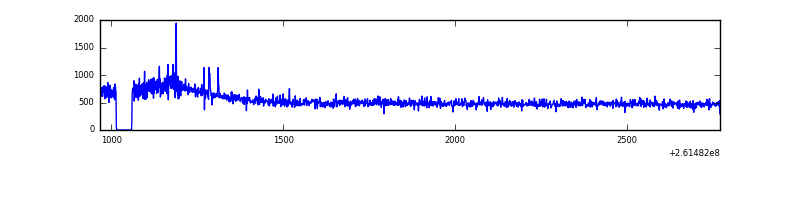 |
| B | 1803 | 1759 | 0 | 0 | 0.00% | 0.00% | 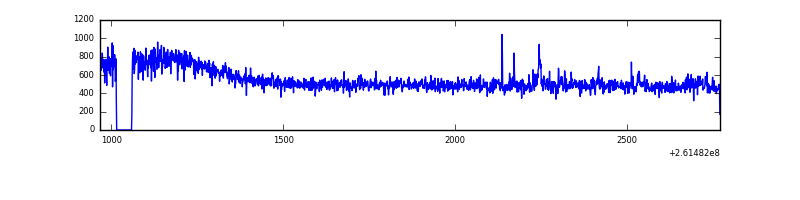 |
| C | 1803 | 1759 | 0 | 0 | 0.00% | 0.00% | 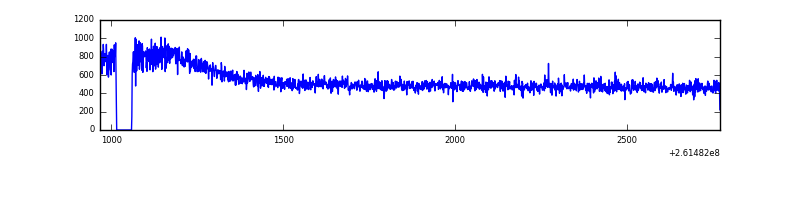 |
| D | 1803 | 1759 | 10 | 10 | 0.55% | 0.57% | 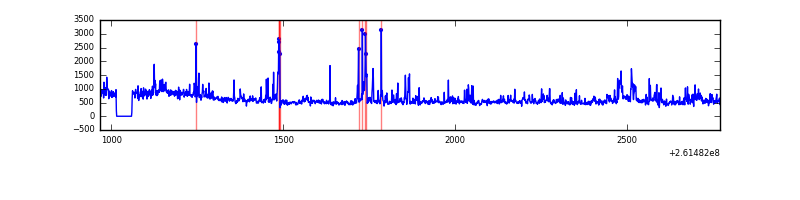 |
Top three noisy pixels from each quadrant. If the there are fewer than three noisy pixels in the level2.evt file, extra rows are filled as -1
| Pixel properties | Quadrant properties | ||||||
|---|---|---|---|---|---|---|---|
| Quadrant | DetID | PixID | Counts | Sigma | Mean | Median | Sigma |
| A | 9 | 143 | 12170 | 230.11 | 238 | 232 | 51.9 |
| A | 1 | 162 | 2900 | 51.43 | 238 | 232 | 51.9 |
| A | 0 | 226 | 2277 | 39.42 | 238 | 232 | 51.9 |
| B | 8 | 250 | 6354 | 124.23 | 238 | 230 | 49.3 |
| B | 12 | 111 | 5742 | 111.81 | 238 | 230 | 49.3 |
| B | 3 | 209 | 5643 | 109.81 | 238 | 230 | 49.3 |
| C | 3 | 233 | 22968 | 404.56 | 232 | 231 | 56.2 |
| C | 8 | 128 | 3513 | 58.4 | 232 | 231 | 56.2 |
| C | 12 | 4 | 2024 | 31.9 | 232 | 231 | 56.2 |
| D | 1 | 52 | 157737 | 2685.95 | 233 | 225 | 58.6 |
| D | 13 | 249 | 77473 | 1317.26 | 233 | 225 | 58.6 |
| D | 8 | 195 | 16549 | 278.36 | 233 | 225 | 58.6 |
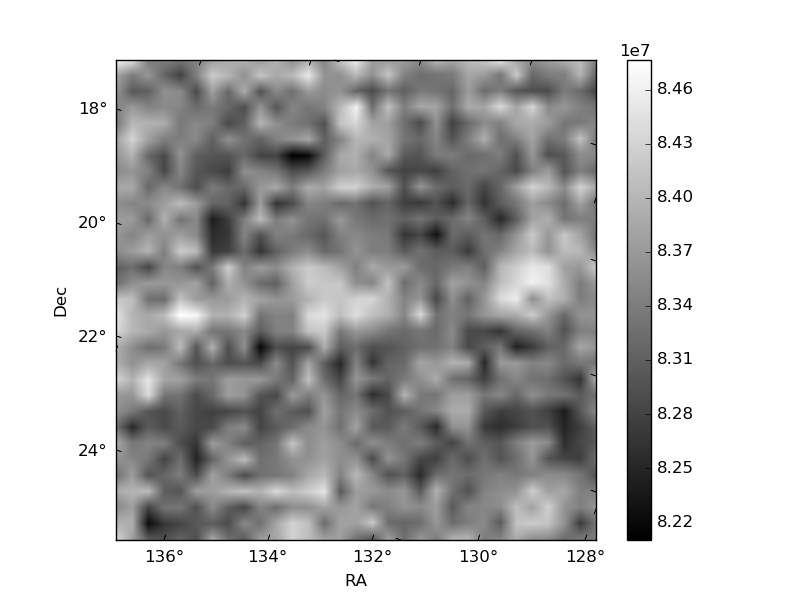
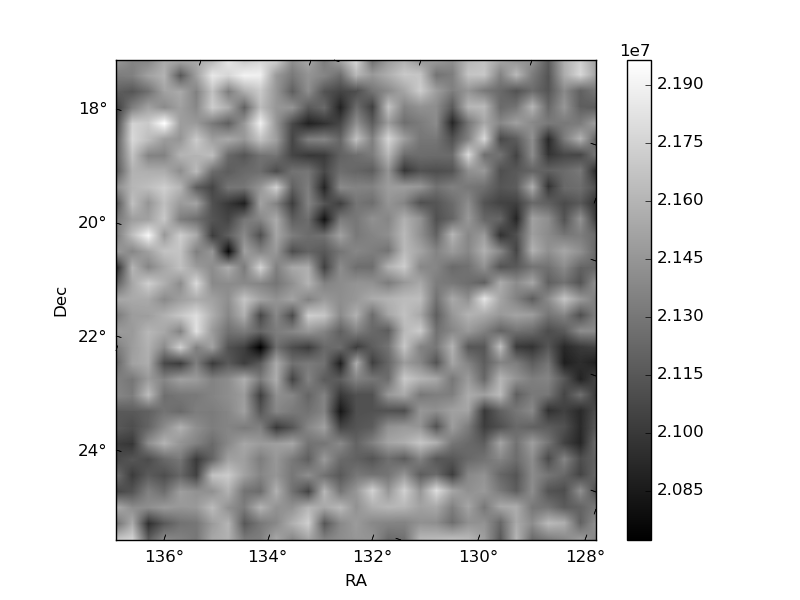
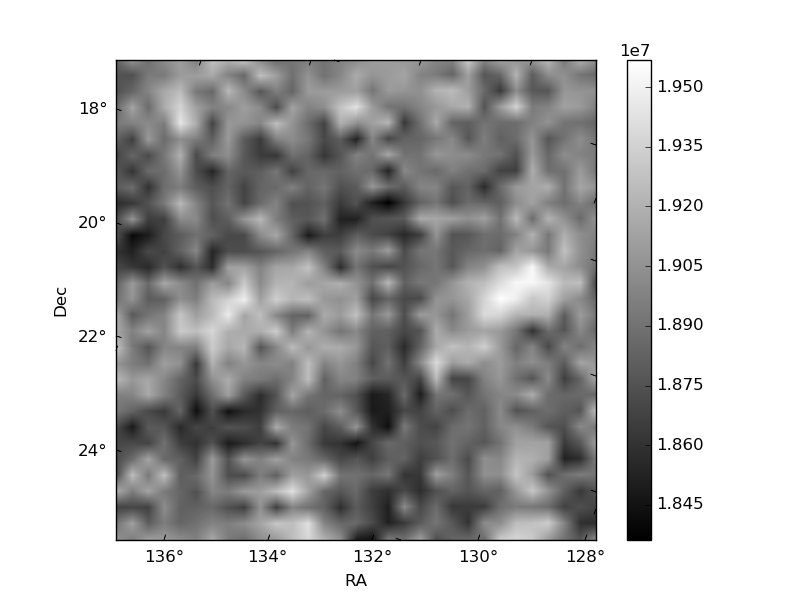
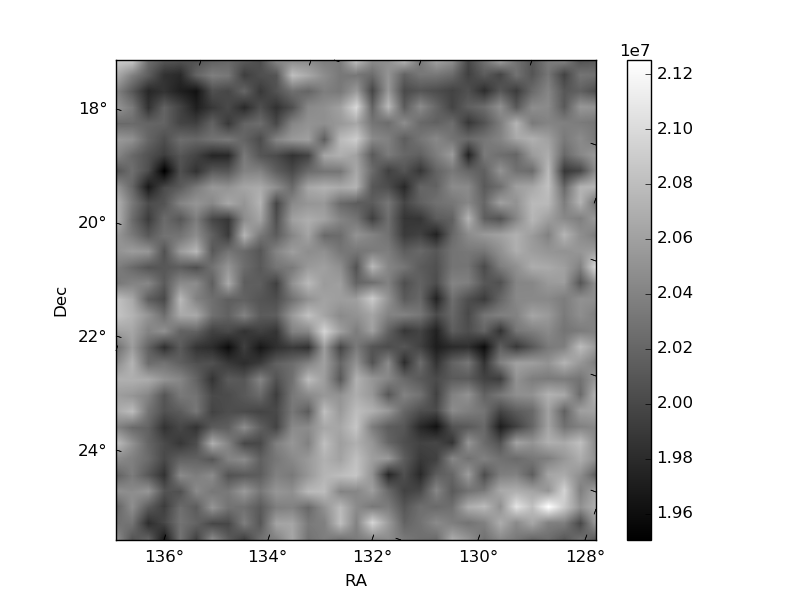
Histogram calculated using DETX and DETY for each event in the final _common_clean file
| Quadrant A | 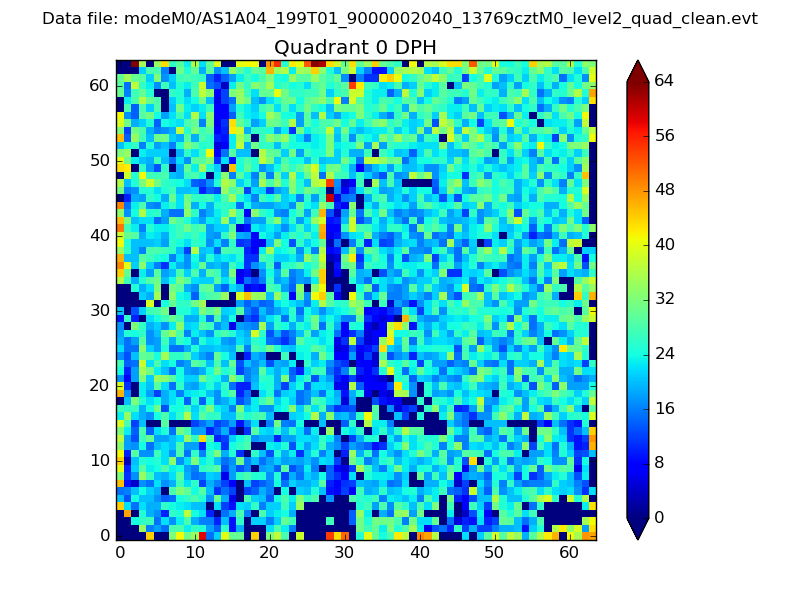 |
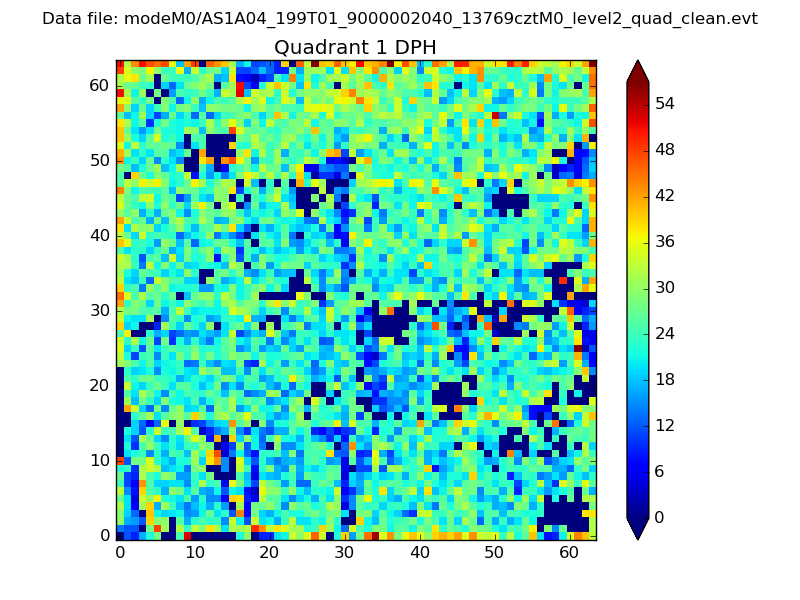 |
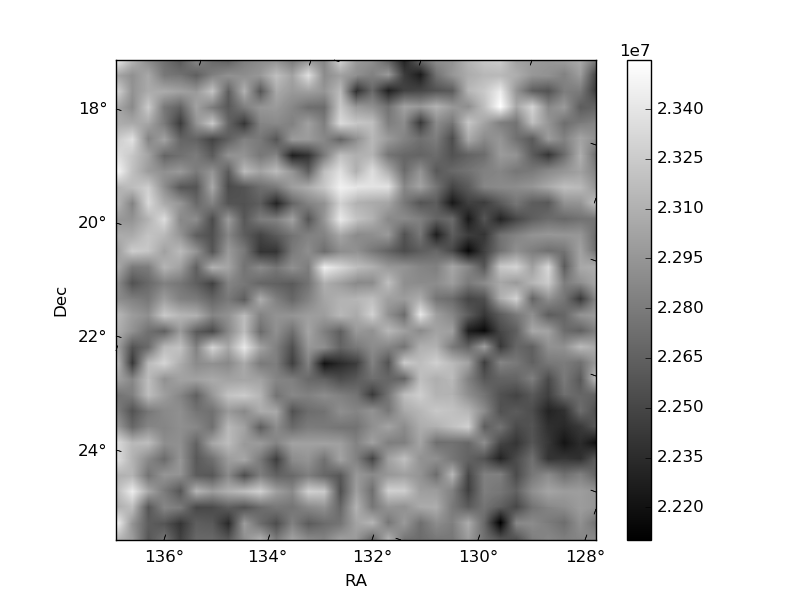
Quadrant B |
|---|---|---|---|
| Quadrant D | 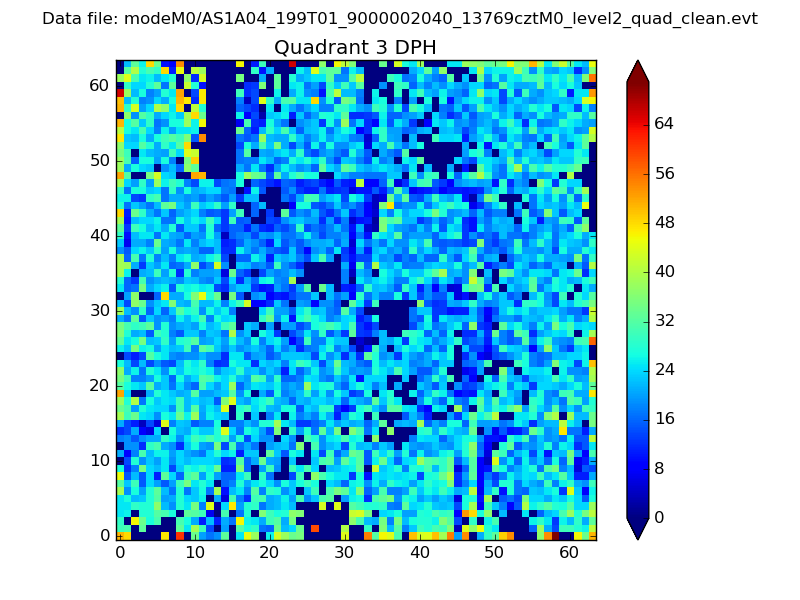 |
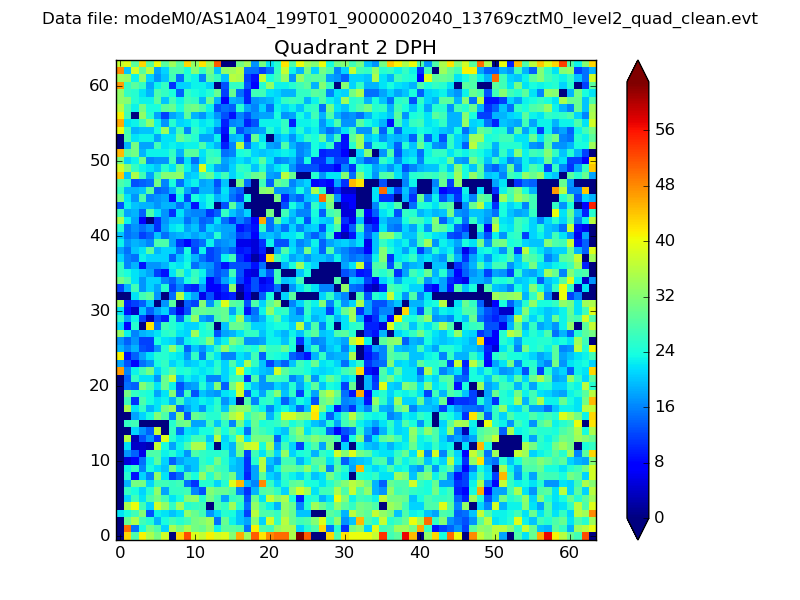 |
Quadrant C |
| Plot type | Count rate plots | Images |
|---|---|---|
| Comparison with Poisson distribution Blue bars denote a histogram of data divided into 1 sec bins. Red curve is a Poisson curve with rate = median count rate of data. |
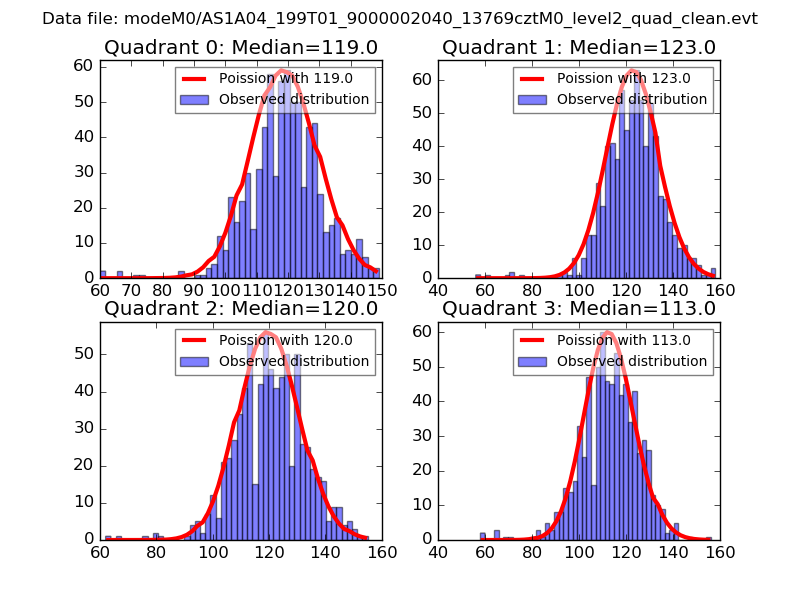 |
 |
| Quadrant-wise count rates Data is divided into 100 sec bins |
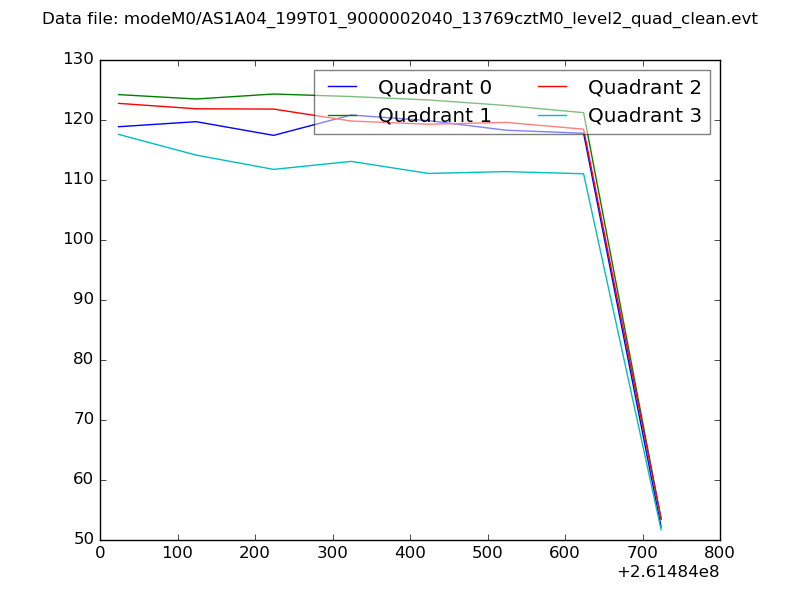 |
|
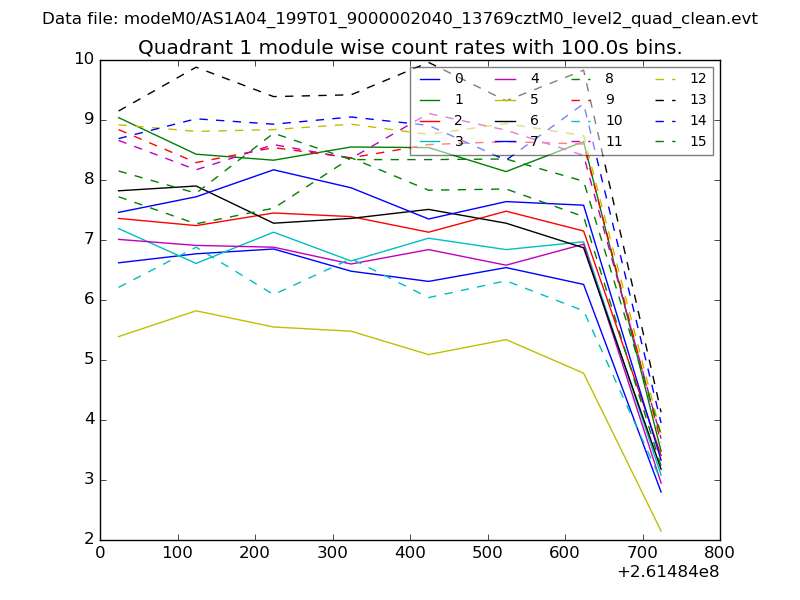
| Module-wise count rates for Quadrant A Data is divided into 100 sec bins |
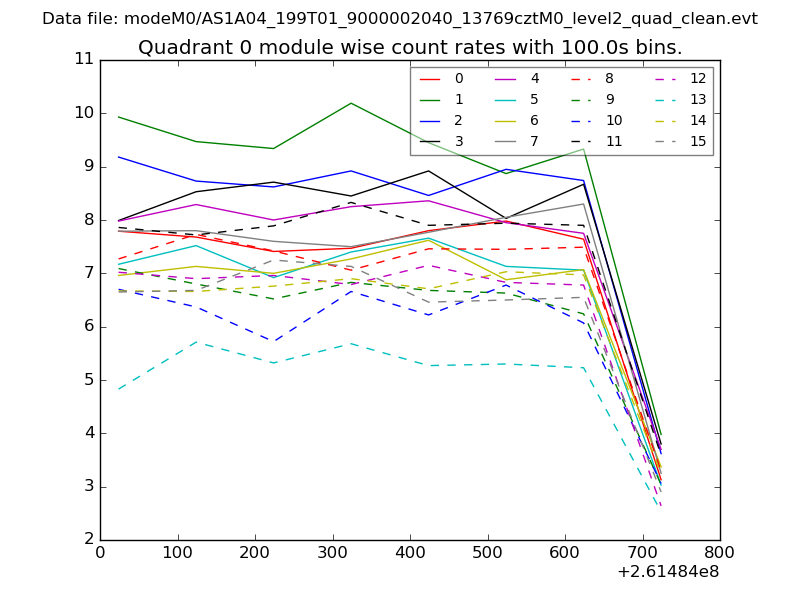 |
 |
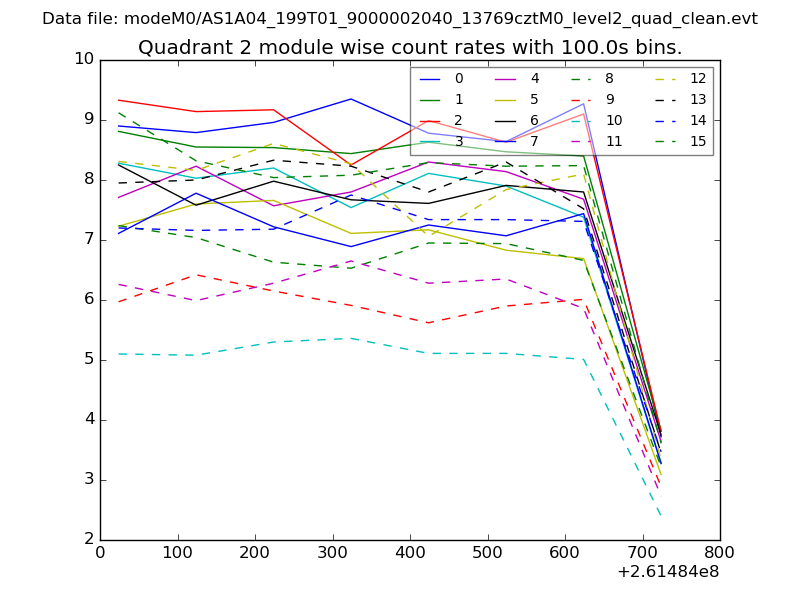
| Module-wise count rates for Quadrant B Data is divided into 100 sec bins |
 |
 |
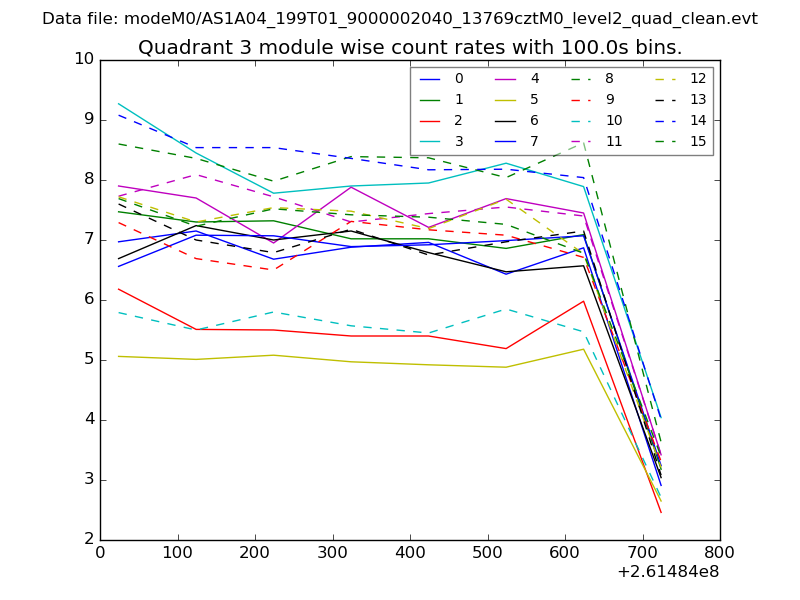
| Module-wise count rates for Quadrant C Data is divided into 100 sec bins |
 |
 |
| Module-wise count rates for Quadrant D Data is divided into 100 sec bins |
 |
 |
| Parameter | Plot |
|---|---|
| CZT HV Monitor | 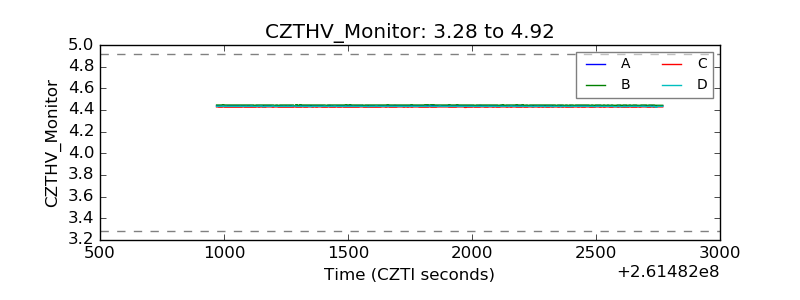 |
| D_VDD | 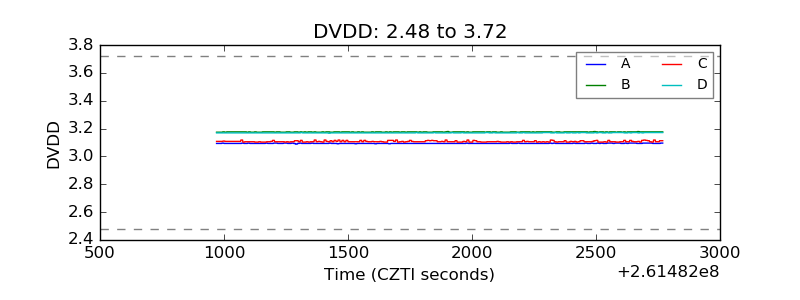 |
| Temperature 1 | 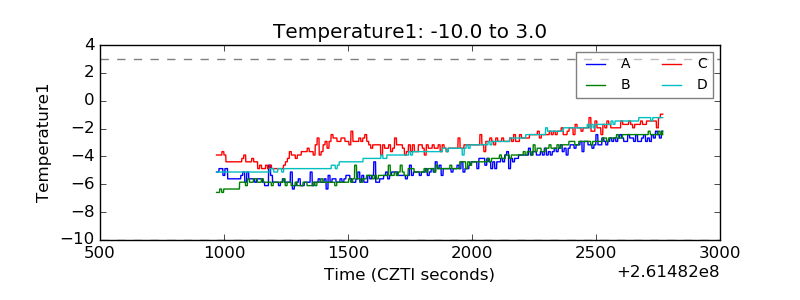 |
| Veto HV Monitor | 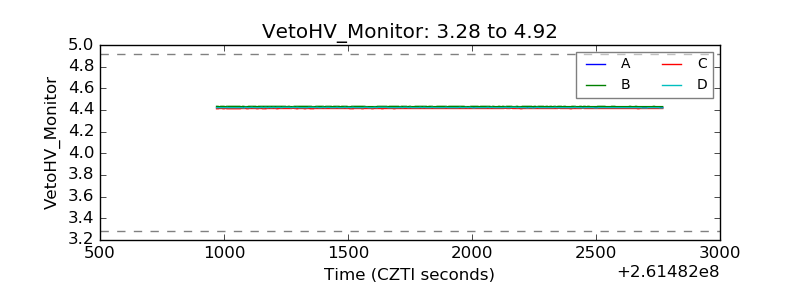 |
| Veto LLD | 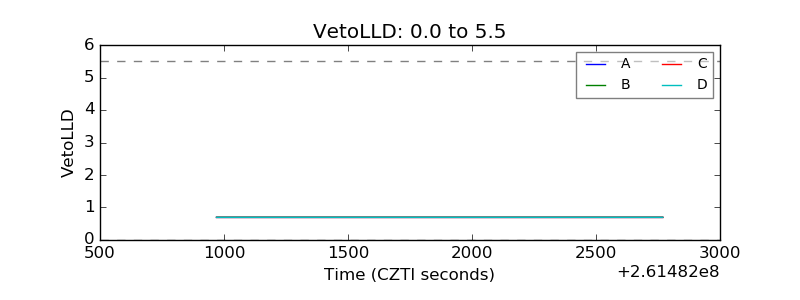 |
| Alpha Counter | 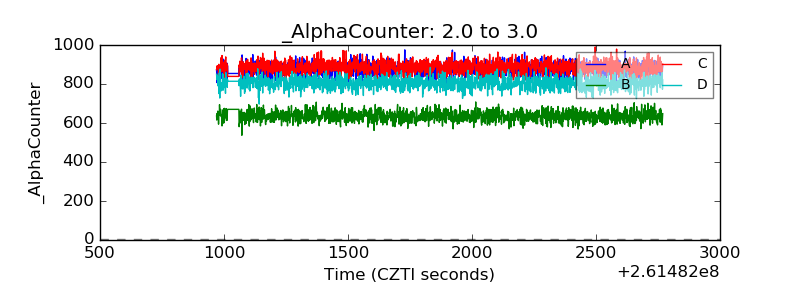 |
| _CPM_Rate | 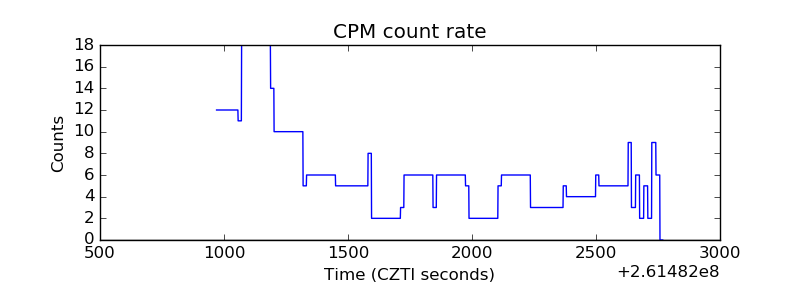 |
| CZT Counter | 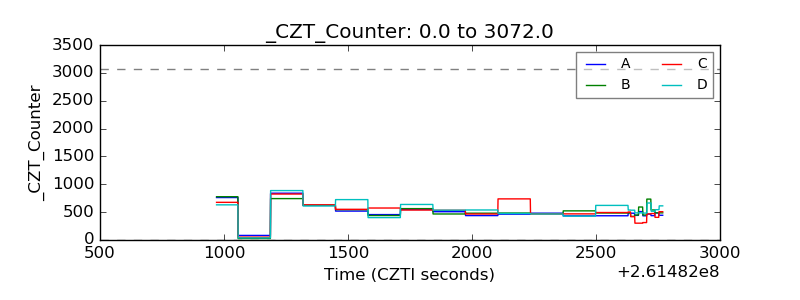 |
| +2.5 Volts monitor |  |
| +5 Volts monitor |  |
| _ROLL_ROT | 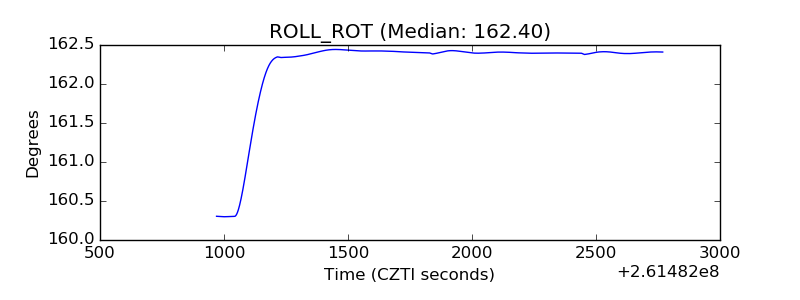 |
| _Roll_DEC | 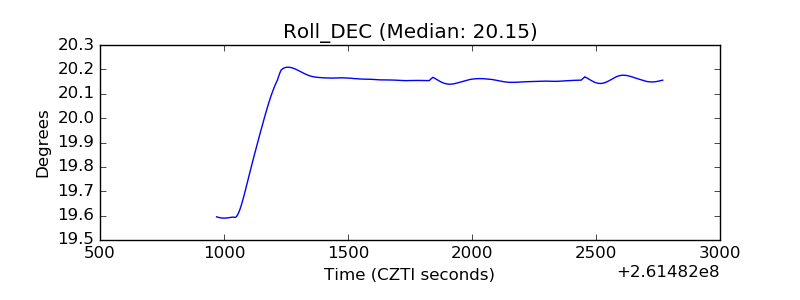 |
| _Roll_RA | 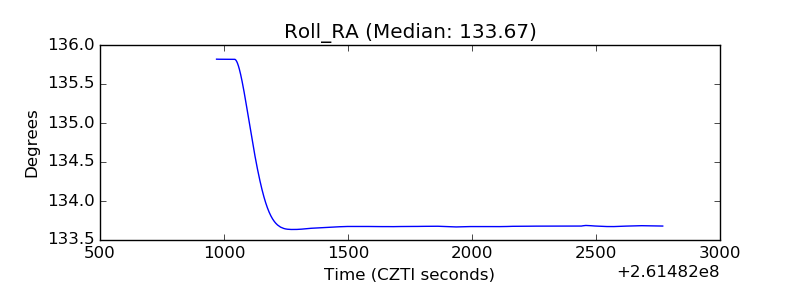 |
| Veto Counter | 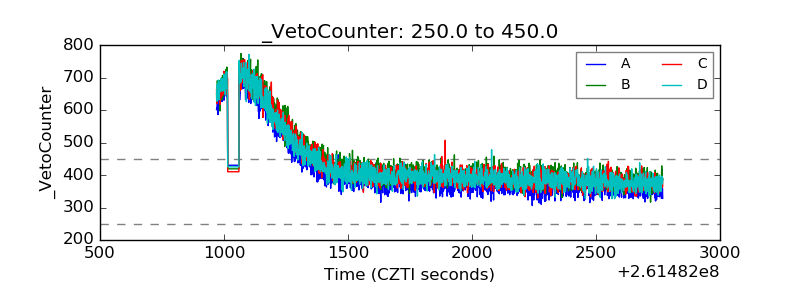 |