| Param | Original file | Final file |
|---|---|---|
| Filename | modeM0/AS1A04_199T01_9000002040_13773cztM0_level2.evt | modeM0/AS1A04_199T01_9000002040_13773cztM0_level2_quad_clean.evt |
| Size (bytes) | 1,555,750,080 | 215,478,720 |
| Size | 1.4 GB | 205.5 MB |
| Events in quadrant A | 8,759,252 | 1,363,602 |
| Events in quadrant B | 8,777,006 | 1,381,754 |
| Events in quadrant C | 9,051,953 | 1,372,609 |
| Events in quadrant D | 19,323,952 | 1,177,170 |
| Mode M9 | |||
|---|---|---|---|
| Quadrant | BADHDUFLAG | Total packets | Discarded packets |
| A | 0 | 17 | 0 |
| B | 0 | 17 | 0 |
| C | 0 | 17 | 0 |
| D | 0 | 17 | 0 |
| Mode SS | |||
|---|---|---|---|
| Quadrant | BADHDUFLAG | Total packets | Discarded packets |
| A | 0 | 364 | 0 |
| B | 0 | 364 | 0 |
| C | 0 | 364 | 0 |
| D | 0 | 364 | 0 |
| Mode M0 | |||
|---|---|---|---|
| Quadrant | BADHDUFLAG | Total packets | Discarded packets |
| A | 0 | 38078 | 4 |
| B | 0 | 37658 | 3 |
| C | 0 | 38708 | 3 |
| D | 0 | 69662 | 3 |
| Quadrant | Total seconds | Saturated seconds | Saturation percentage |
|---|---|---|---|
| A | 17844 | 341 | 1.911007% |
| B | 17844 | 253 | 1.417844% |
| C | 17844 | 125 | 0.700516% |
| D | 17844 | 3217 | 18.028469% |
Noise dominated data is calculated using 1-second bins in cleaned event files. If a bin has >2000 counts, and if more than 50% of those come from <1% of pixels, then it is considered to be noise-dominated and hence unusable.
| Quadrant | # 1 sec bins | Bins with >0 counts | Bins with >2000 counts | High rate bins dominated by noise | Noise dominated (total time) | Noise dominated (detector-on time) | Marked lightcurve |
|---|---|---|---|---|---|---|---|
| A | 19555 | 17847 | 124 | 124 | 0.63% | 0.69% | 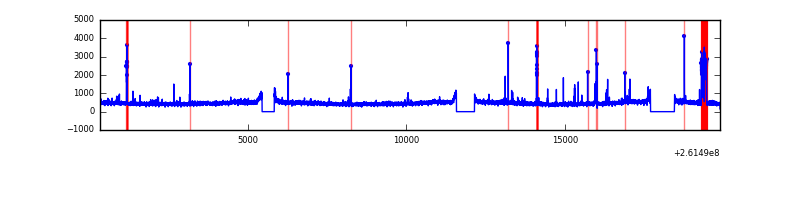 |
| B | 19555 | 17847 | 31 | 31 | 0.16% | 0.17% | 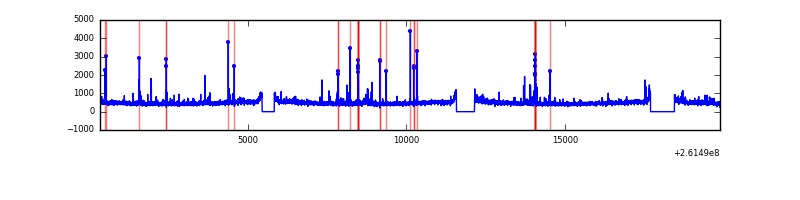 |
| C | 19555 | 17848 | 8 | 8 | 0.04% | 0.04% | 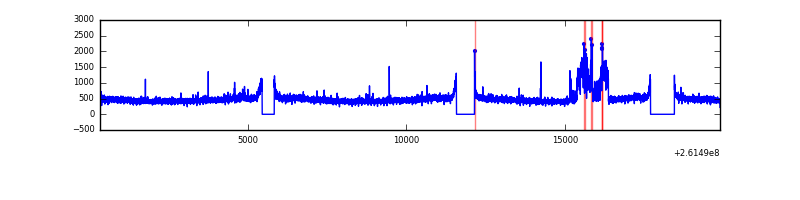 |
| D | 19555 | 17846 | 2451 | 2451 | 12.53% | 13.73% | 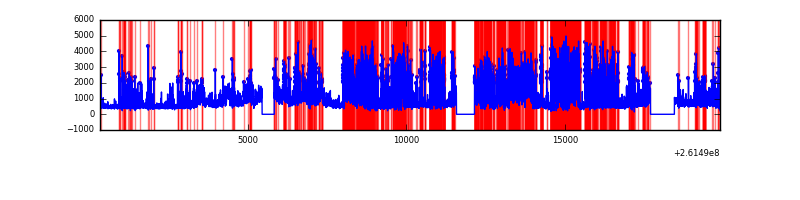 |
Top three noisy pixels from each quadrant. If the there are fewer than three noisy pixels in the level2.evt file, extra rows are filled as -1
| Pixel properties | Quadrant properties | ||||||
|---|---|---|---|---|---|---|---|
| Quadrant | DetID | PixID | Counts | Sigma | Mean | Median | Sigma |
| A | 9 | 143 | 480073 | 1110.5 | 2106 | 2058 | 430.4 |
| A | 15 | 69 | 63019 | 141.62 | 2106 | 2058 | 430.4 |
| A | 1 | 162 | 46398 | 103.01 | 2106 | 2058 | 430.4 |
| B | 3 | 64 | 160568 | 390.64 | 2113 | 2060 | 405.8 |
| B | 0 | 219 | 108096 | 261.33 | 2113 | 2060 | 405.8 |
| B | 4 | 173 | 71327 | 170.71 | 2113 | 2060 | 405.8 |
| C | 14 | 220 | 773740 | 1616.34 | 2062 | 2069 | 477.4 |
| C | 3 | 233 | 233593 | 484.95 | 2062 | 2069 | 477.4 |
| C | 13 | 61 | 14682 | 26.42 | 2062 | 2069 | 477.4 |
| D | 1 | 52 | 8172850 | 18044.47 | 1873 | 1821 | 452.8 |
| D | 5 | 222 | 3091367 | 6822.79 | 1873 | 1821 | 452.8 |
| D | 10 | 157 | 550996 | 1212.77 | 1873 | 1821 | 452.8 |
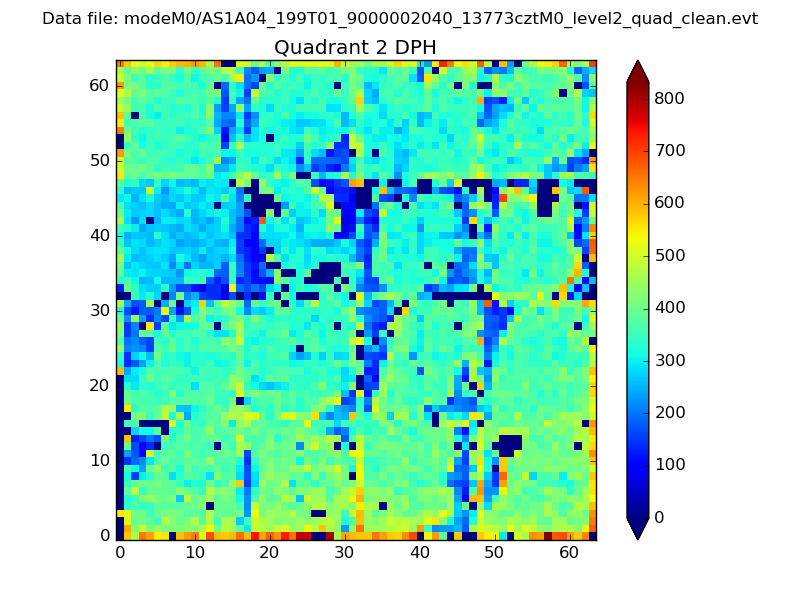
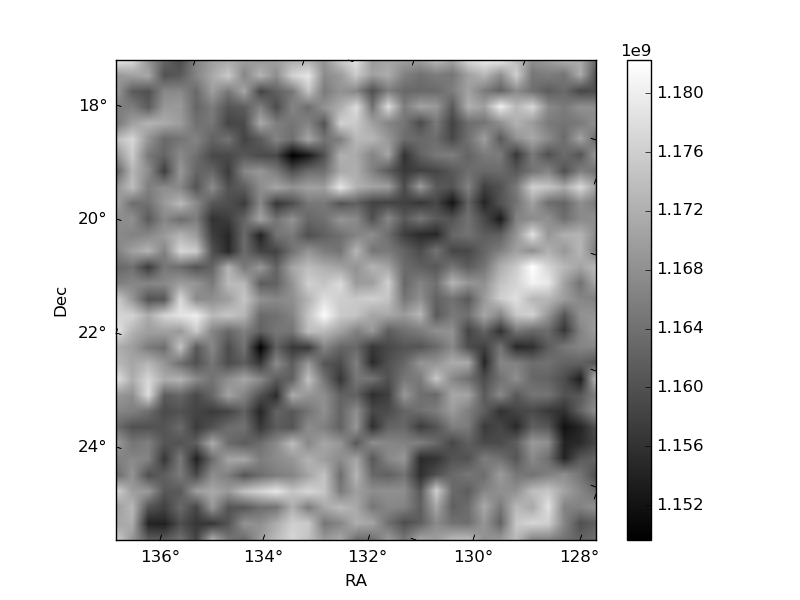
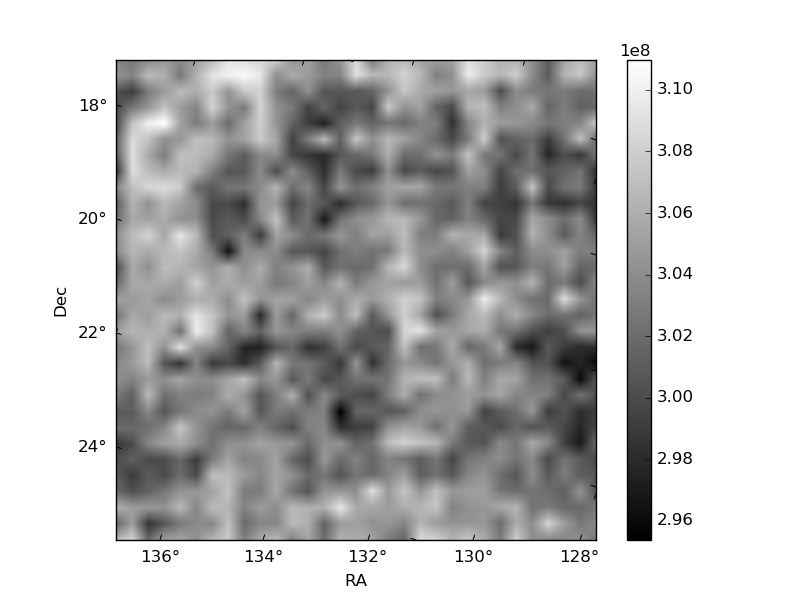
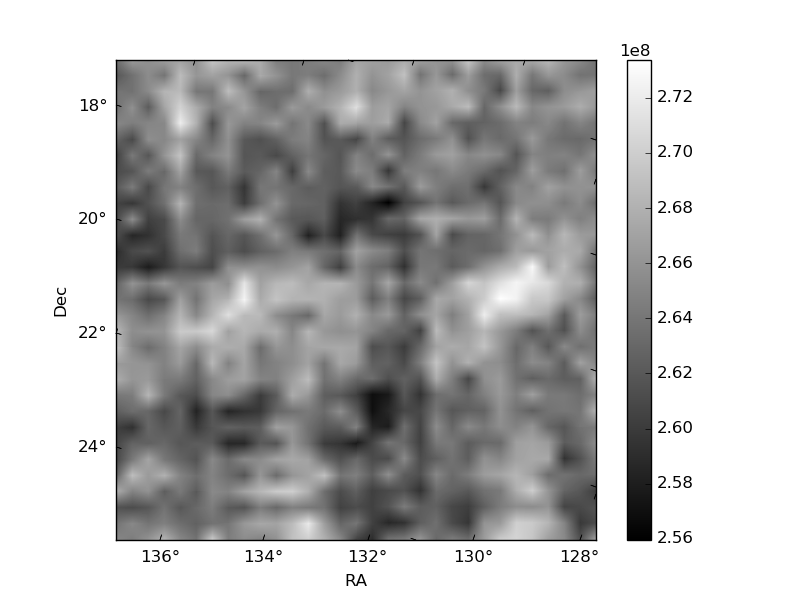
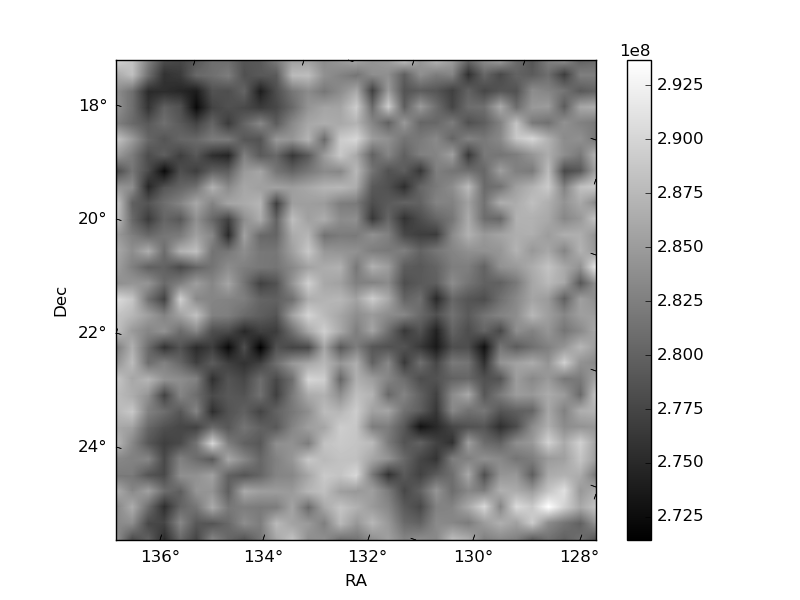
Histogram calculated using DETX and DETY for each event in the final _common_clean file
| Quadrant A | 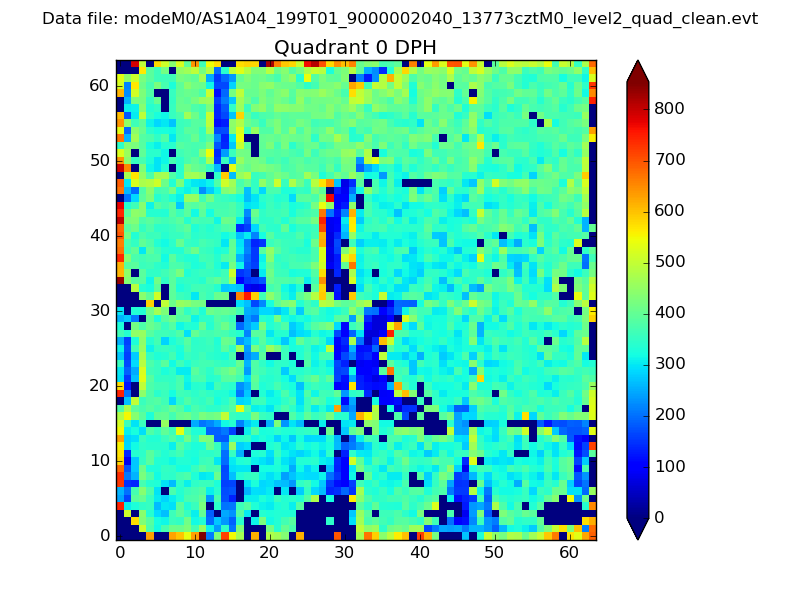 |
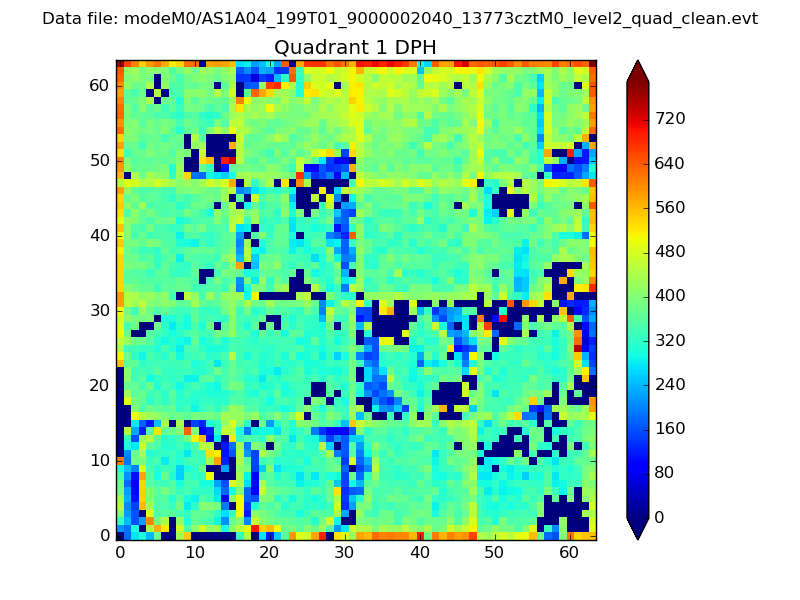 |
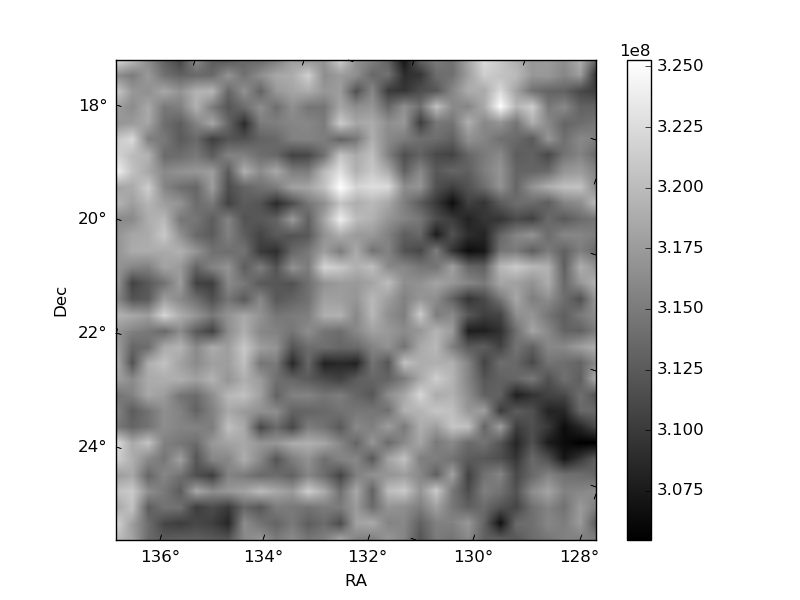
Quadrant B |
|---|---|---|---|
| Quadrant D | 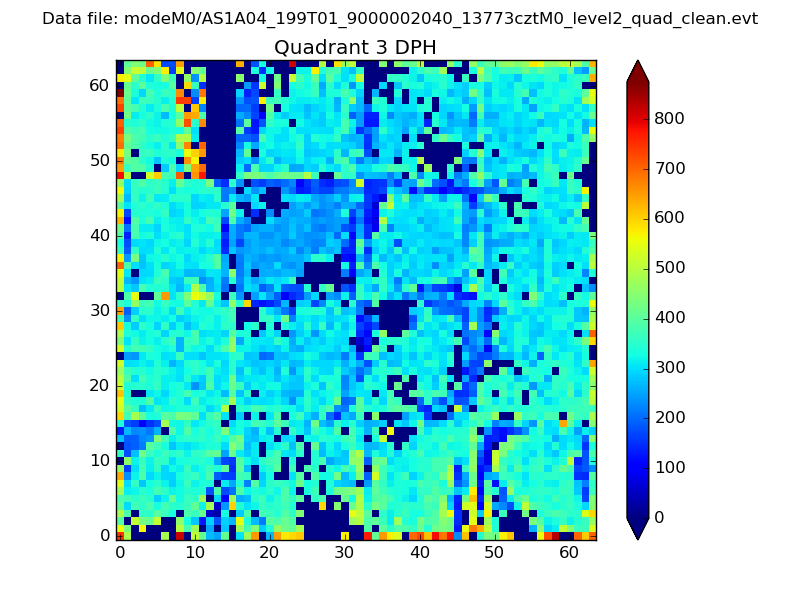 |
 |
Quadrant C |
| Plot type | Count rate plots | Images |
|---|---|---|
| Comparison with Poisson distribution Blue bars denote a histogram of data divided into 1 sec bins. Red curve is a Poisson curve with rate = median count rate of data. |
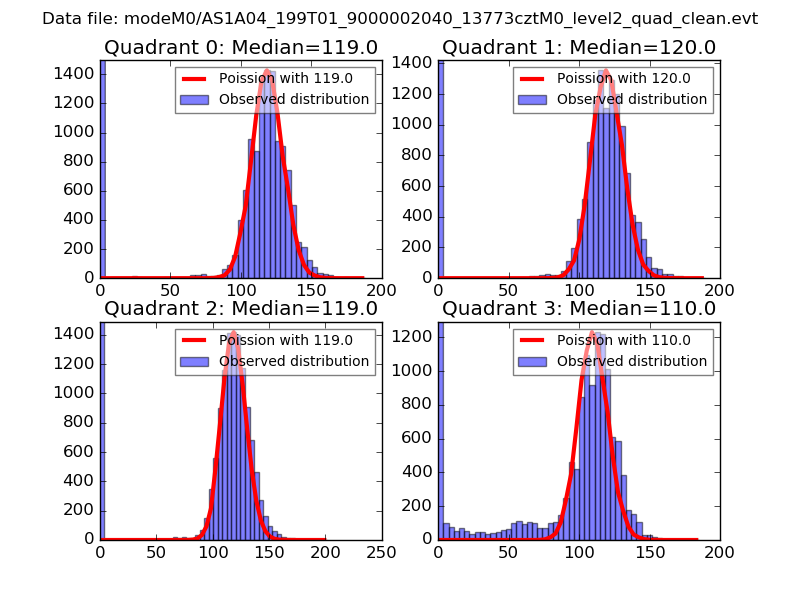 |
 |
| Quadrant-wise count rates Data is divided into 100 sec bins |
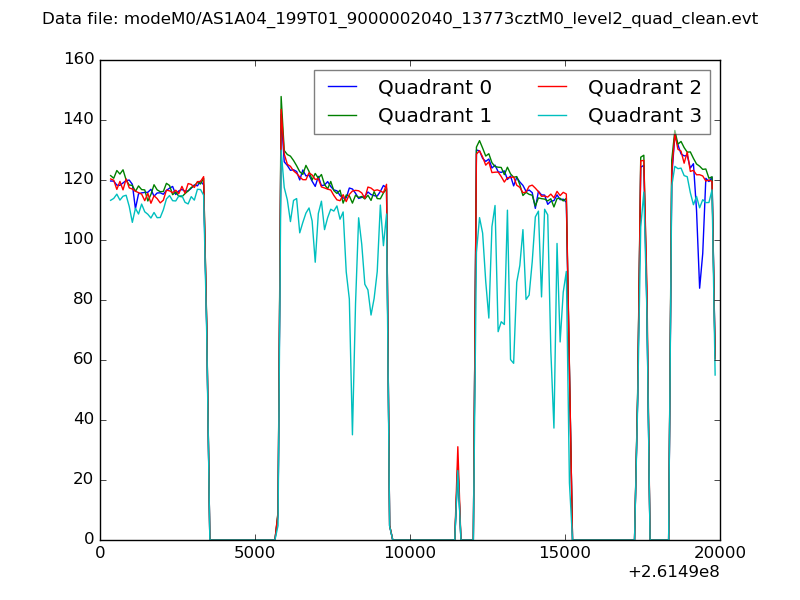 |
|
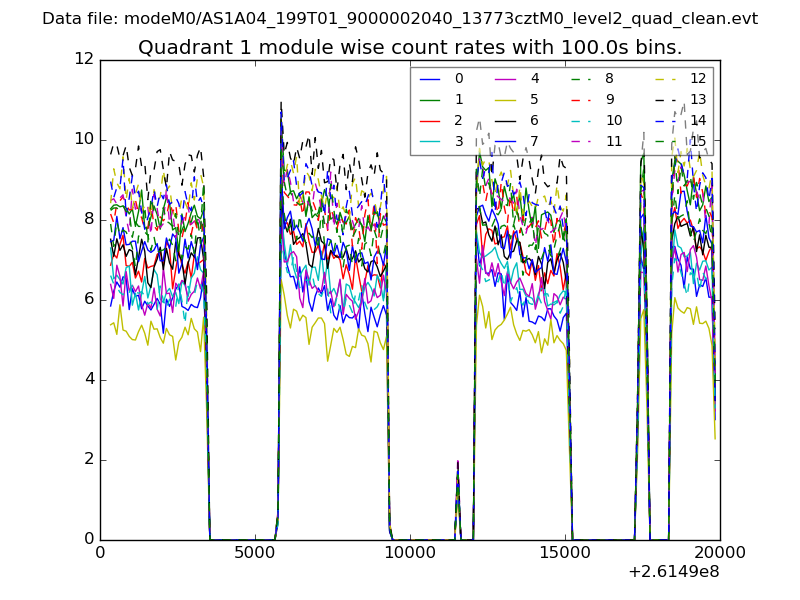
| Module-wise count rates for Quadrant A Data is divided into 100 sec bins |
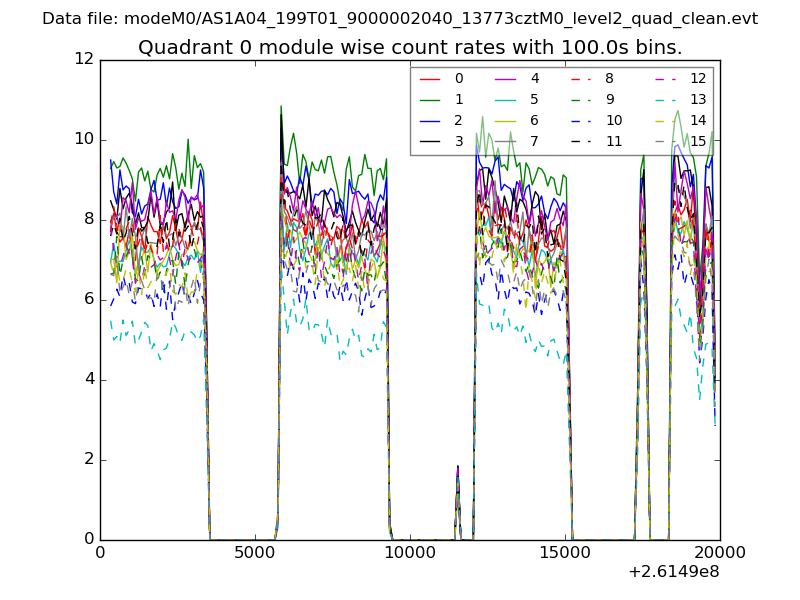 |
 |
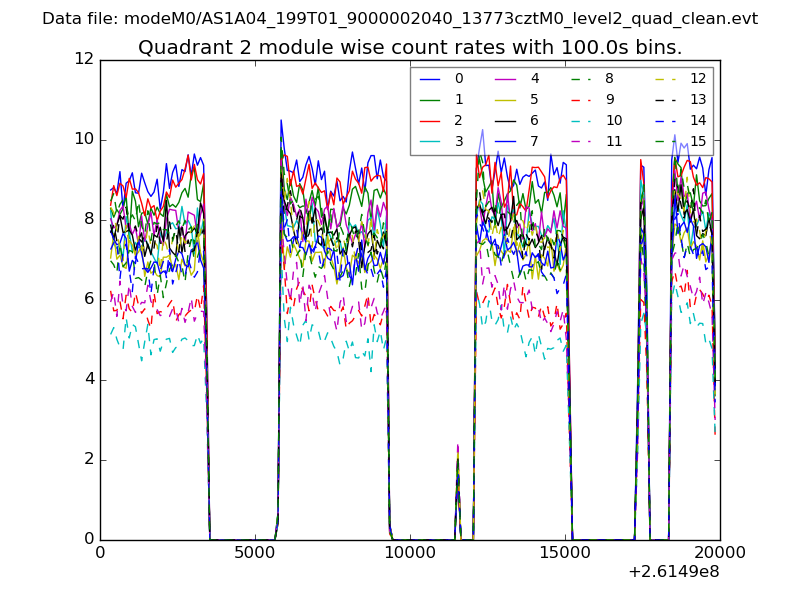
| Module-wise count rates for Quadrant B Data is divided into 100 sec bins |
 |
 |
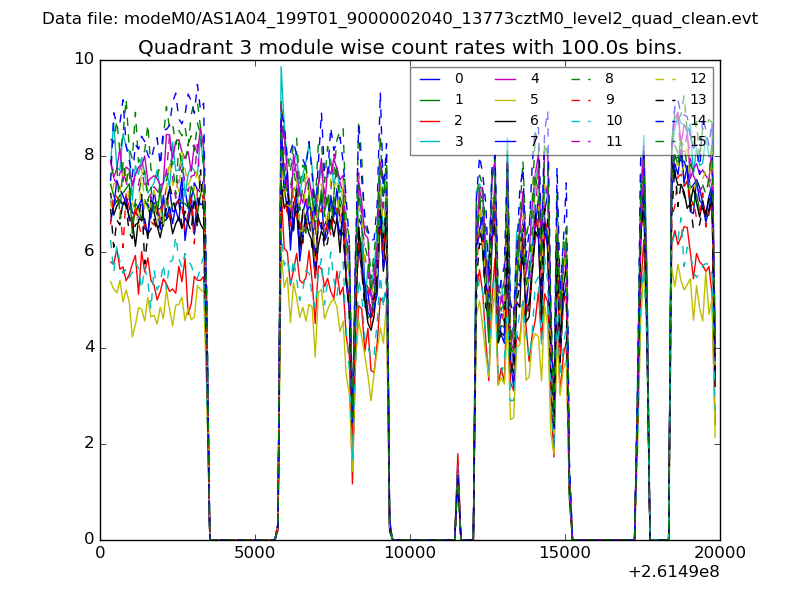
| Module-wise count rates for Quadrant C Data is divided into 100 sec bins |
 |
 |
| Module-wise count rates for Quadrant D Data is divided into 100 sec bins |
 |
 |
| Parameter | Plot |
|---|---|
| CZT HV Monitor | 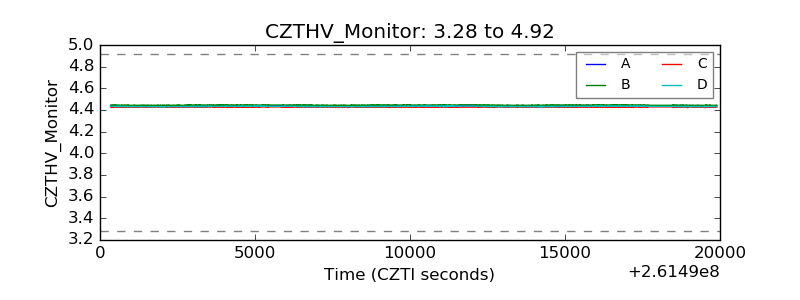 |
| D_VDD | 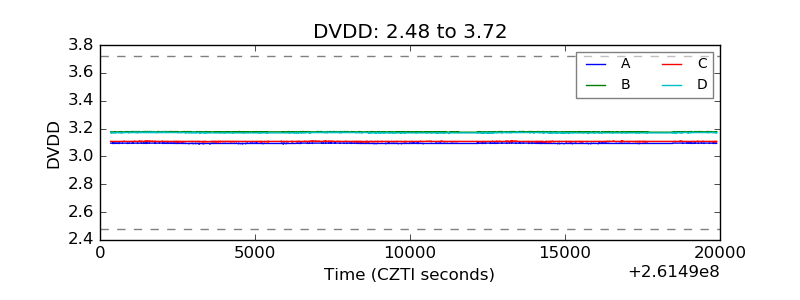 |
| Temperature 1 |  |
| Veto HV Monitor |  |
| Veto LLD | 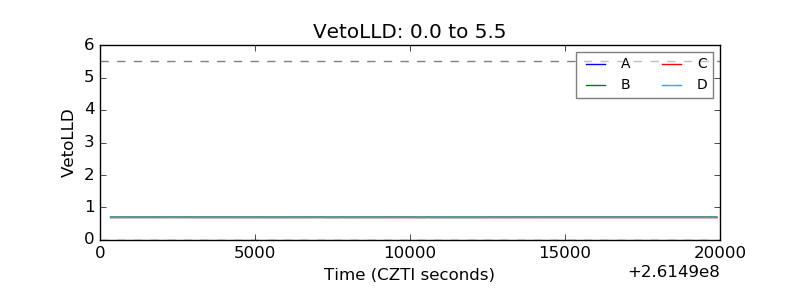 |
| Alpha Counter | 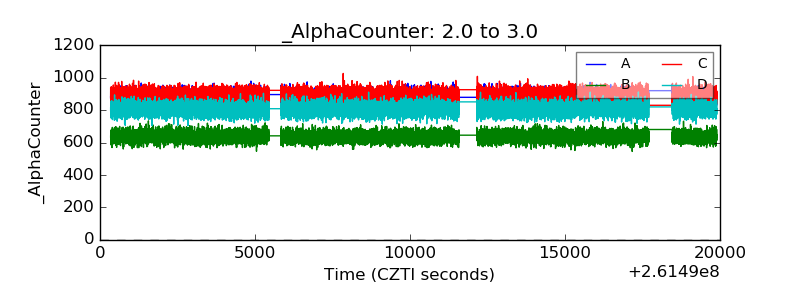 |
| _CPM_Rate | 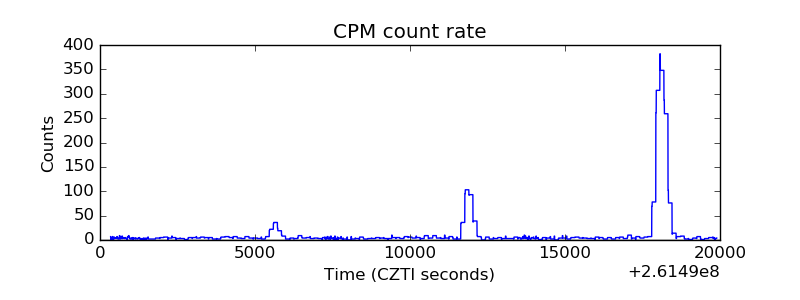 |
| CZT Counter | 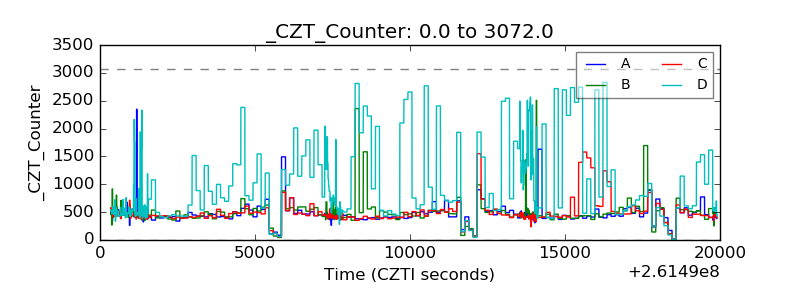 |
| +2.5 Volts monitor |  |
| +5 Volts monitor |  |
| _ROLL_ROT | 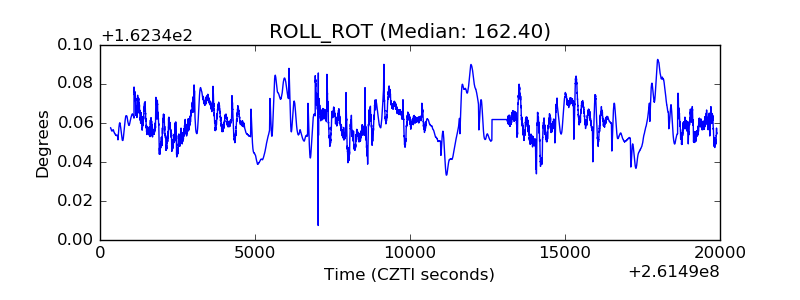 |
| _Roll_DEC |  |
| _Roll_RA | 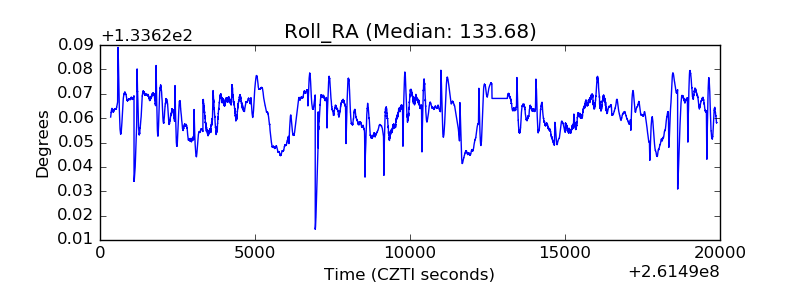 |
| Veto Counter | 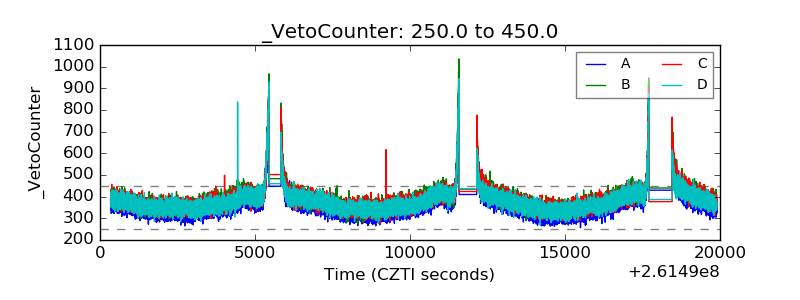 |