| Param | Original file | Final file |
|---|---|---|
| Filename | modeM0/AS1A04_199T01_9000002040_13774cztM0_level2.evt | modeM0/AS1A04_199T01_9000002040_13774cztM0_level2_quad_clean.evt |
| Size (bytes) | 475,519,680 | 88,257,600 |
| Size | 453.5 MB | 84.2 MB |
| Events in quadrant A | 3,378,150 | 549,198 |
| Events in quadrant B | 3,242,787 | 567,011 |
| Events in quadrant C | 3,112,535 | 559,390 |
| Events in quadrant D | 4,215,143 | 532,500 |
| Mode M9 | |||
|---|---|---|---|
| Quadrant | BADHDUFLAG | Total packets | Discarded packets |
| A | 0 | 15 | 0 |
| B | 0 | 15 | 0 |
| C | 0 | 15 | 0 |
| D | 0 | 15 | 0 |
| Mode SS | |||
|---|---|---|---|
| Quadrant | BADHDUFLAG | Total packets | Discarded packets |
| A | 0 | 136 | 0 |
| B | 0 | 136 | 0 |
| C | 0 | 136 | 0 |
| D | 0 | 136 | 0 |
| Mode M0 | |||
|---|---|---|---|
| Quadrant | BADHDUFLAG | Total packets | Discarded packets |
| A | 0 | 14559 | 3 |
| B | 0 | 13956 | 2 |
| C | 0 | 13642 | 2 |
| D | 0 | 17050 | 2 |
| Quadrant | Total seconds | Saturated seconds | Saturation percentage |
|---|---|---|---|
| A | 6660 | 143 | 2.147147% |
| B | 6660 | 61 | 0.915916% |
| C | 6660 | 14 | 0.210210% |
| D | 6660 | 136 | 2.042042% |
Noise dominated data is calculated using 1-second bins in cleaned event files. If a bin has >2000 counts, and if more than 50% of those come from <1% of pixels, then it is considered to be noise-dominated and hence unusable.
| Quadrant | # 1 sec bins | Bins with >0 counts | Bins with >2000 counts | High rate bins dominated by noise | Noise dominated (total time) | Noise dominated (detector-on time) | Marked lightcurve |
|---|---|---|---|---|---|---|---|
| A | 7586 | 6662 | 97 | 97 | 1.28% | 1.46% | 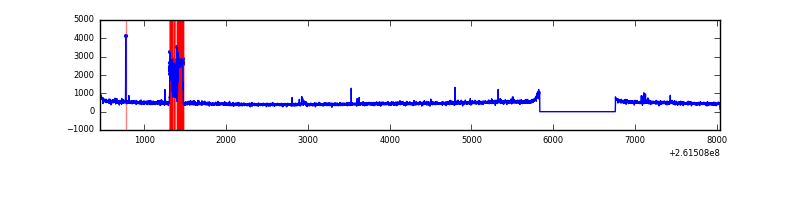 |
| B | 7586 | 6662 | 13 | 13 | 0.17% | 0.20% | 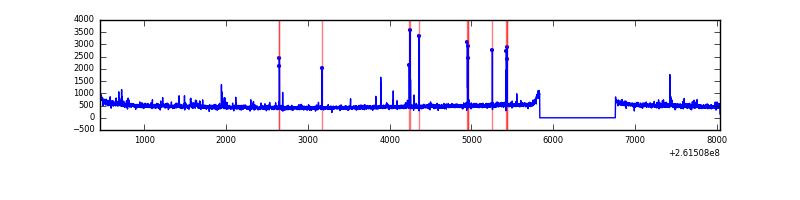 |
| C | 7586 | 6662 | 4 | 4 | 0.05% | 0.06% | 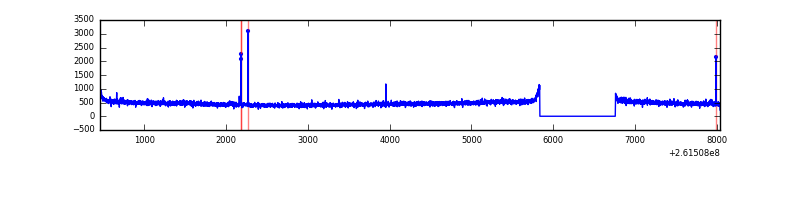 |
| D | 7586 | 6662 | 87 | 87 | 1.15% | 1.31% | 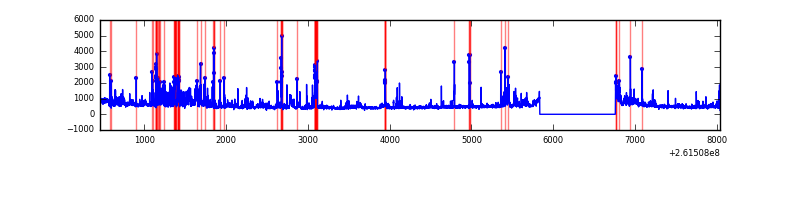 |
Top three noisy pixels from each quadrant. If the there are fewer than three noisy pixels in the level2.evt file, extra rows are filled as -1
| Pixel properties | Quadrant properties | ||||||
|---|---|---|---|---|---|---|---|
| Quadrant | DetID | PixID | Counts | Sigma | Mean | Median | Sigma |
| A | 9 | 143 | 312873 | 1928.08 | 785 | 765 | 161.9 |
| A | 2 | 79 | 9100 | 51.49 | 785 | 765 | 161.9 |
| A | 8 | 15 | 8749 | 49.32 | 785 | 765 | 161.9 |
| B | 4 | 80 | 33695 | 217.56 | 792 | 773 | 151.3 |
| B | 0 | 219 | 32333 | 208.55 | 792 | 773 | 151.3 |
| B | 4 | 173 | 22677 | 144.75 | 792 | 773 | 151.3 |
| C | 3 | 233 | 75969 | 416.93 | 773 | 775 | 180.4 |
| C | 14 | 220 | 19612 | 104.45 | 773 | 775 | 180.4 |
| C | 13 | 61 | 5445 | 25.89 | 773 | 775 | 180.4 |
| D | 5 | 222 | 686795 | 3639.94 | 770 | 747 | 188.5 |
| D | 1 | 52 | 365557 | 1935.56 | 770 | 747 | 188.5 |
| D | 10 | 157 | 133549 | 704.6 | 770 | 747 | 188.5 |
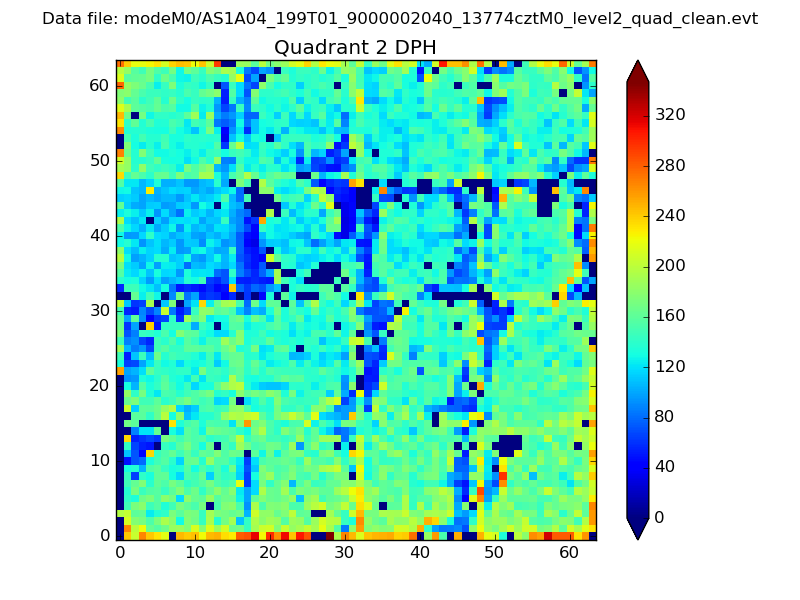
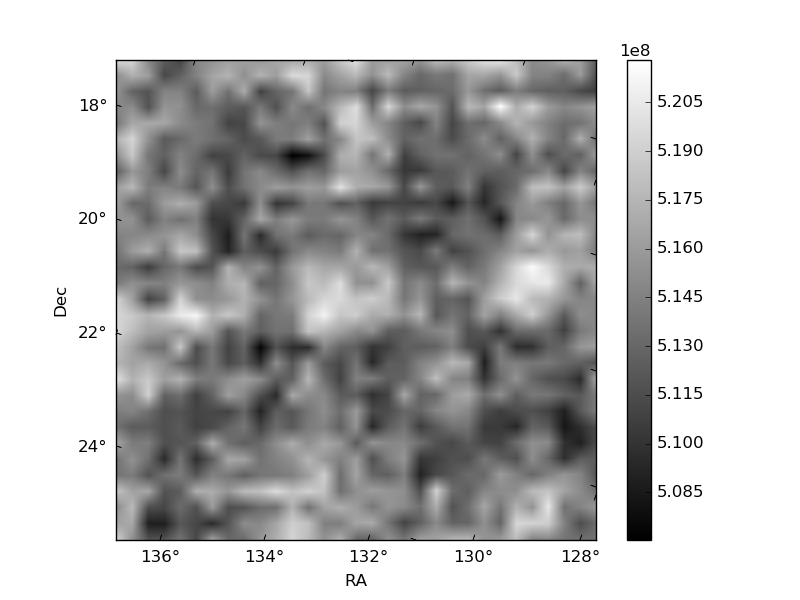
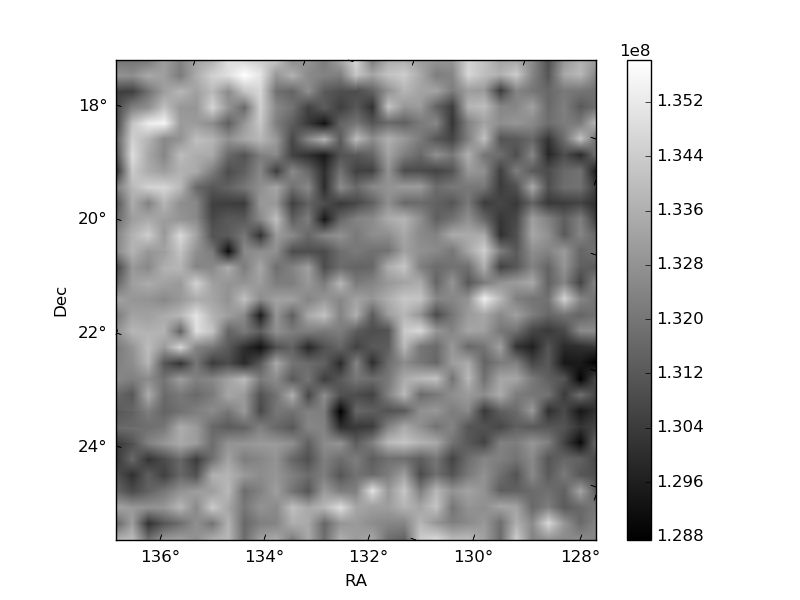
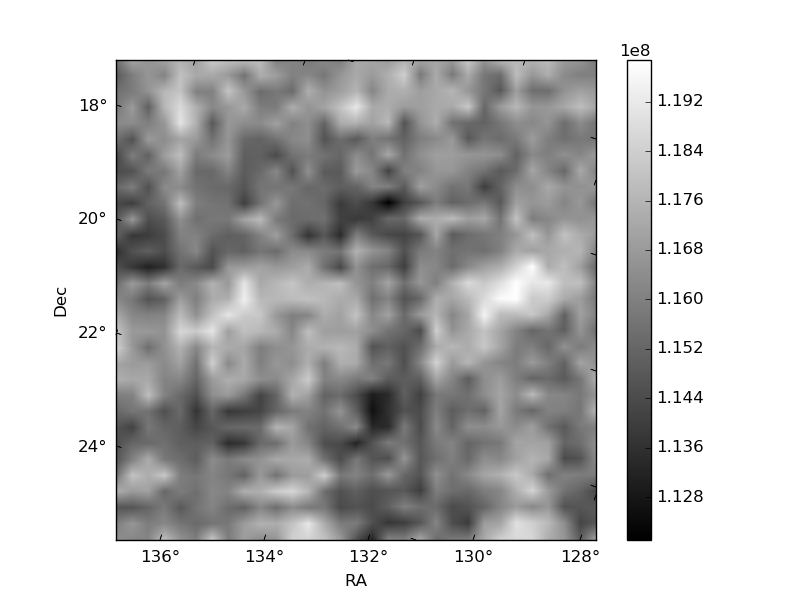
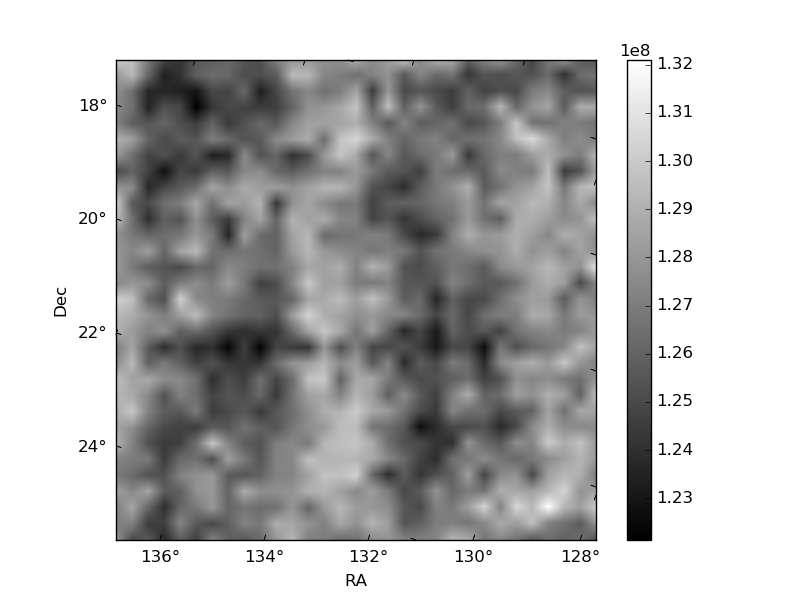
Histogram calculated using DETX and DETY for each event in the final _common_clean file
| Quadrant A | 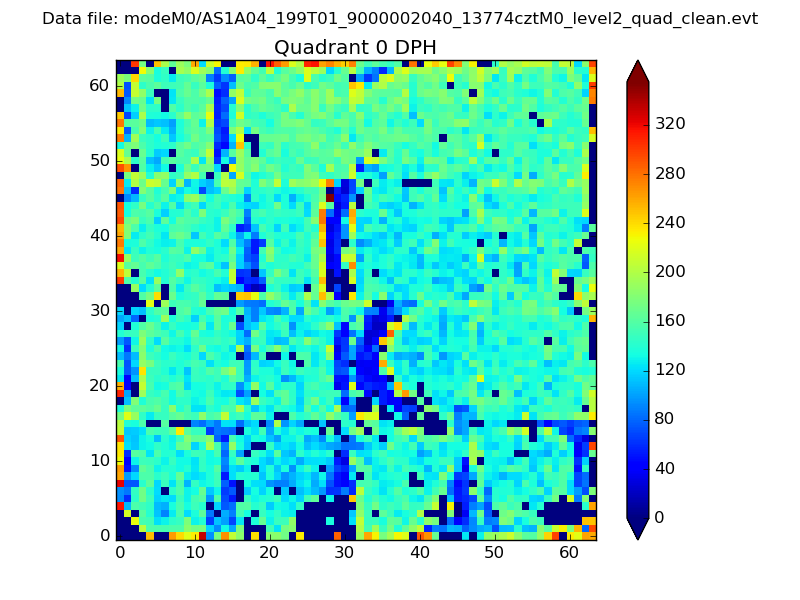 |
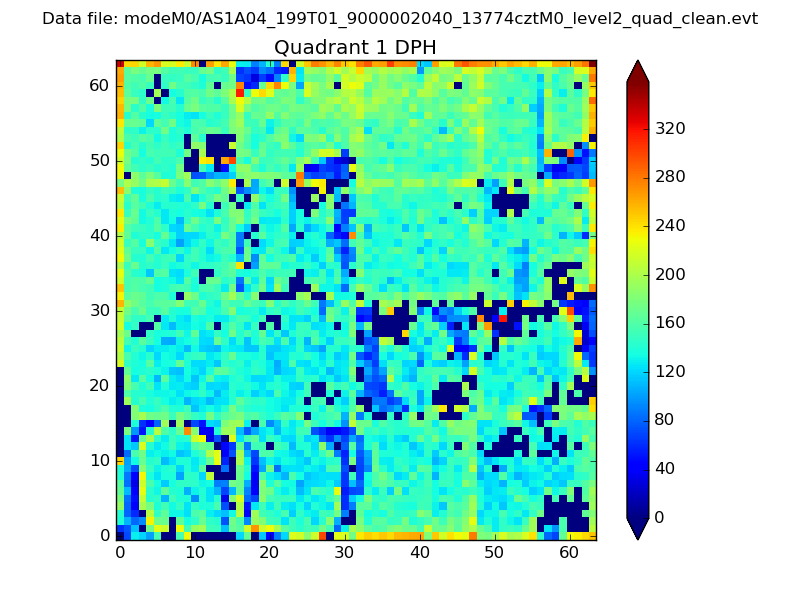 |
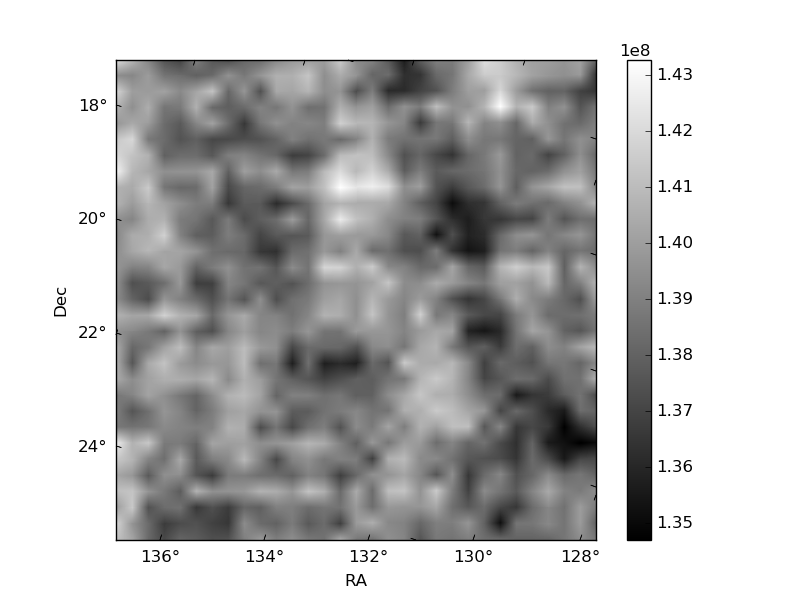
Quadrant B |
|---|---|---|---|
| Quadrant D | 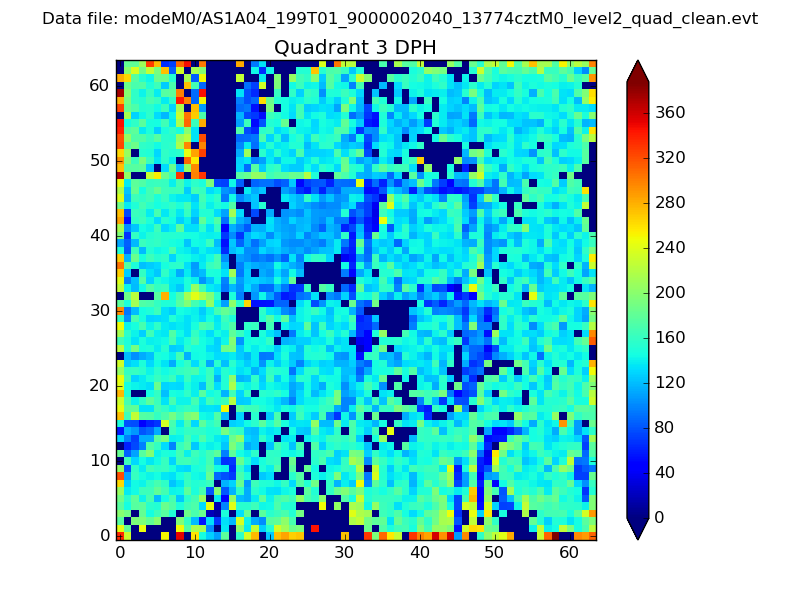 |
 |
Quadrant C |
| Plot type | Count rate plots | Images |
|---|---|---|
| Comparison with Poisson distribution Blue bars denote a histogram of data divided into 1 sec bins. Red curve is a Poisson curve with rate = median count rate of data. |
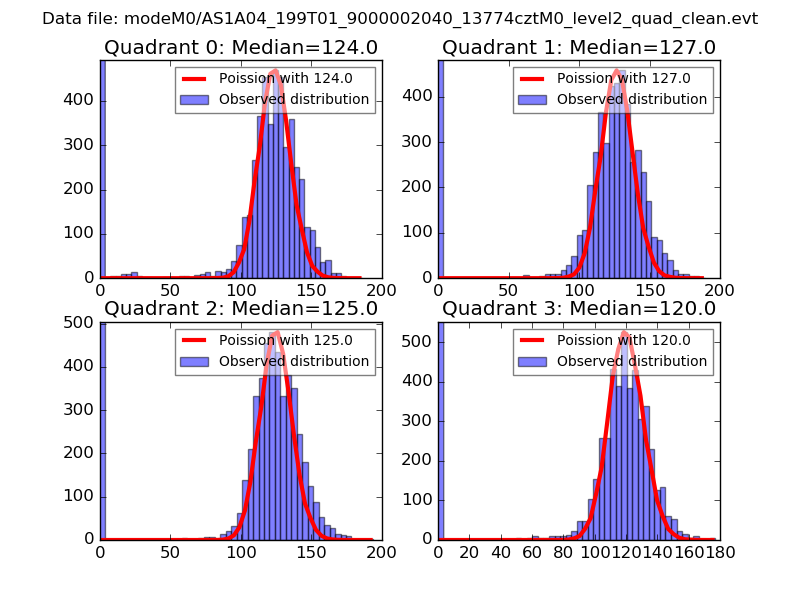 |
 |
| Quadrant-wise count rates Data is divided into 100 sec bins |
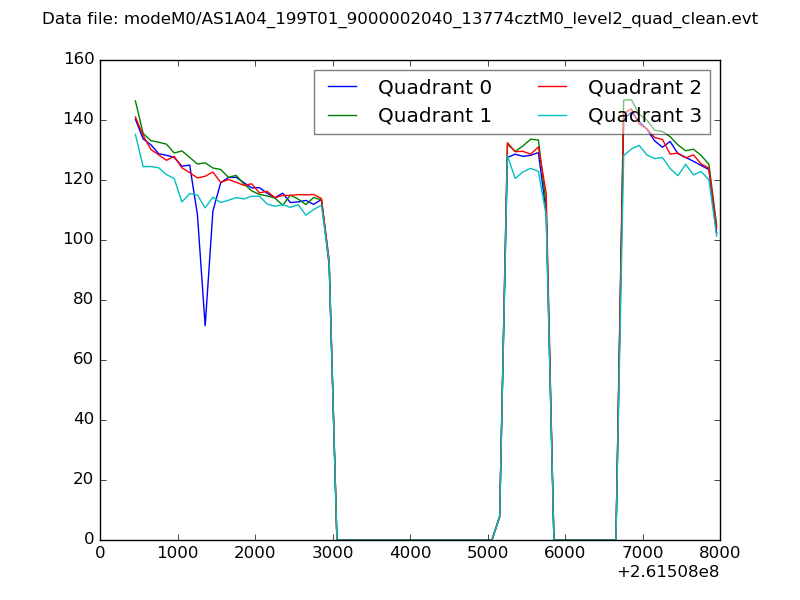 |
|
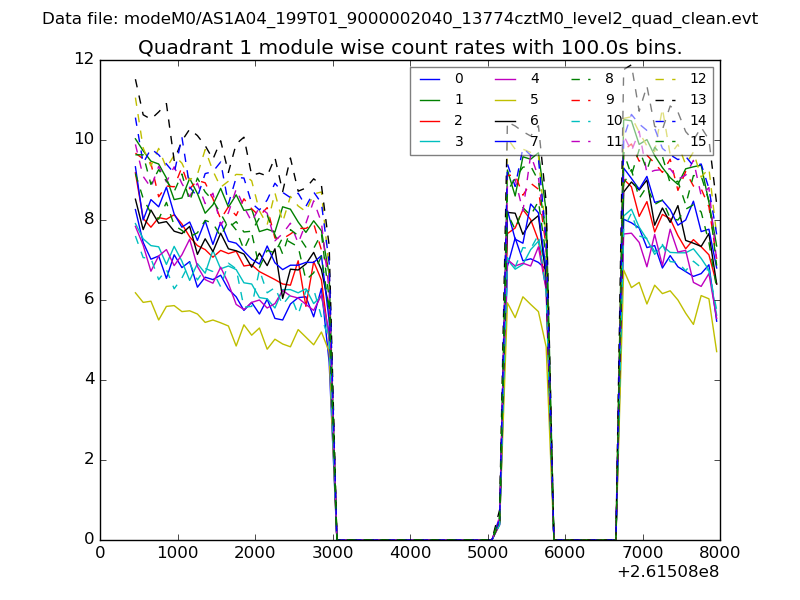
| Module-wise count rates for Quadrant A Data is divided into 100 sec bins |
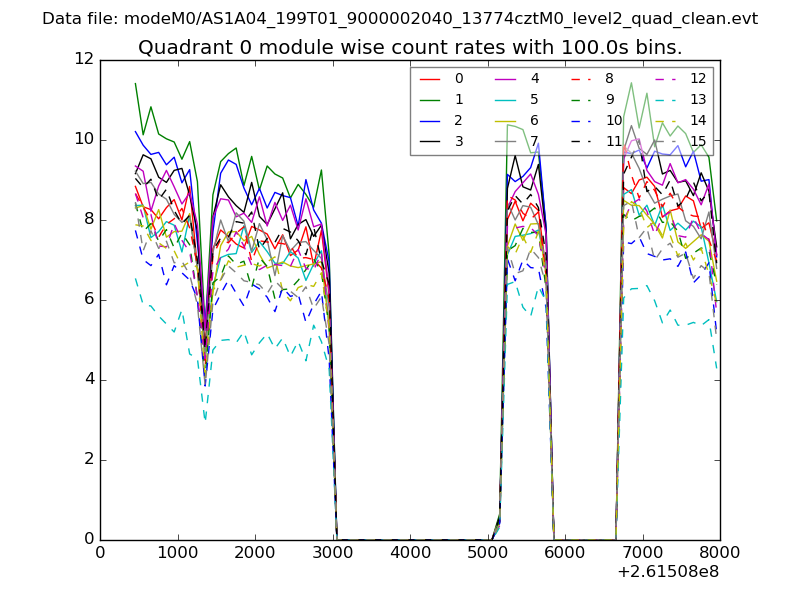 |
 |
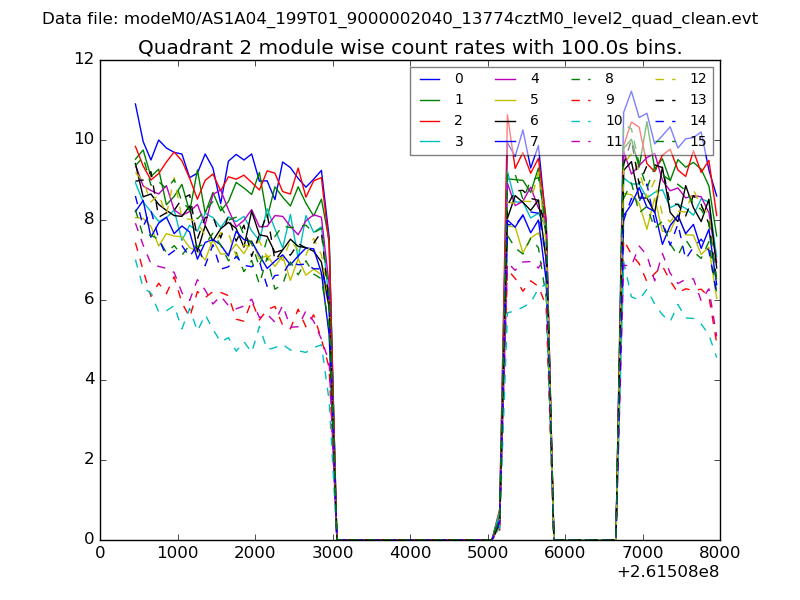
| Module-wise count rates for Quadrant B Data is divided into 100 sec bins |
 |
 |
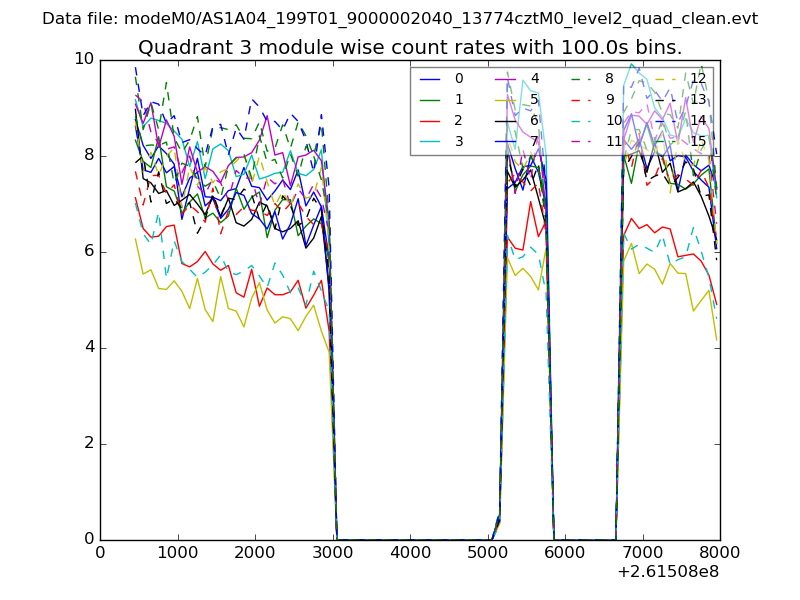
| Module-wise count rates for Quadrant C Data is divided into 100 sec bins |
 |
 |
| Module-wise count rates for Quadrant D Data is divided into 100 sec bins |
 |
 |
| Parameter | Plot |
|---|---|
| CZT HV Monitor | 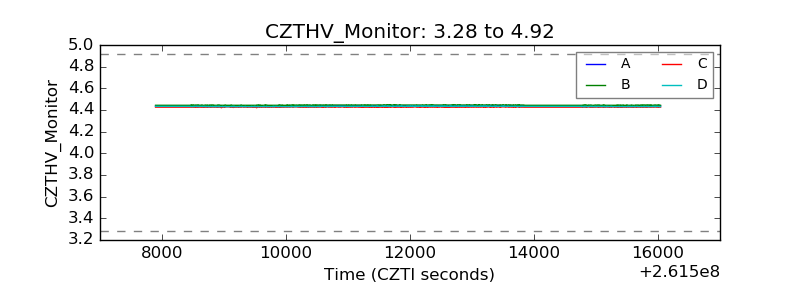 |
| D_VDD | 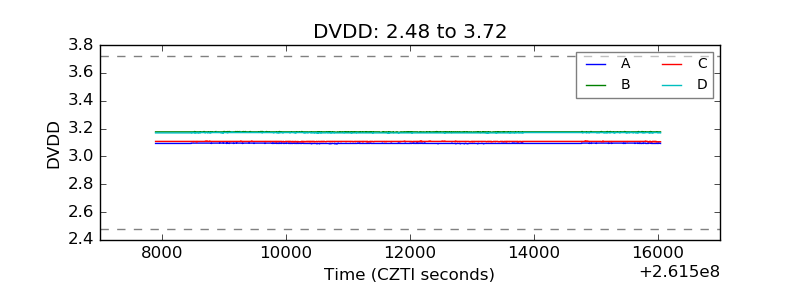 |
| Temperature 1 | 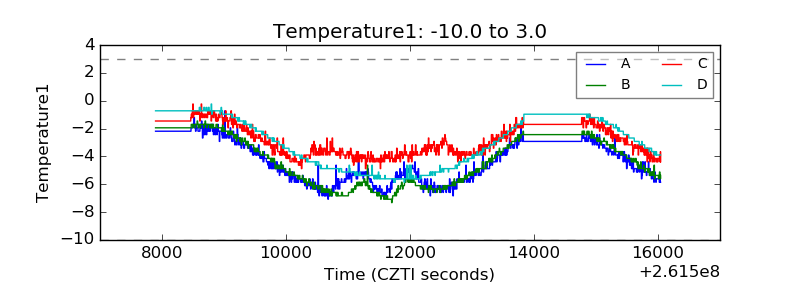 |
| Veto HV Monitor | 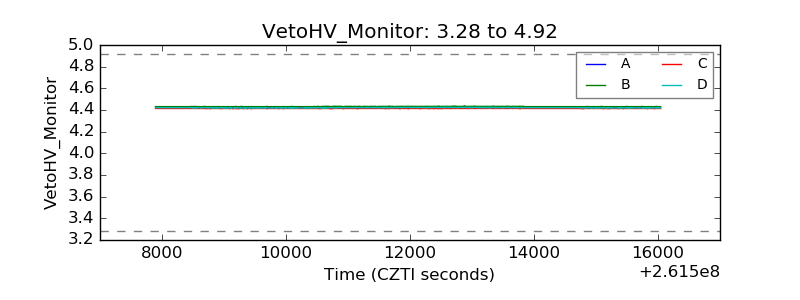 |
| Veto LLD | 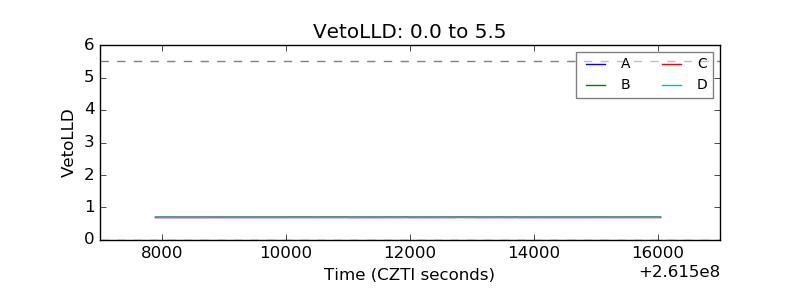 |
| Alpha Counter | 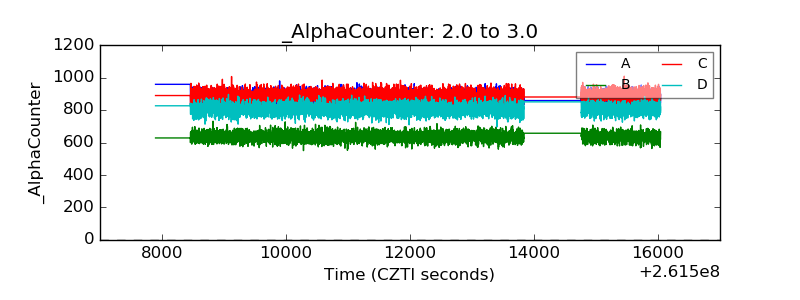 |
| _CPM_Rate | 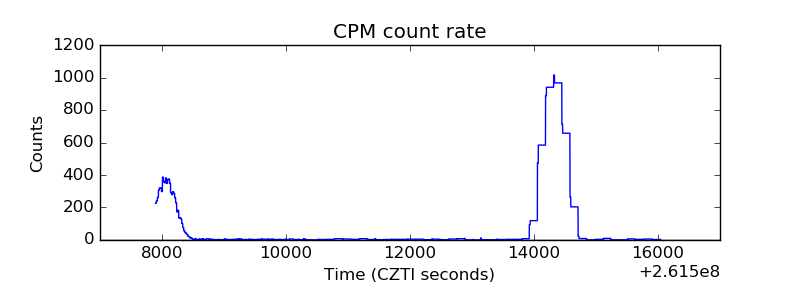 |
| CZT Counter | 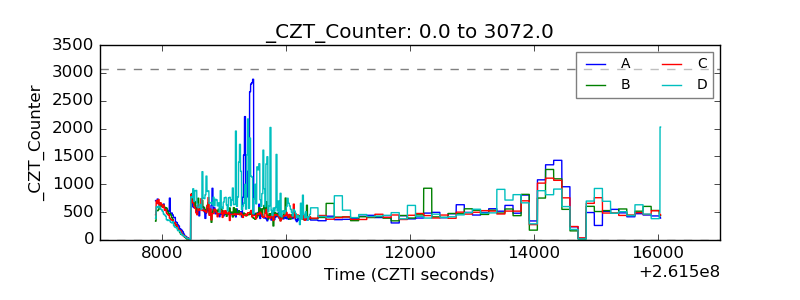 |
| +2.5 Volts monitor |  |
| +5 Volts monitor |  |
| _ROLL_ROT | 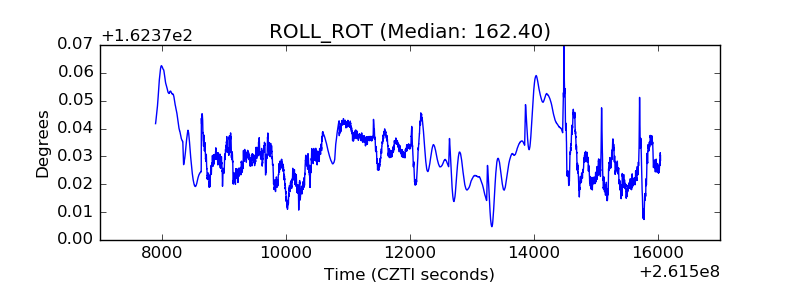 |
| _Roll_DEC | 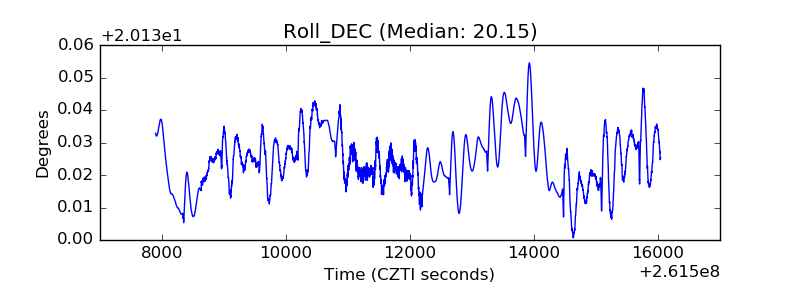 |
| _Roll_RA | 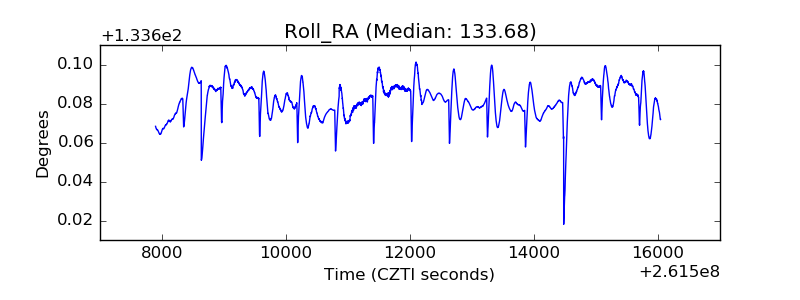 |
| Veto Counter | 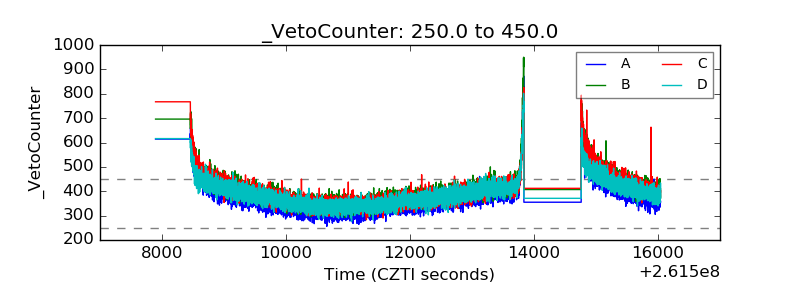 |