| Param | Original file | Final file |
|---|---|---|
| Filename | modeM0/AS1A04_199T01_9000002040_13777cztM0_level2.evt | modeM0/AS1A04_199T01_9000002040_13777cztM0_level2_quad_clean.evt |
| Size (bytes) | 456,926,400 | 93,997,440 |
| Size | 435.8 MB | 89.6 MB |
| Events in quadrant A | 3,191,815 | 602,179 |
| Events in quadrant B | 3,384,843 | 618,525 |
| Events in quadrant C | 3,166,992 | 603,160 |
| Events in quadrant D | 3,649,954 | 566,543 |
| Mode M9 | |||
|---|---|---|---|
| Quadrant | BADHDUFLAG | Total packets | Discarded packets |
| A | 0 | 23 | 0 |
| B | 0 | 23 | 0 |
| C | 0 | 23 | 0 |
| D | 0 | 23 | 0 |
| Mode SS | |||
|---|---|---|---|
| Quadrant | BADHDUFLAG | Total packets | Discarded packets |
| A | 0 | 134 | 0 |
| B | 0 | 134 | 0 |
| C | 0 | 134 | 0 |
| D | 0 | 134 | 0 |
| Mode M0 | |||
|---|---|---|---|
| Quadrant | BADHDUFLAG | Total packets | Discarded packets |
| A | 0 | 13660 | 3 |
| B | 0 | 14210 | 2 |
| C | 0 | 13530 | 2 |
| D | 0 | 15288 | 2 |
| Quadrant | Total seconds | Saturated seconds | Saturation percentage |
|---|---|---|---|
| A | 6544 | 47 | 0.718215% |
| B | 6544 | 79 | 1.207213% |
| C | 6544 | 16 | 0.244499% |
| D | 6544 | 52 | 0.794621% |
Noise dominated data is calculated using 1-second bins in cleaned event files. If a bin has >2000 counts, and if more than 50% of those come from <1% of pixels, then it is considered to be noise-dominated and hence unusable.
| Quadrant | # 1 sec bins | Bins with >0 counts | Bins with >2000 counts | High rate bins dominated by noise | Noise dominated (total time) | Noise dominated (detector-on time) | Marked lightcurve |
|---|---|---|---|---|---|---|---|
| A | 8805 | 6547 | 2 | 2 | 0.02% | 0.03% | 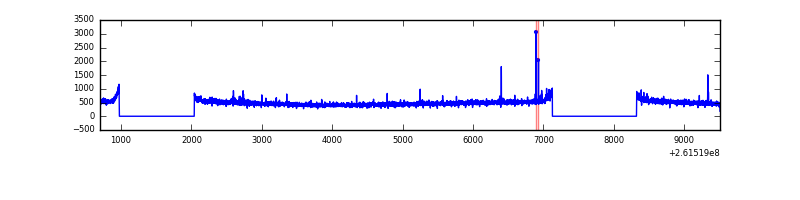 |
| B | 8805 | 6547 | 6 | 6 | 0.07% | 0.09% | 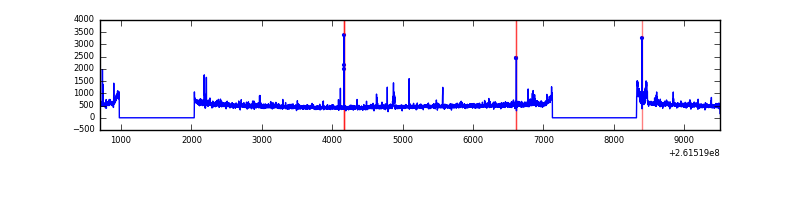 |
| C | 8805 | 6547 | 0 | 0 | 0.00% | 0.00% | 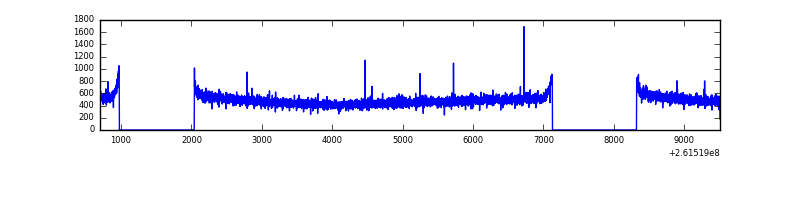 |
| D | 8805 | 6547 | 33 | 33 | 0.37% | 0.50% | 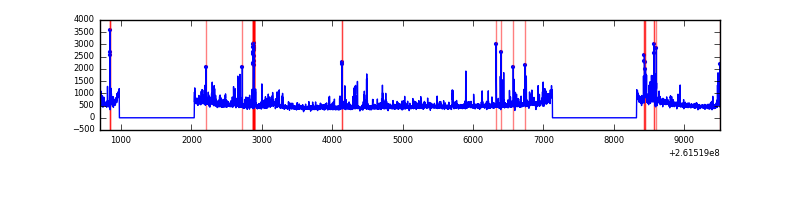 |
Top three noisy pixels from each quadrant. If the there are fewer than three noisy pixels in the level2.evt file, extra rows are filled as -1
| Pixel properties | Quadrant properties | ||||||
|---|---|---|---|---|---|---|---|
| Quadrant | DetID | PixID | Counts | Sigma | Mean | Median | Sigma |
| A | 1 | 162 | 27634 | 161.87 | 813 | 796 | 165.8 |
| A | 1 | 178 | 9465 | 52.29 | 813 | 796 | 165.8 |
| A | 1 | 161 | 8618 | 47.18 | 813 | 796 | 165.8 |
| B | 15 | 33 | 41462 | 261.92 | 821 | 803 | 155.2 |
| B | 0 | 219 | 28991 | 181.58 | 821 | 803 | 155.2 |
| B | 4 | 173 | 21681 | 134.49 | 821 | 803 | 155.2 |
| C | 3 | 233 | 63736 | 341.01 | 794 | 801 | 184.6 |
| C | 14 | 220 | 6344 | 30.03 | 794 | 801 | 184.6 |
| C | 13 | 61 | 5528 | 25.61 | 794 | 801 | 184.6 |
| D | 1 | 52 | 352562 | 1856.04 | 782 | 760 | 189.5 |
| D | 13 | 249 | 119541 | 626.67 | 782 | 760 | 189.5 |
| D | 5 | 222 | 90859 | 475.35 | 782 | 760 | 189.5 |
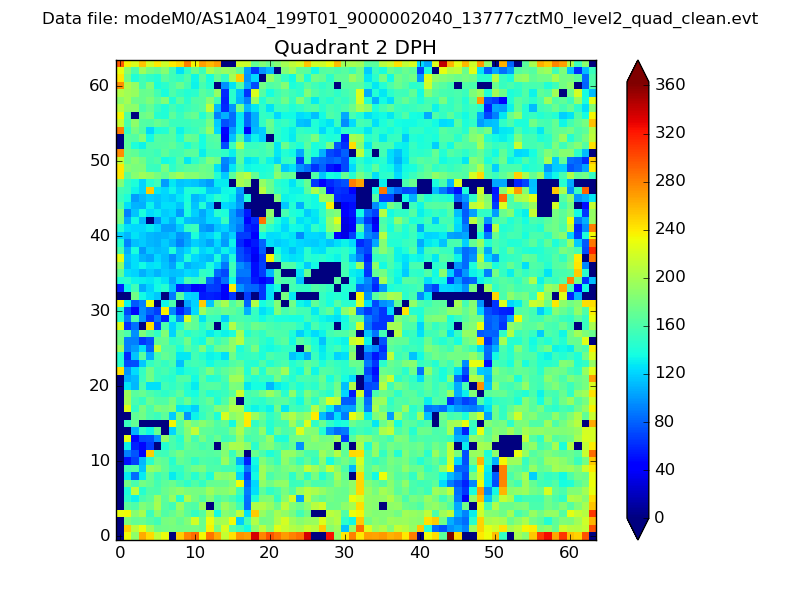
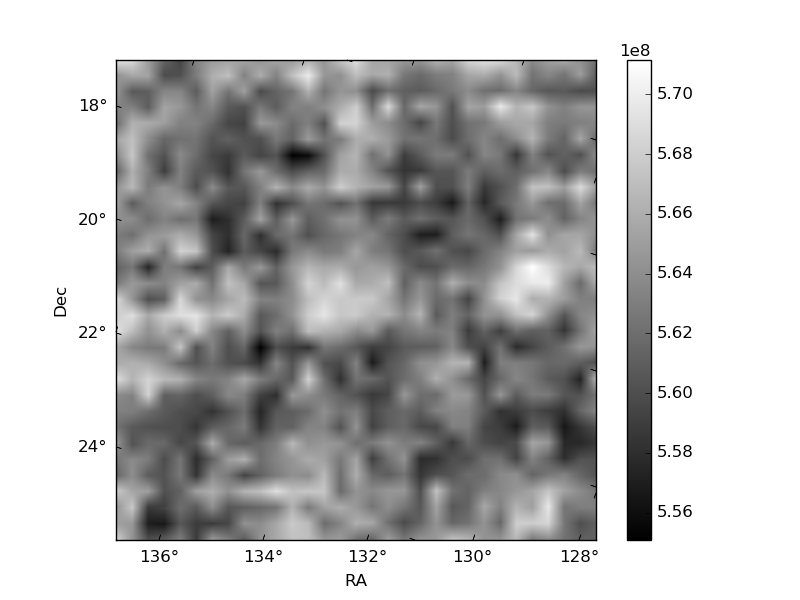
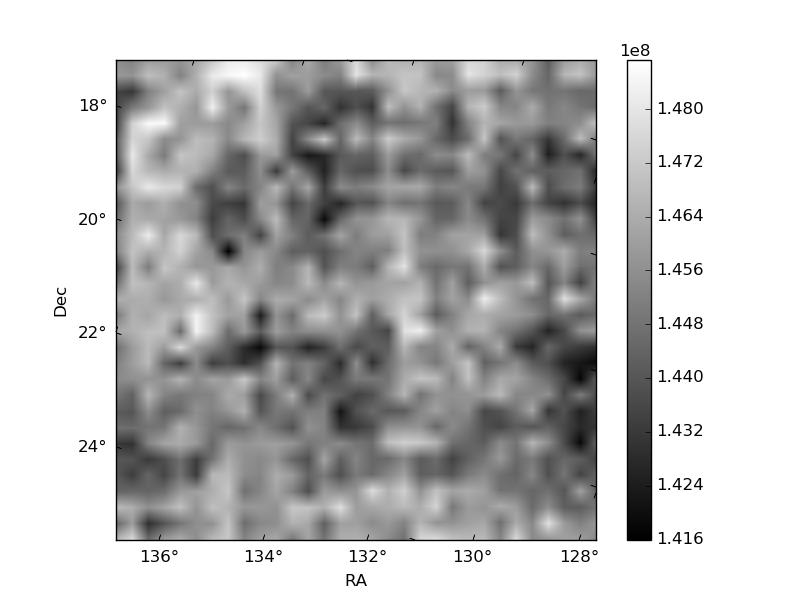
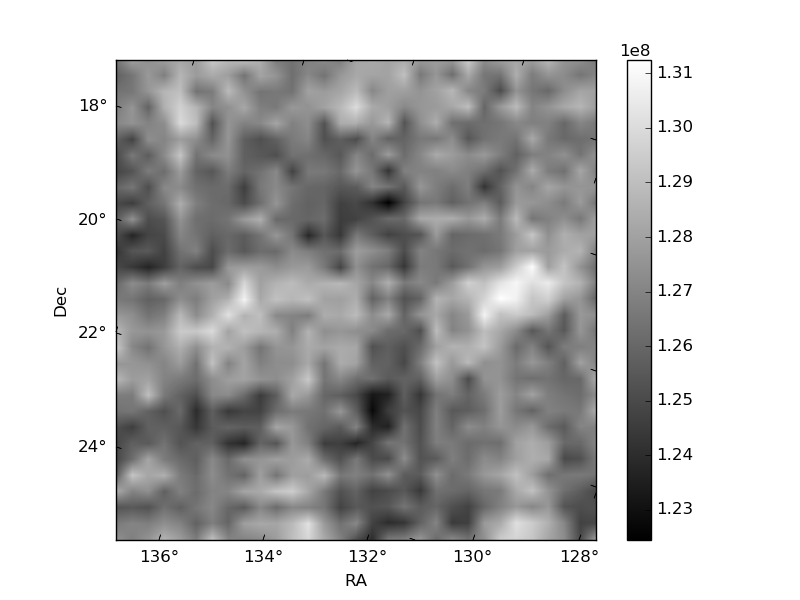
Histogram calculated using DETX and DETY for each event in the final _common_clean file
| Quadrant A | 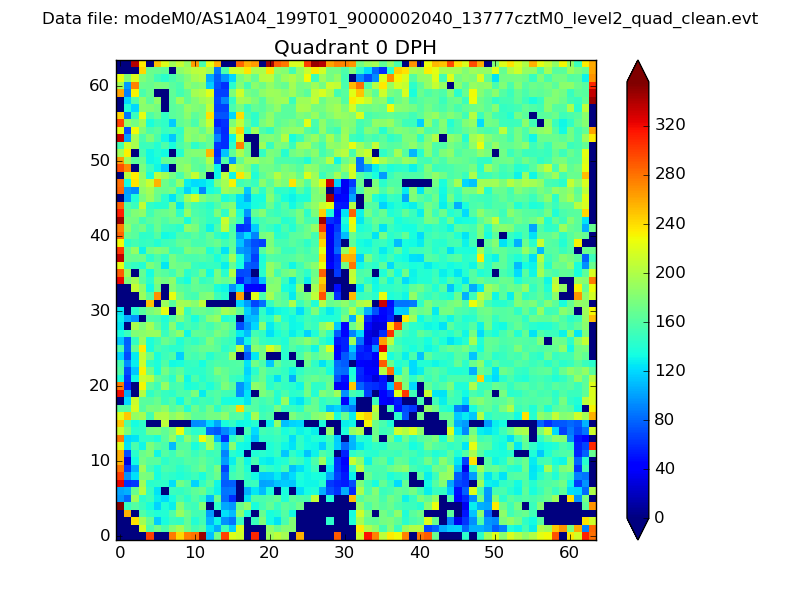 |
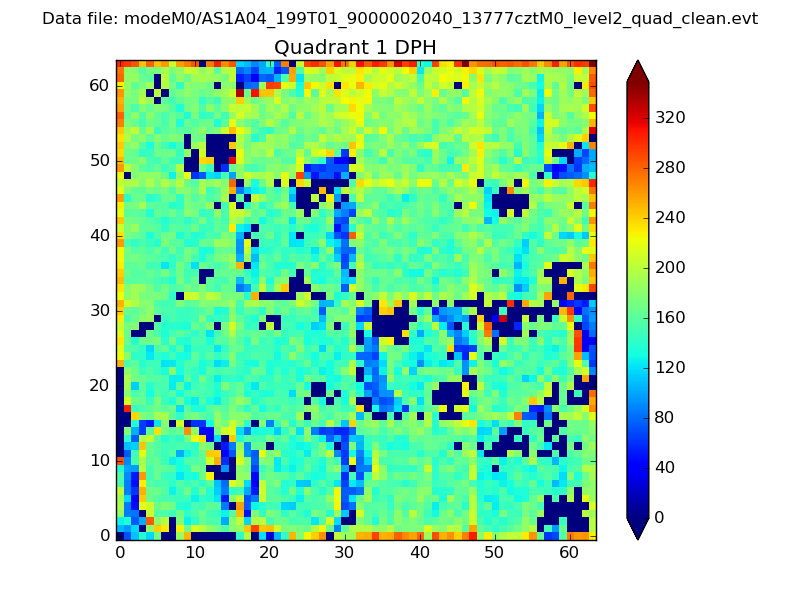 |
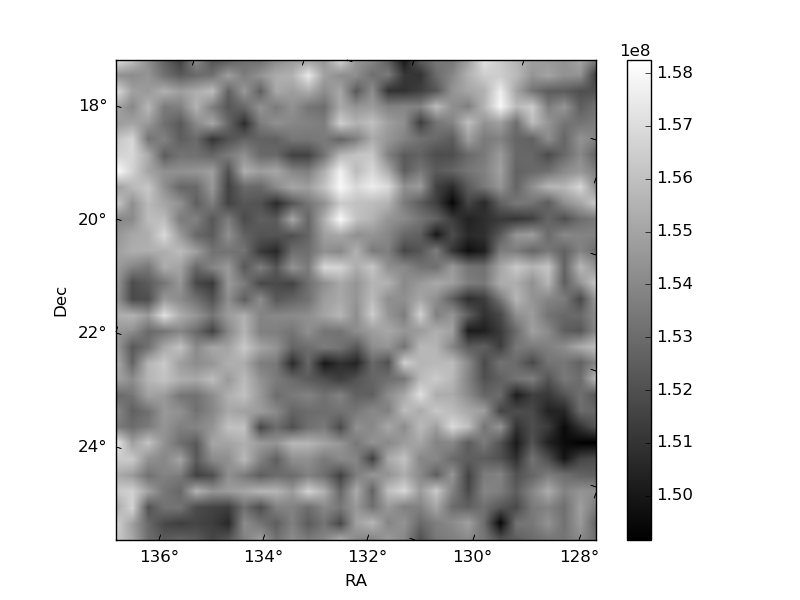
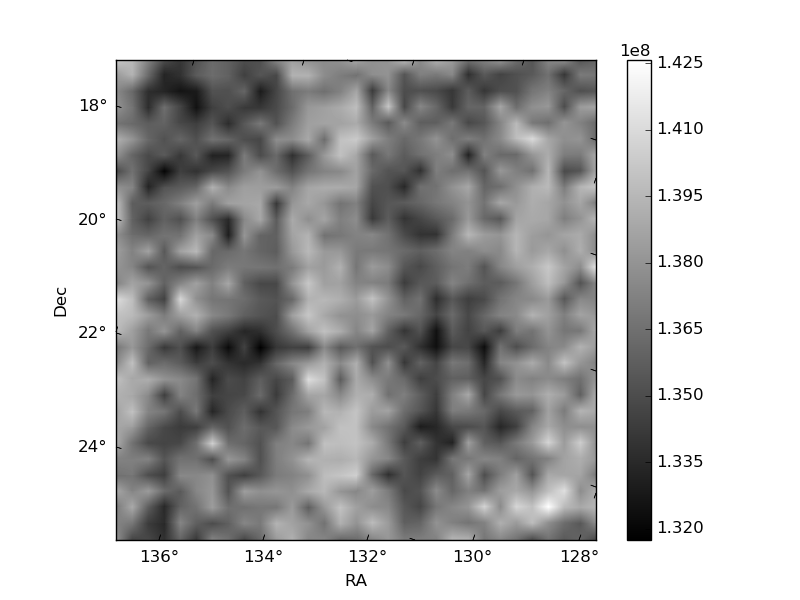
Quadrant B |
|---|---|---|---|
| Quadrant D | 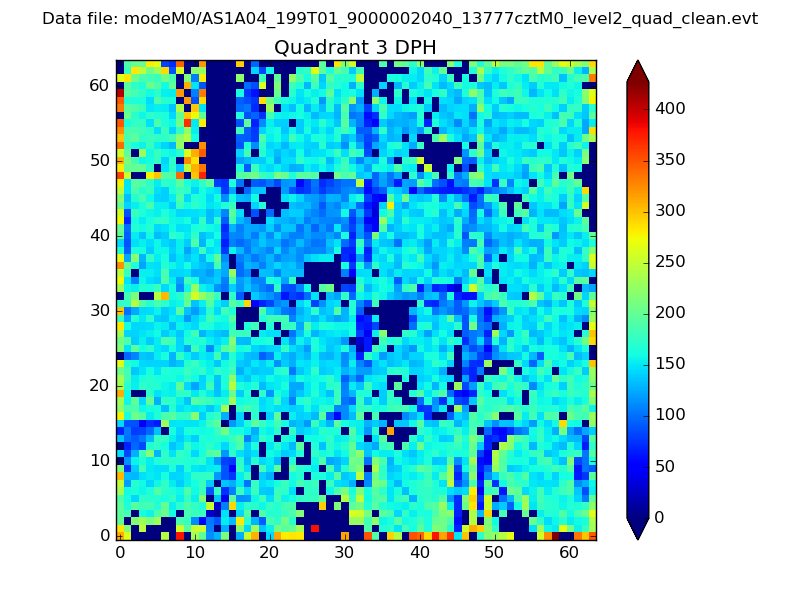 |
 |
Quadrant C |
| Plot type | Count rate plots | Images |
|---|---|---|
| Comparison with Poisson distribution Blue bars denote a histogram of data divided into 1 sec bins. Red curve is a Poisson curve with rate = median count rate of data. |
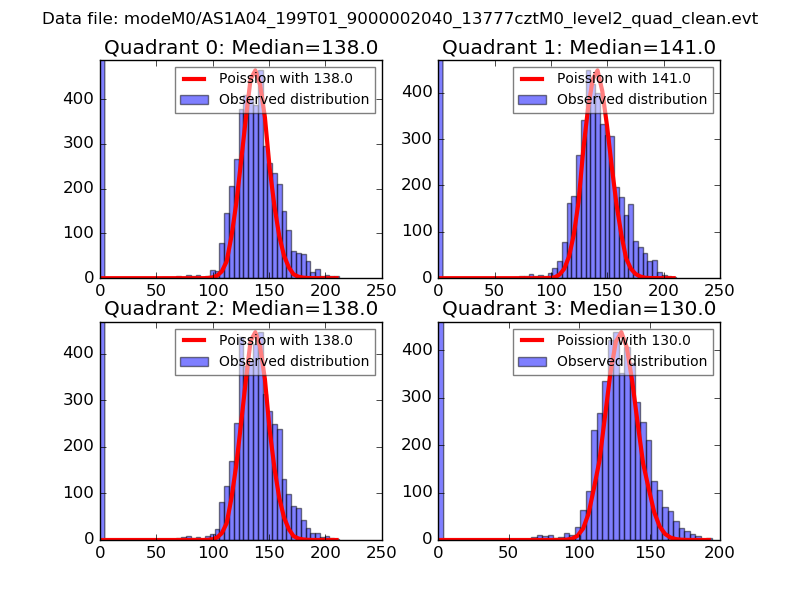 |
 |
| Quadrant-wise count rates Data is divided into 100 sec bins |
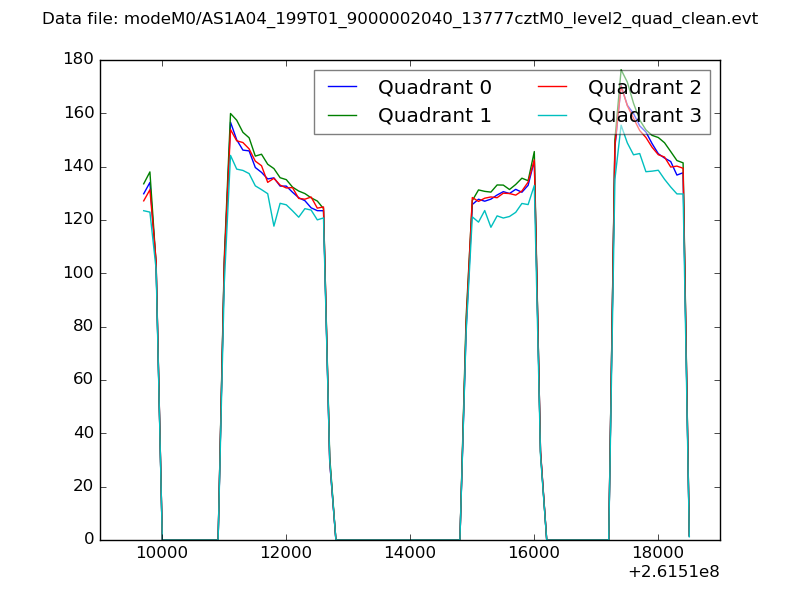 |
|
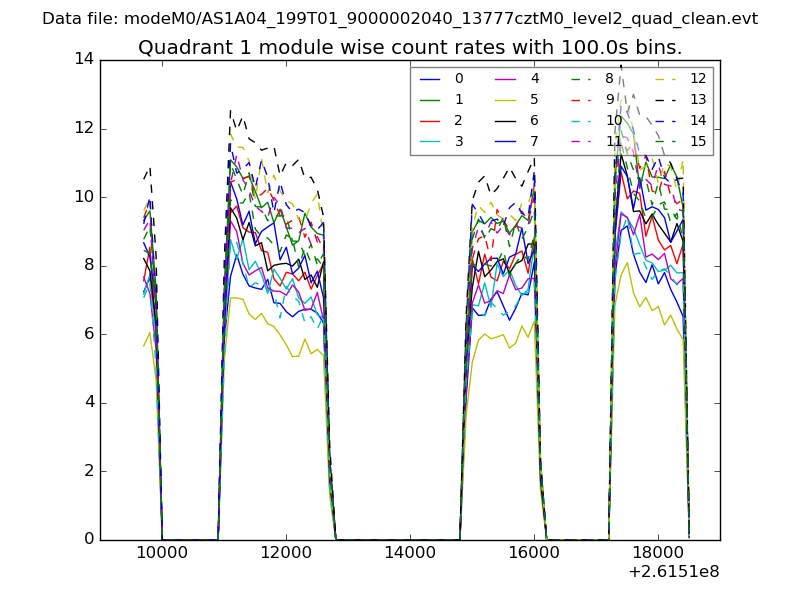
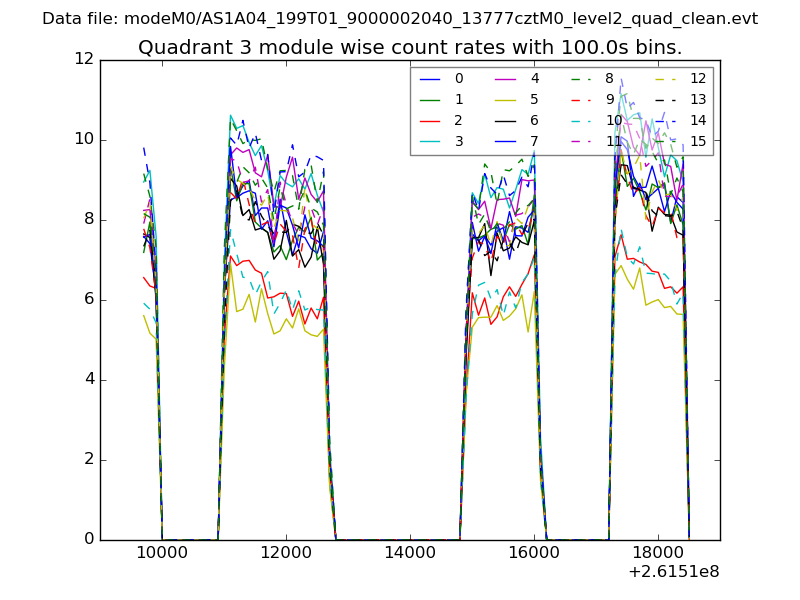
| Module-wise count rates for Quadrant A Data is divided into 100 sec bins |
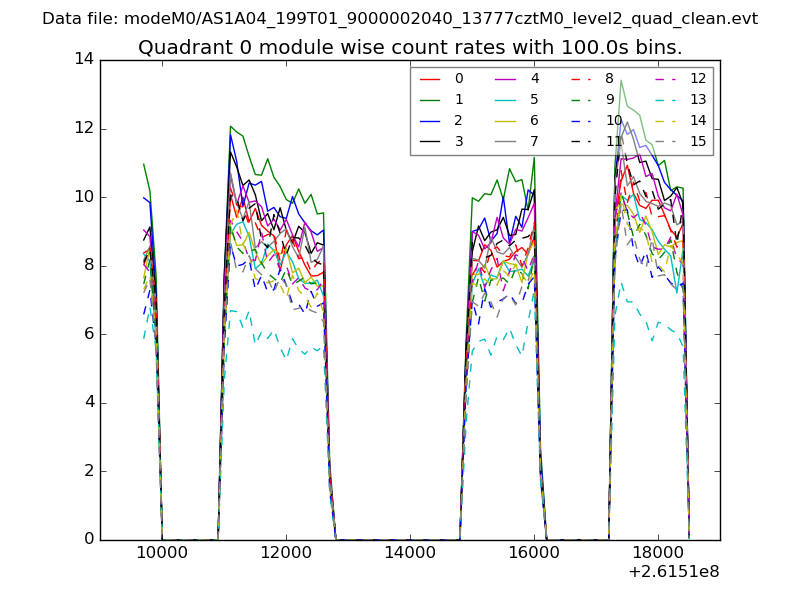 |
 |
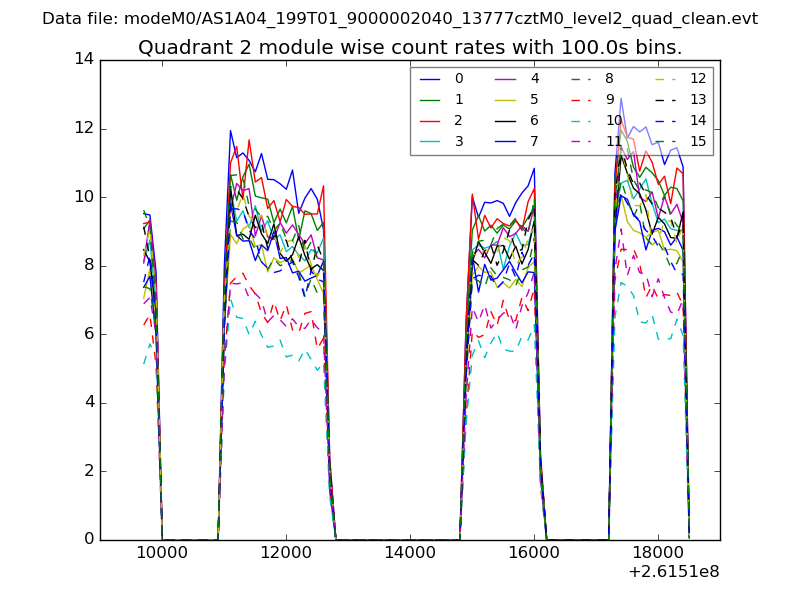
| Module-wise count rates for Quadrant B Data is divided into 100 sec bins |
 |
 |
| Module-wise count rates for Quadrant C Data is divided into 100 sec bins |
 |
 |
| Module-wise count rates for Quadrant D Data is divided into 100 sec bins |
 |
 |
| Parameter | Plot |
|---|---|
| CZT HV Monitor | 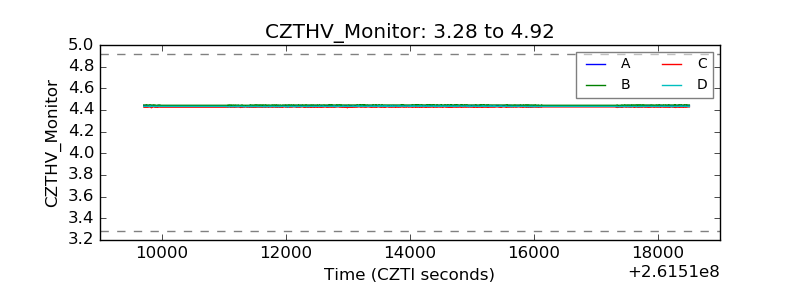 |
| D_VDD | 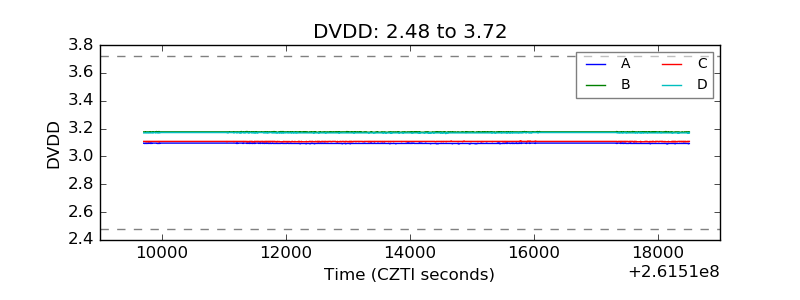 |
| Temperature 1 | 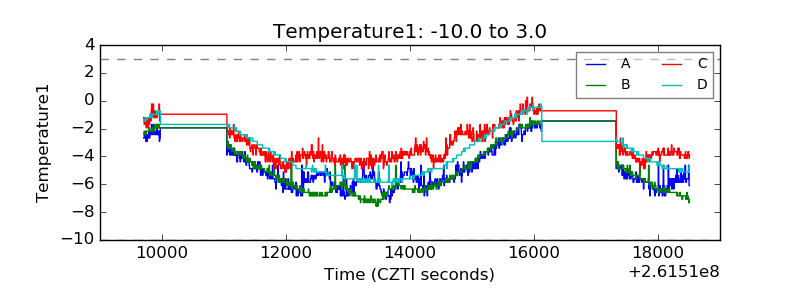 |
| Veto HV Monitor | 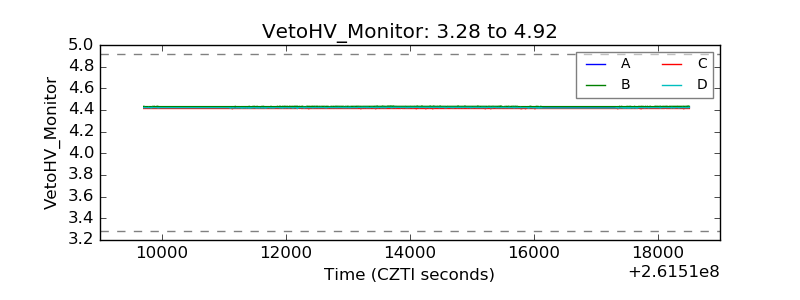 |
| Veto LLD | 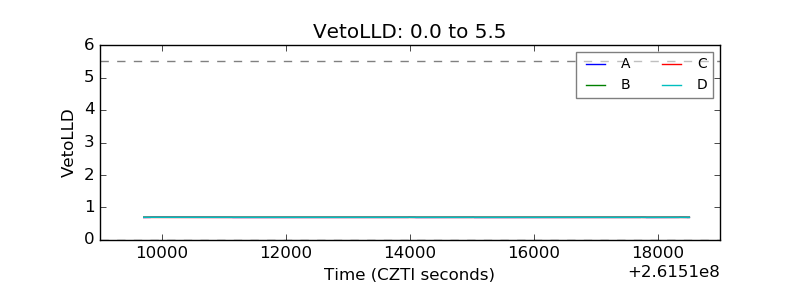 |
| Alpha Counter | 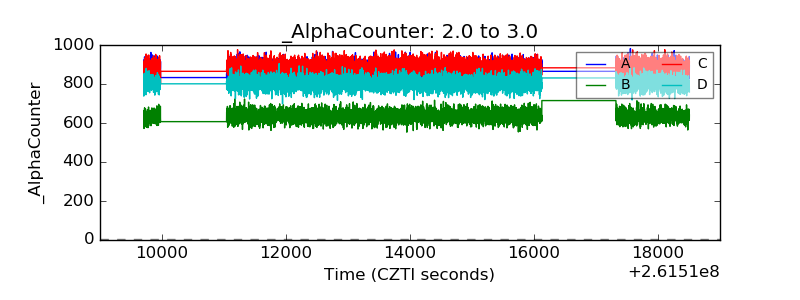 |
| _CPM_Rate | 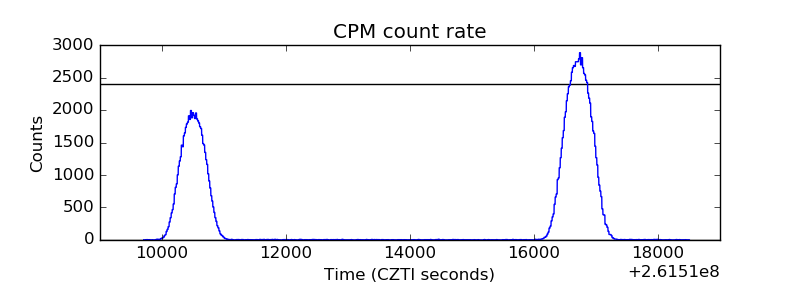 |
| CZT Counter | 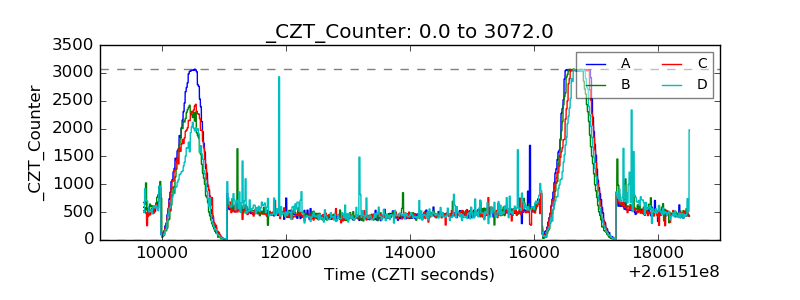 |
| +2.5 Volts monitor |  |
| +5 Volts monitor |  |
| _ROLL_ROT | 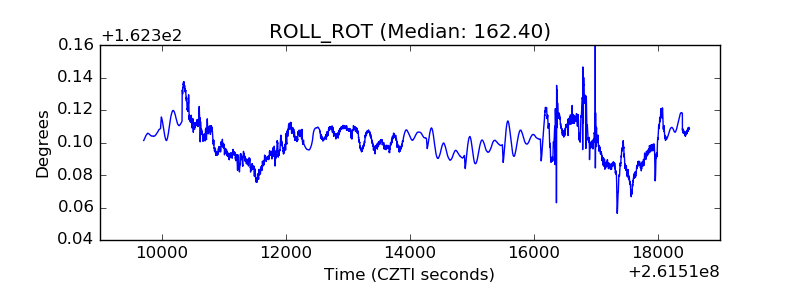 |
| _Roll_DEC | 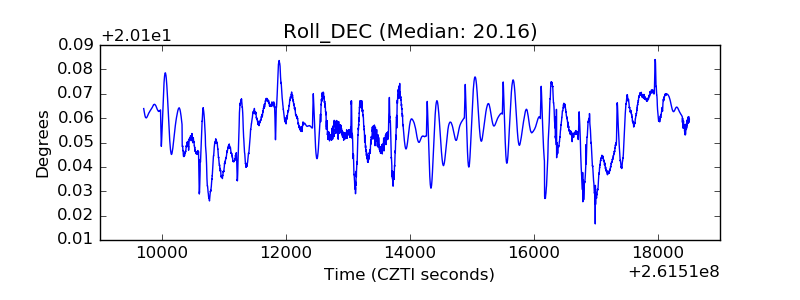 |
| _Roll_RA | 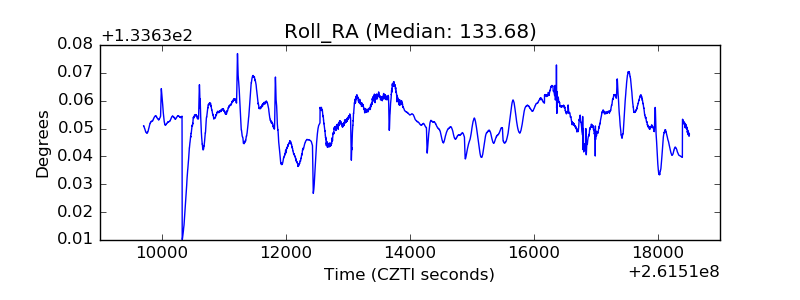 |
| Veto Counter | 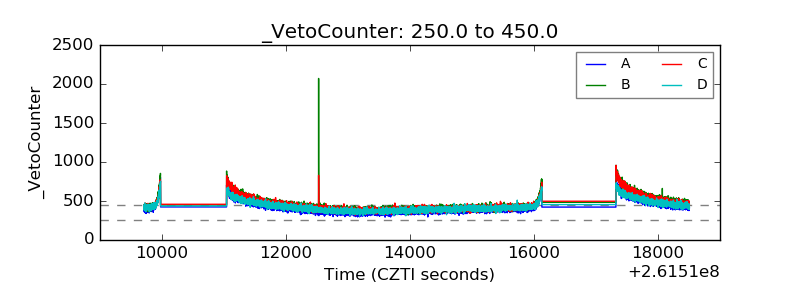 |