| Param | Original file | Final file |
|---|---|---|
| Filename | modeM0/AS1A04_199T01_9000002040_13778cztM0_level2.evt | modeM0/AS1A04_199T01_9000002040_13778cztM0_level2_quad_clean.evt |
| Size (bytes) | 571,397,760 | 80,665,920 |
| Size | 544.9 MB | 76.9 MB |
| Events in quadrant A | 3,154,686 | 545,192 |
| Events in quadrant B | 3,385,846 | 558,807 |
| Events in quadrant C | 3,128,935 | 538,865 |
| Events in quadrant D | 7,207,003 | 358,535 |
| Mode M9 | |||
|---|---|---|---|
| Quadrant | BADHDUFLAG | Total packets | Discarded packets |
| A | 0 | 25 | 0 |
| B | 0 | 25 | 0 |
| C | 0 | 25 | 0 |
| D | 0 | 25 | 0 |
| Mode SS | |||
|---|---|---|---|
| Quadrant | BADHDUFLAG | Total packets | Discarded packets |
| A | 0 | 130 | 0 |
| B | 0 | 130 | 0 |
| C | 0 | 130 | 0 |
| D | 0 | 130 | 0 |
| Mode M0 | |||
|---|---|---|---|
| Quadrant | BADHDUFLAG | Total packets | Discarded packets |
| A | 0 | 13263 | 3 |
| B | 0 | 13982 | 2 |
| C | 0 | 13146 | 2 |
| D | 0 | 25650 | 2 |
| Quadrant | Total seconds | Saturated seconds | Saturation percentage |
|---|---|---|---|
| A | 6314 | 25 | 0.395946% |
| B | 6314 | 63 | 0.997783% |
| C | 6314 | 7 | 0.110865% |
| D | 6314 | 1646 | 26.069053% |
Noise dominated data is calculated using 1-second bins in cleaned event files. If a bin has >2000 counts, and if more than 50% of those come from <1% of pixels, then it is considered to be noise-dominated and hence unusable.
| Quadrant | # 1 sec bins | Bins with >0 counts | Bins with >2000 counts | High rate bins dominated by noise | Noise dominated (total time) | Noise dominated (detector-on time) | Marked lightcurve |
|---|---|---|---|---|---|---|---|
| A | 8820 | 6317 | 0 | 0 | 0.00% | 0.00% | 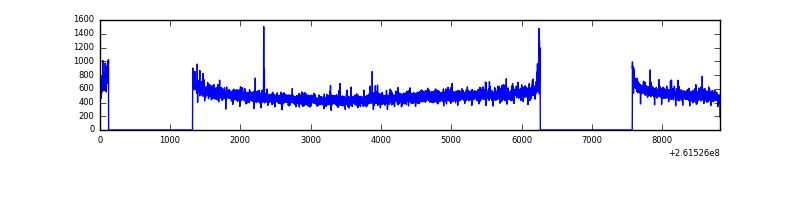 |
| B | 8820 | 6317 | 9 | 9 | 0.10% | 0.14% | 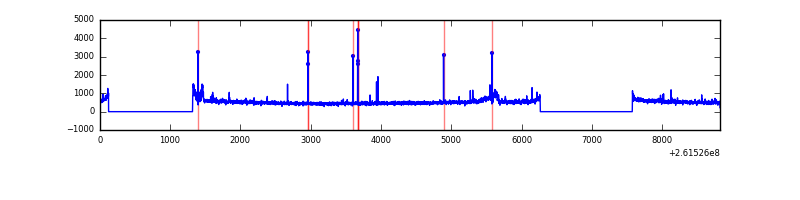 |
| C | 8820 | 6317 | 0 | 0 | 0.00% | 0.00% | 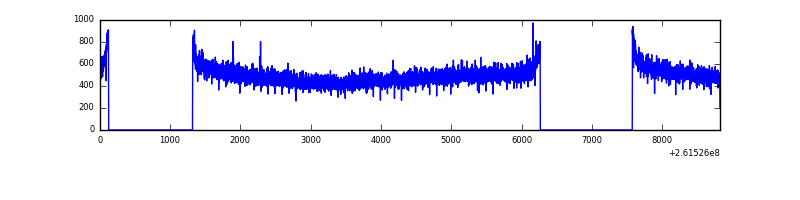 |
| D | 8820 | 6316 | 1585 | 1585 | 17.97% | 25.09% | 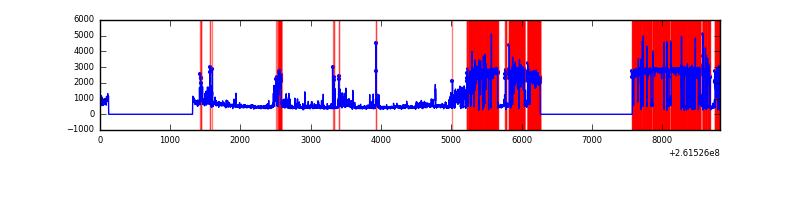 |
Top three noisy pixels from each quadrant. If the there are fewer than three noisy pixels in the level2.evt file, extra rows are filled as -1
| Pixel properties | Quadrant properties | ||||||
|---|---|---|---|---|---|---|---|
| Quadrant | DetID | PixID | Counts | Sigma | Mean | Median | Sigma |
| A | 1 | 162 | 20066 | 117.71 | 807 | 792 | 163.7 |
| A | 15 | 69 | 8310 | 45.91 | 807 | 792 | 163.7 |
| A | 0 | 226 | 7440 | 40.6 | 807 | 792 | 163.7 |
| B | 15 | 33 | 108466 | 705.08 | 813 | 794 | 152.7 |
| B | 4 | 80 | 39942 | 256.36 | 813 | 794 | 152.7 |
| B | 4 | 173 | 18890 | 118.5 | 813 | 794 | 152.7 |
| C | 3 | 233 | 73889 | 405.32 | 783 | 791 | 180.3 |
| C | 13 | 61 | 5714 | 27.3 | 783 | 791 | 180.3 |
| C | 14 | 220 | 3127 | 12.95 | 783 | 791 | 180.3 |
| D | 1 | 3 | 4117567 | 26518.81 | 638 | 619 | 155.2 |
| D | 5 | 222 | 312880 | 2011.39 | 638 | 619 | 155.2 |
| D | 1 | 52 | 223391 | 1434.96 | 638 | 619 | 155.2 |
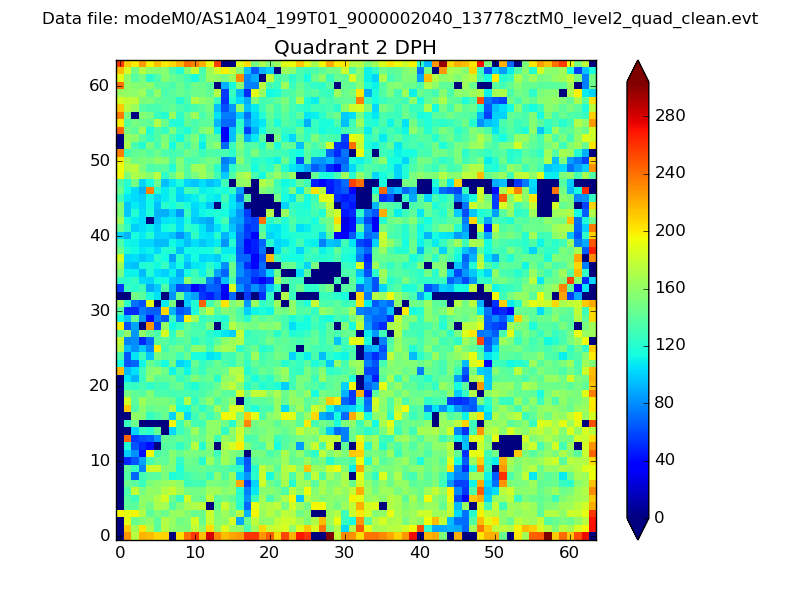
Histogram calculated using DETX and DETY for each event in the final _common_clean file
| Quadrant A | 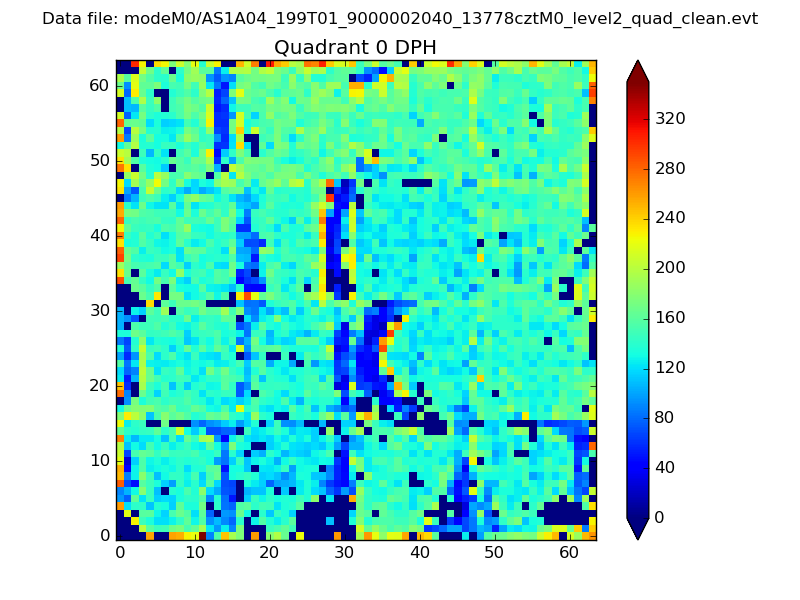 |
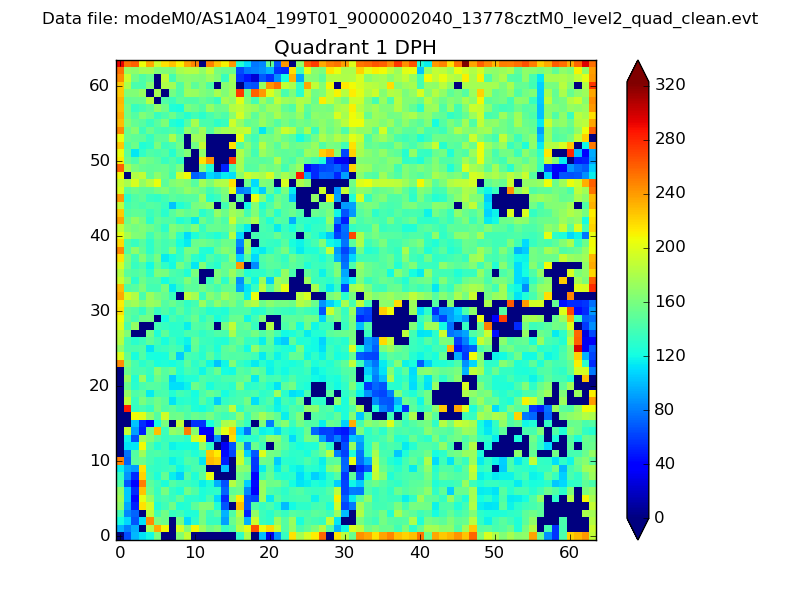 |
Quadrant B |
|---|---|---|---|
| Quadrant D | 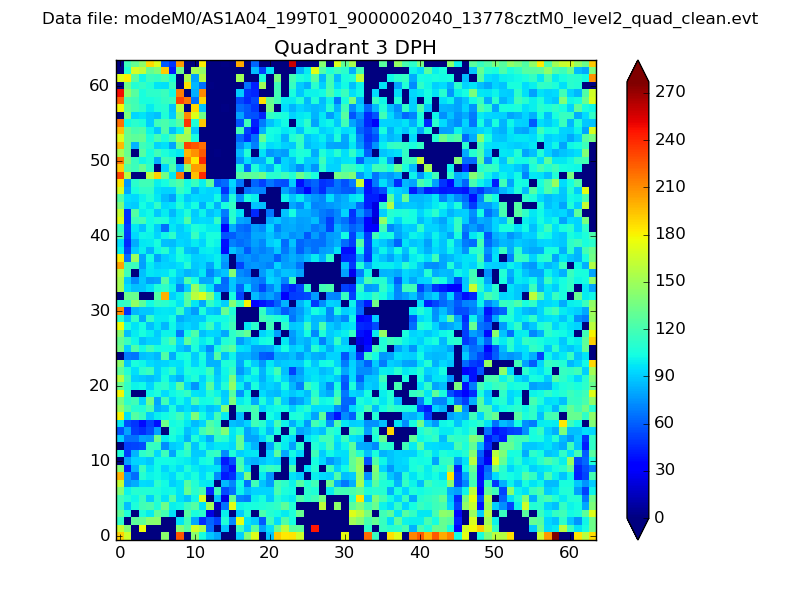 |
 |
Quadrant C |
| Plot type | Count rate plots | Images |
|---|---|---|
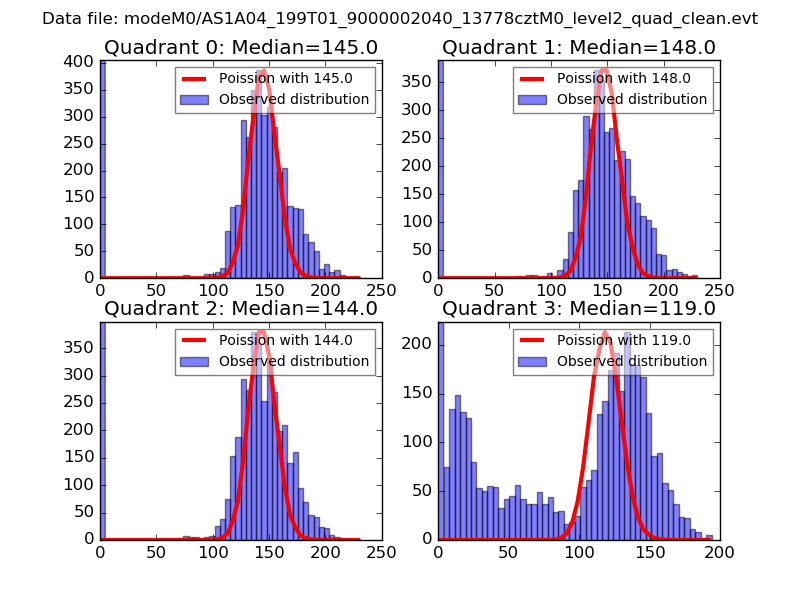
| Comparison with Poisson distribution Blue bars denote a histogram of data divided into 1 sec bins. Red curve is a Poisson curve with rate = median count rate of data. |
 |
 |
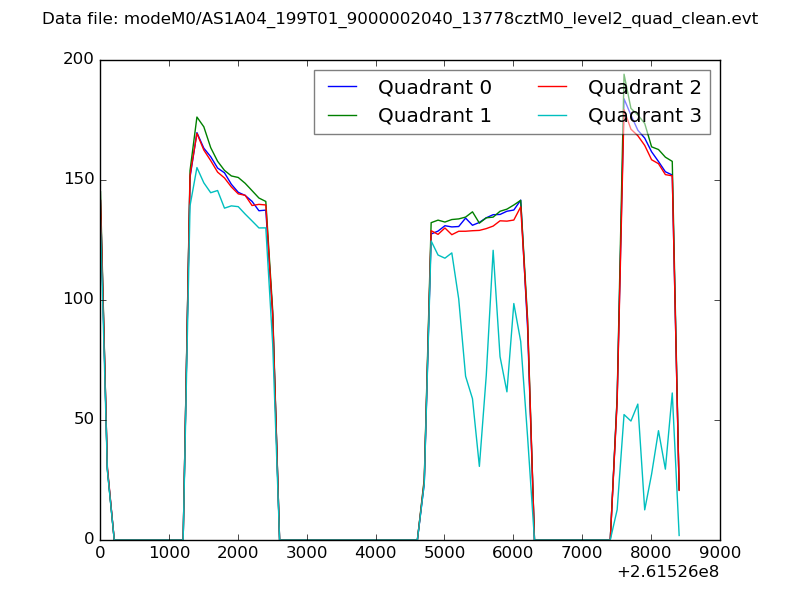
| Quadrant-wise count rates Data is divided into 100 sec bins |
 |
|
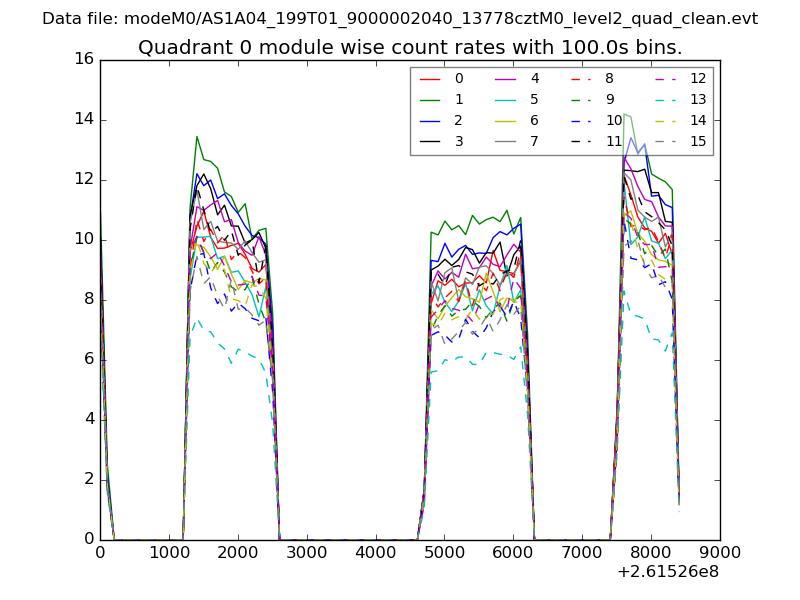
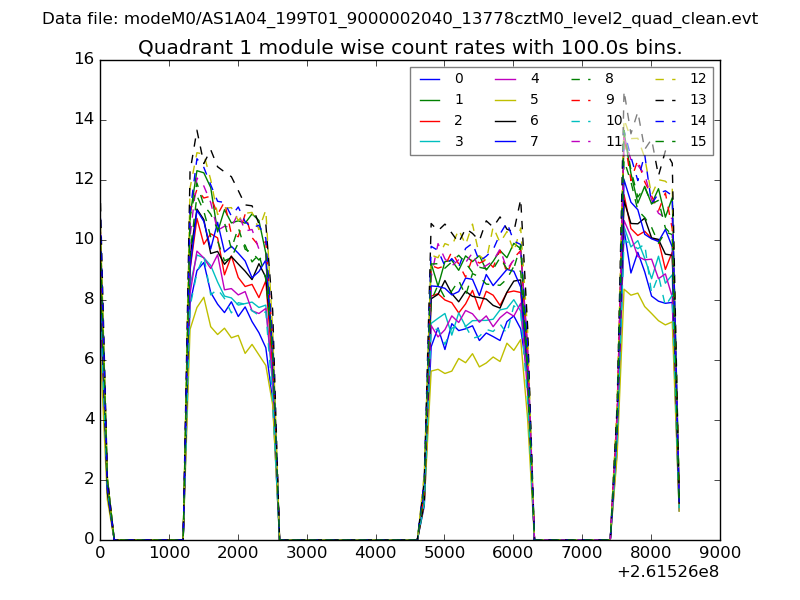
| Module-wise count rates for Quadrant A Data is divided into 100 sec bins |
 |
 |
| Module-wise count rates for Quadrant B Data is divided into 100 sec bins |
 |
 |
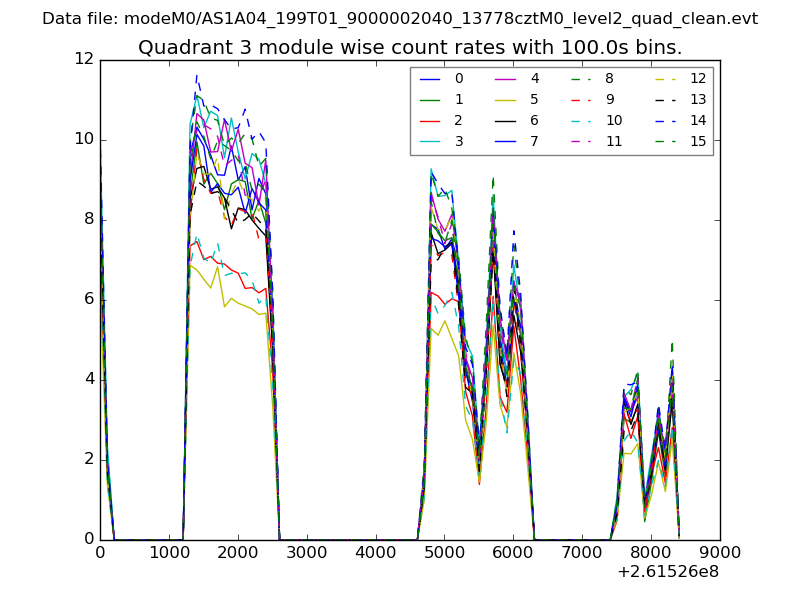
| Module-wise count rates for Quadrant C Data is divided into 100 sec bins |
 |
 |
| Module-wise count rates for Quadrant D Data is divided into 100 sec bins |
 |
 |
| Parameter | Plot |
|---|---|
| CZT HV Monitor | 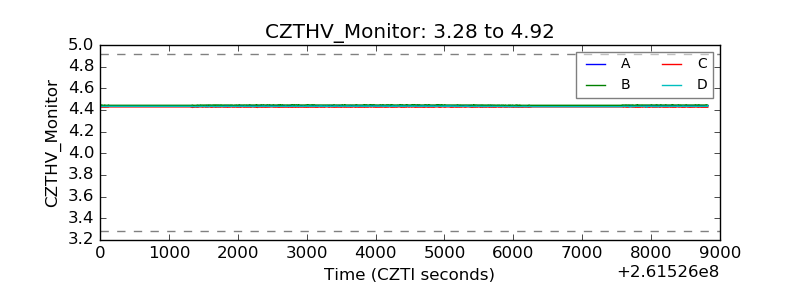 |
| D_VDD |  |
| Temperature 1 | 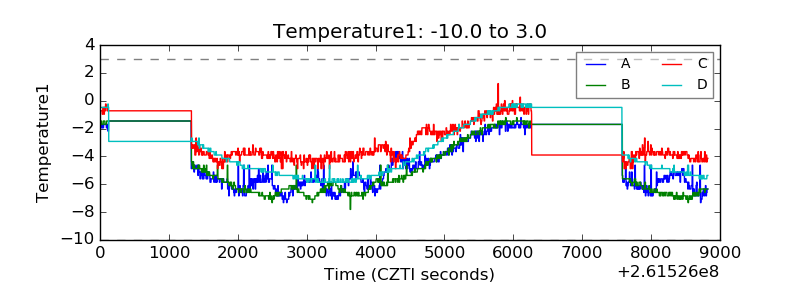 |
| Veto HV Monitor | 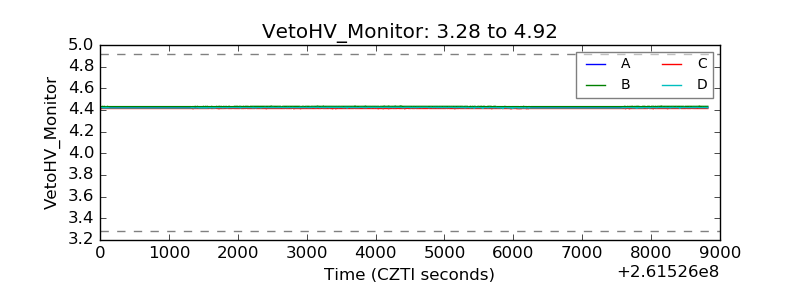 |
| Veto LLD |  |
| Alpha Counter | 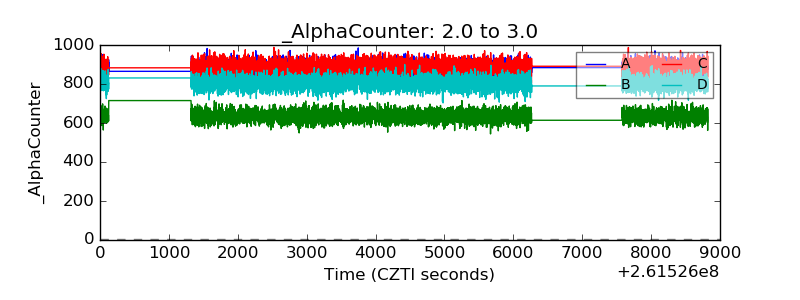 |
| _CPM_Rate | 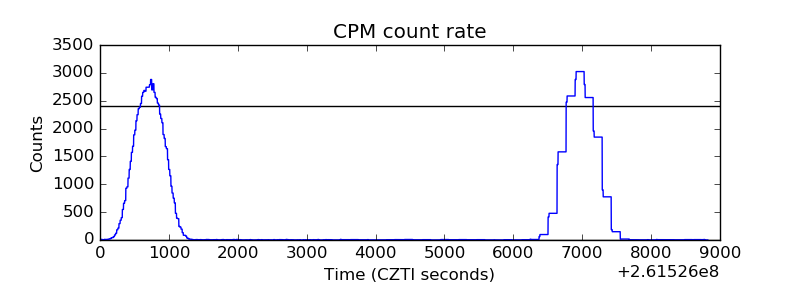 |
| CZT Counter | 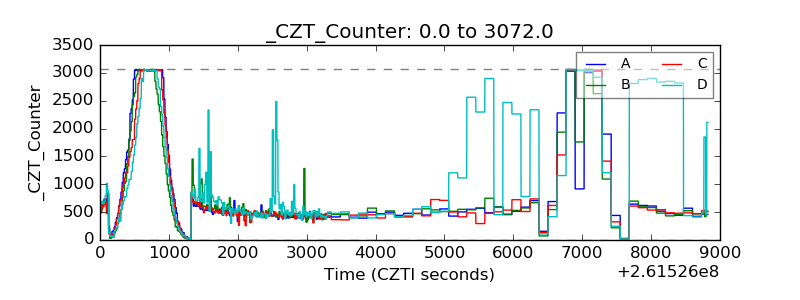 |
| +2.5 Volts monitor |  |
| +5 Volts monitor |  |
| _ROLL_ROT | 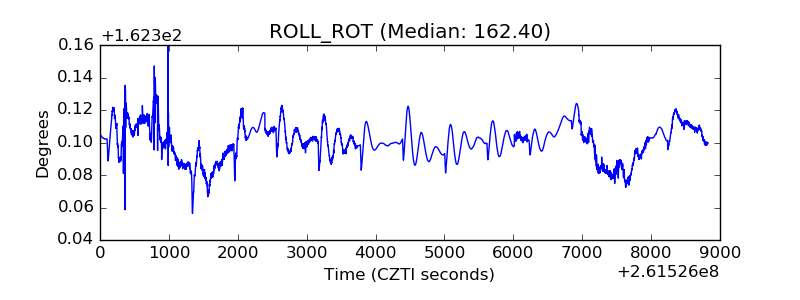 |
| _Roll_DEC | 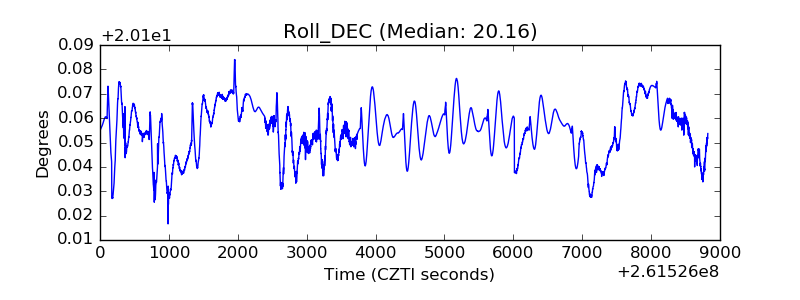 |
| _Roll_RA | 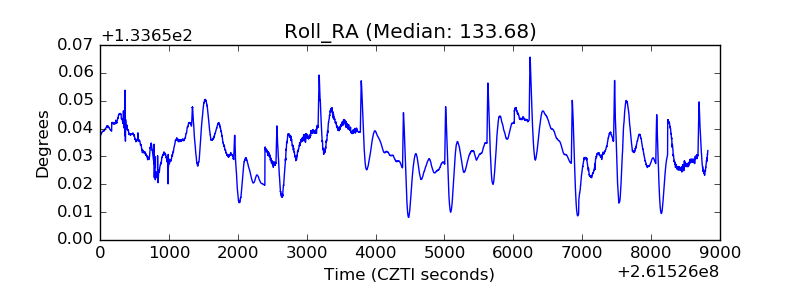 |
| Veto Counter | 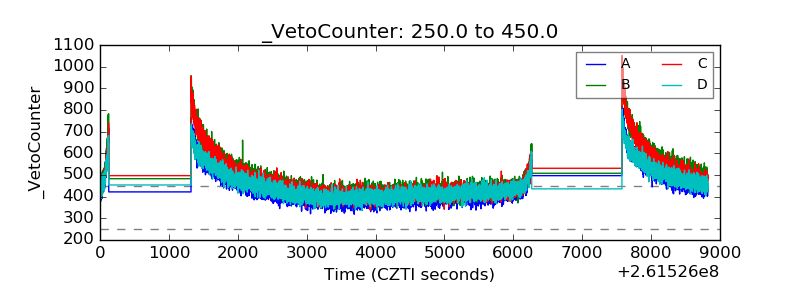 |