| Param | Original file | Final file |
|---|---|---|
| Filename | modeM0/AS1A04_199T01_9000002040_13779cztM0_level2.evt | modeM0/AS1A04_199T01_9000002040_13779cztM0_level2_quad_clean.evt |
| Size (bytes) | 510,105,600 | 72,184,320 |
| Size | 486.5 MB | 68.8 MB |
| Events in quadrant A | 3,154,502 | 470,098 |
| Events in quadrant B | 3,257,940 | 481,899 |
| Events in quadrant C | 3,109,318 | 462,118 |
| Events in quadrant D | 5,507,163 | 339,503 |
| Mode M9 | |||
|---|---|---|---|
| Quadrant | BADHDUFLAG | Total packets | Discarded packets |
| A | 0 | 15 | 0 |
| B | 0 | 15 | 0 |
| C | 0 | 15 | 0 |
| D | 0 | 16 | 0 |
| Mode SS | |||
|---|---|---|---|
| Quadrant | BADHDUFLAG | Total packets | Discarded packets |
| A | 0 | 126 | 0 |
| B | 0 | 126 | 0 |
| C | 0 | 126 | 0 |
| D | 0 | 126 | 0 |
| Mode M0 | |||
|---|---|---|---|
| Quadrant | BADHDUFLAG | Total packets | Discarded packets |
| A | 0 | 12956 | 3 |
| B | 0 | 13269 | 2 |
| C | 0 | 12867 | 2 |
| D | 0 | 20370 | 2 |
| Quadrant | Total seconds | Saturated seconds | Saturation percentage |
|---|---|---|---|
| A | 6182 | 21 | 0.339696% |
| B | 6182 | 47 | 0.760272% |
| C | 6182 | 9 | 0.145584% |
| D | 6182 | 931 | 15.059851% |
Noise dominated data is calculated using 1-second bins in cleaned event files. If a bin has >2000 counts, and if more than 50% of those come from <1% of pixels, then it is considered to be noise-dominated and hence unusable.
| Quadrant | # 1 sec bins | Bins with >0 counts | Bins with >2000 counts | High rate bins dominated by noise | Noise dominated (total time) | Noise dominated (detector-on time) | Marked lightcurve |
|---|---|---|---|---|---|---|---|
| A | 7528 | 6184 | 0 | 0 | 0.00% | 0.00% | 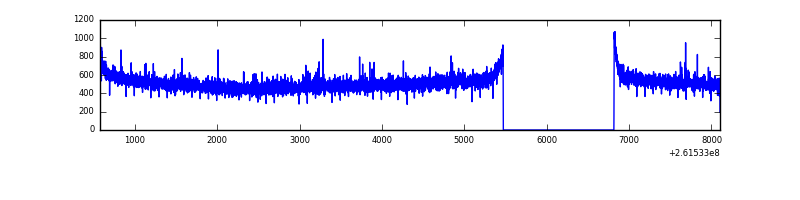 |
| B | 7528 | 6184 | 10 | 10 | 0.13% | 0.16% | 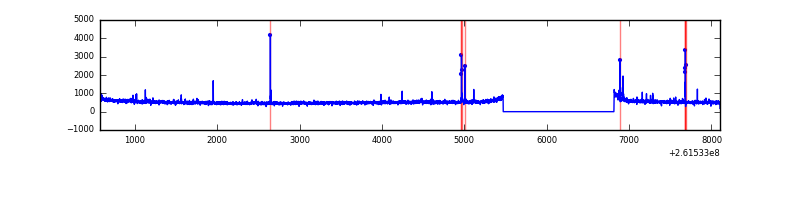 |
| C | 7528 | 6184 | 0 | 0 | 0.00% | 0.00% | 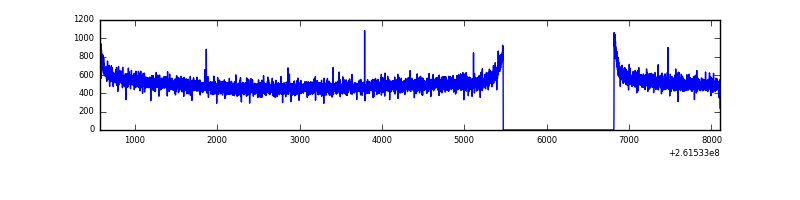 |
| D | 7528 | 6184 | 901 | 901 | 11.97% | 14.57% | 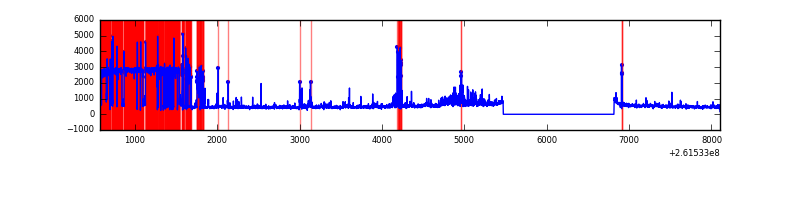 |
Top three noisy pixels from each quadrant. If the there are fewer than three noisy pixels in the level2.evt file, extra rows are filled as -1
| Pixel properties | Quadrant properties | ||||||
|---|---|---|---|---|---|---|---|
| Quadrant | DetID | PixID | Counts | Sigma | Mean | Median | Sigma |
| A | 1 | 162 | 20514 | 120.98 | 807 | 794 | 163.0 |
| A | 8 | 15 | 9277 | 52.04 | 807 | 794 | 163.0 |
| A | 0 | 226 | 7321 | 40.04 | 807 | 794 | 163.0 |
| B | 3 | 64 | 34152 | 219.88 | 813 | 796 | 151.7 |
| B | 4 | 80 | 26306 | 168.16 | 813 | 796 | 151.7 |
| B | 12 | 111 | 17016 | 106.92 | 813 | 796 | 151.7 |
| C | 3 | 233 | 67441 | 371.9 | 780 | 789 | 179.2 |
| C | 13 | 61 | 5675 | 27.26 | 780 | 789 | 179.2 |
| C | 14 | 234 | 2292 | 8.39 | 780 | 789 | 179.2 |
| D | 1 | 3 | 2436884 | 13697.26 | 673 | 661 | 177.9 |
| D | 5 | 222 | 199841 | 1119.86 | 673 | 661 | 177.9 |
| D | 1 | 52 | 199827 | 1119.78 | 673 | 661 | 177.9 |
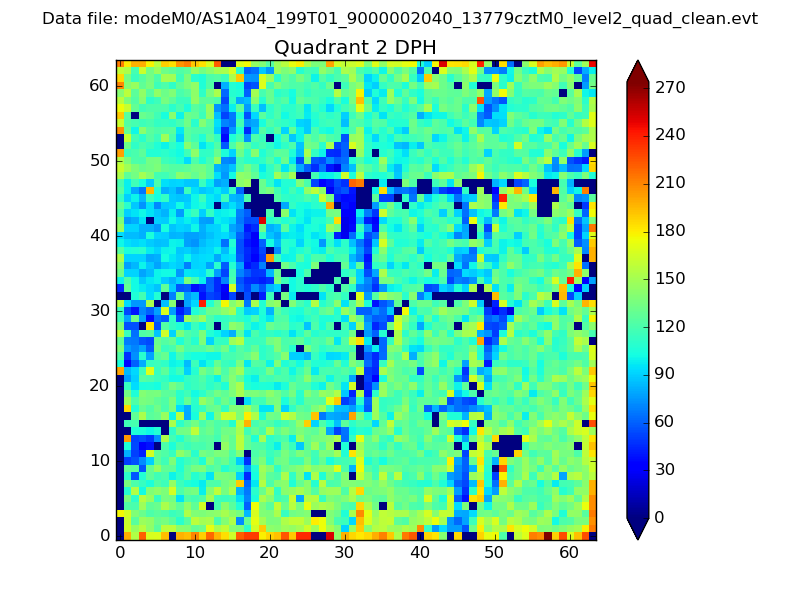
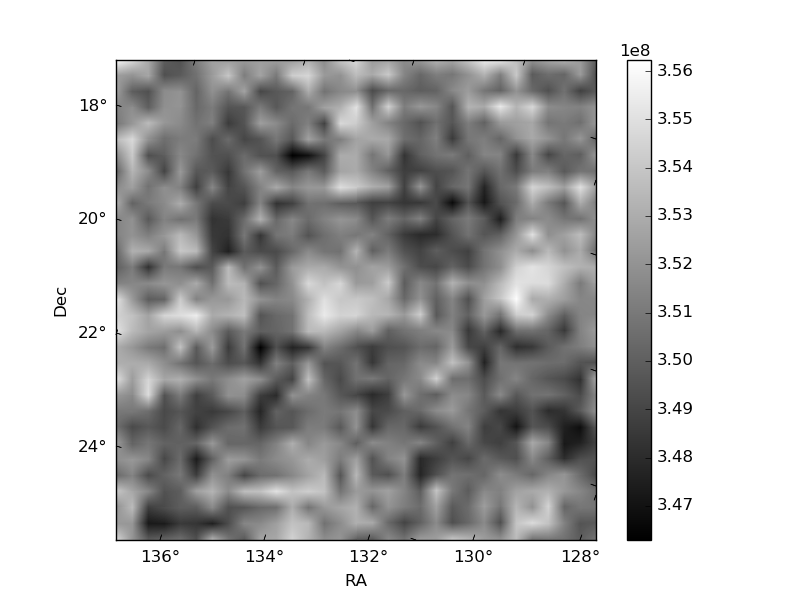
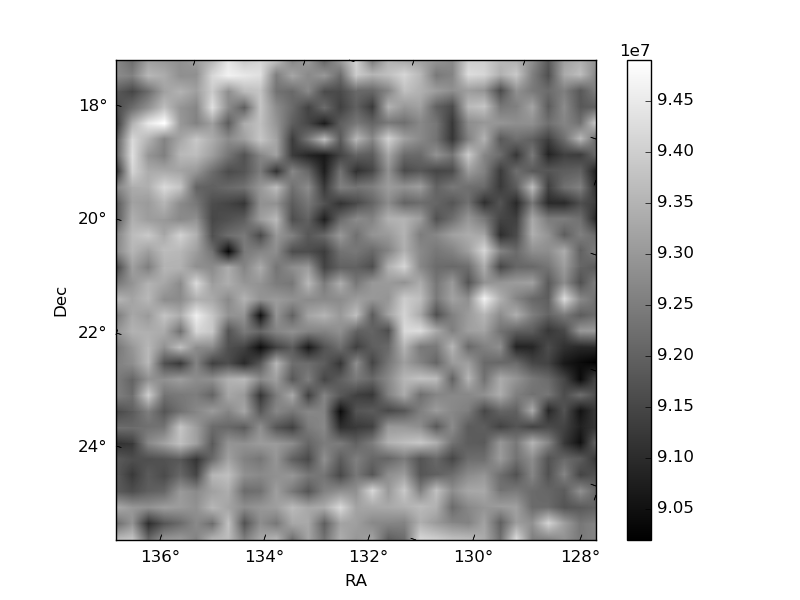
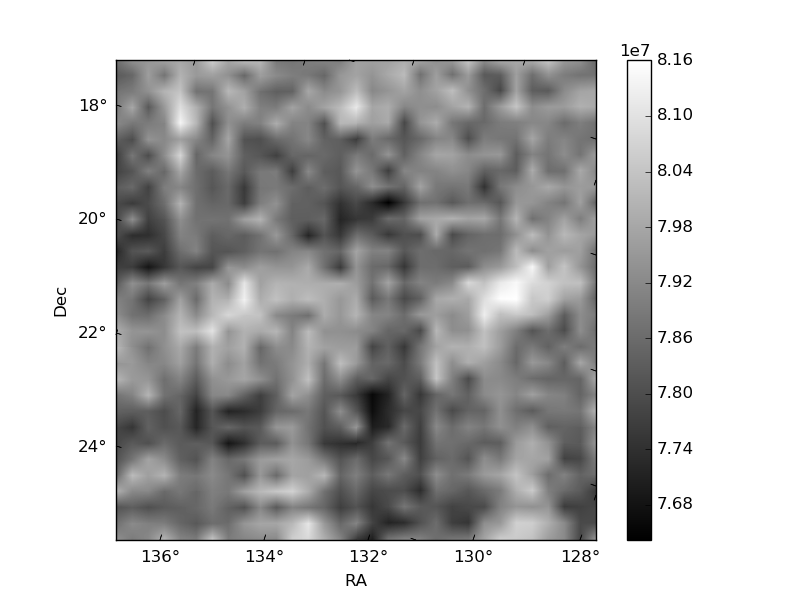
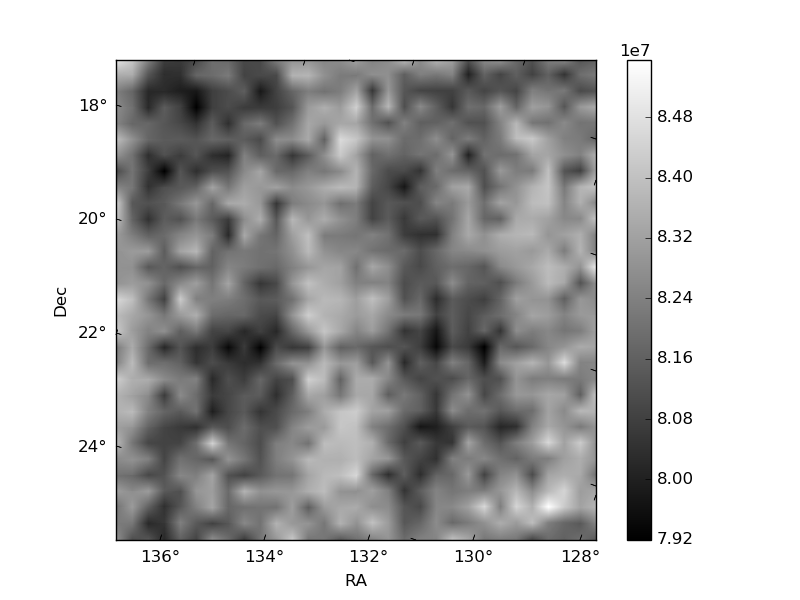
Histogram calculated using DETX and DETY for each event in the final _common_clean file
| Quadrant A | 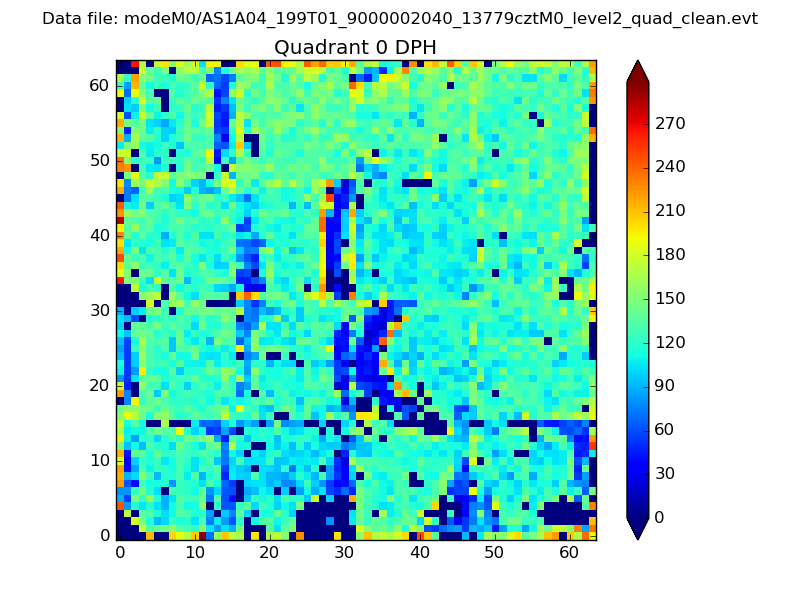 |
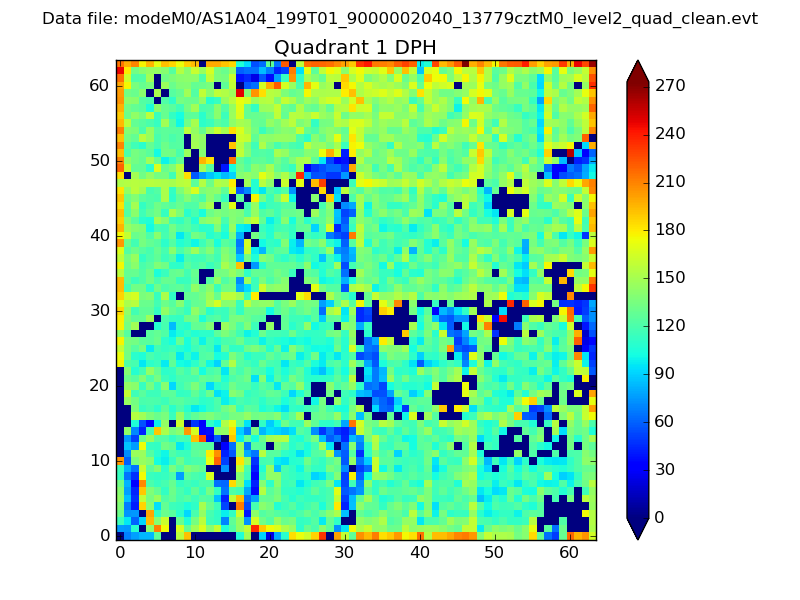 |
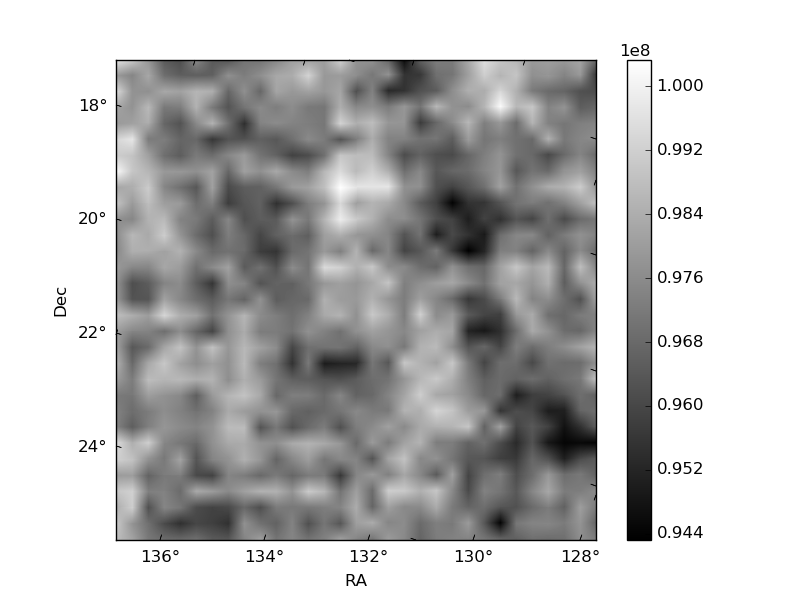
Quadrant B |
|---|---|---|---|
| Quadrant D | 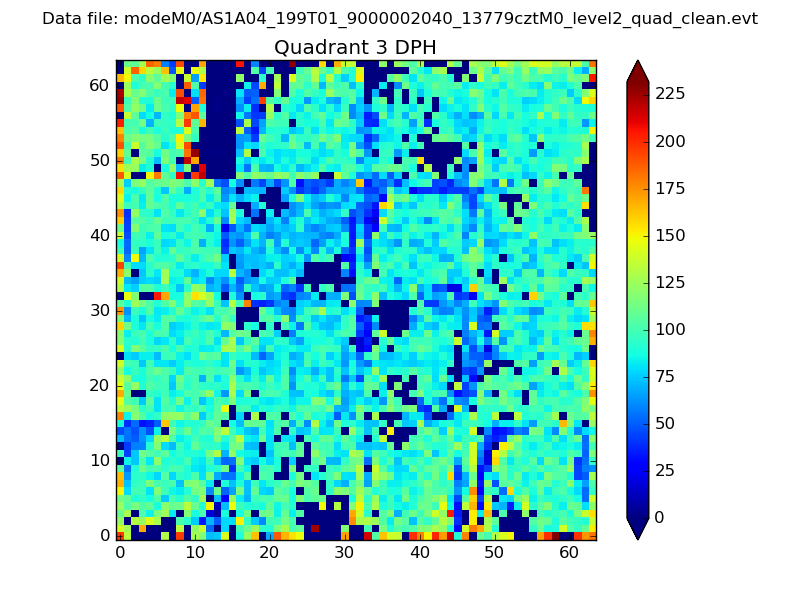 |
 |
Quadrant C |
| Plot type | Count rate plots | Images |
|---|---|---|
| Comparison with Poisson distribution Blue bars denote a histogram of data divided into 1 sec bins. Red curve is a Poisson curve with rate = median count rate of data. |
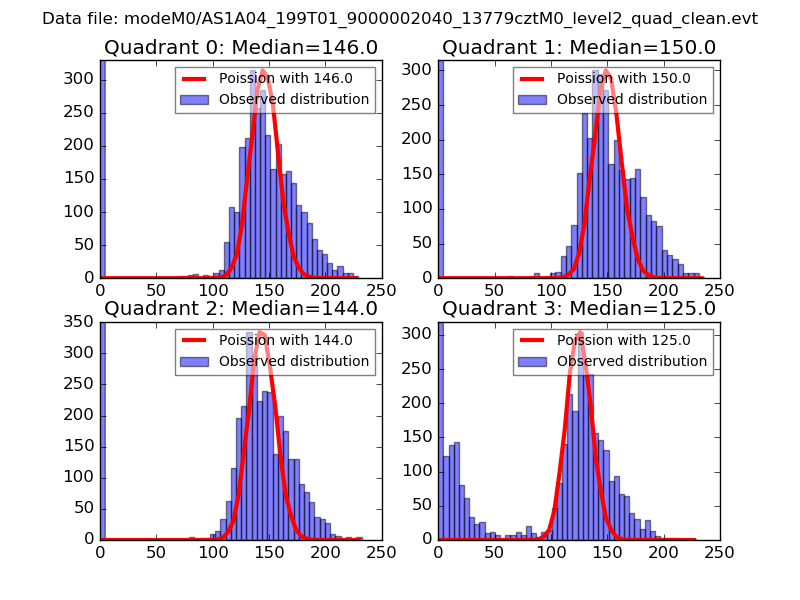 |
 |
| Quadrant-wise count rates Data is divided into 100 sec bins |
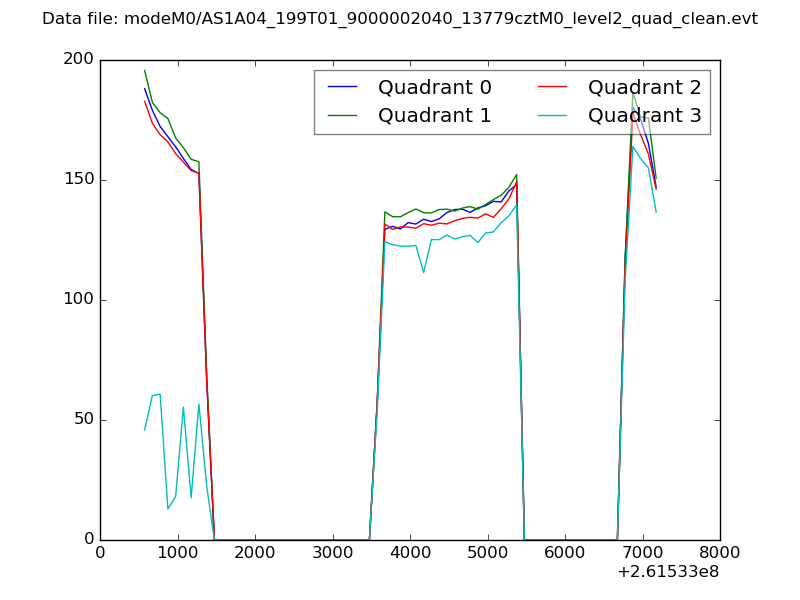 |
|
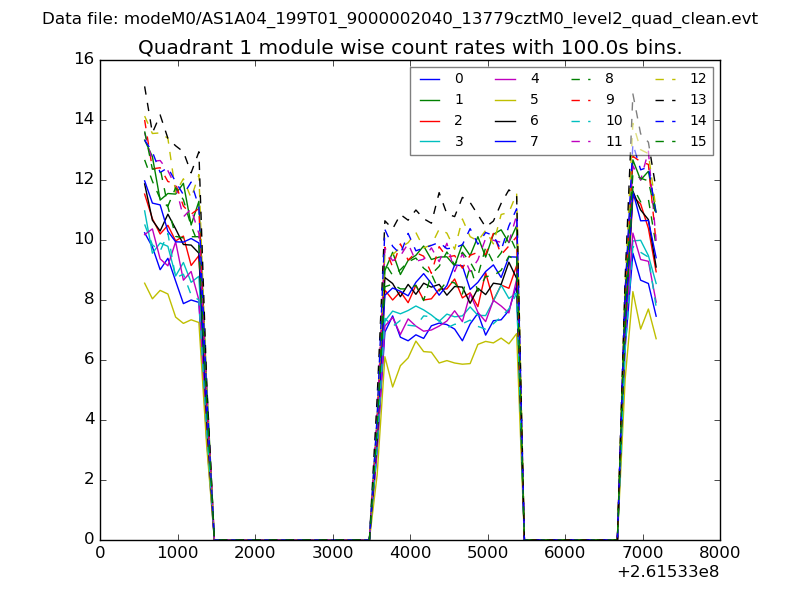
| Module-wise count rates for Quadrant A Data is divided into 100 sec bins |
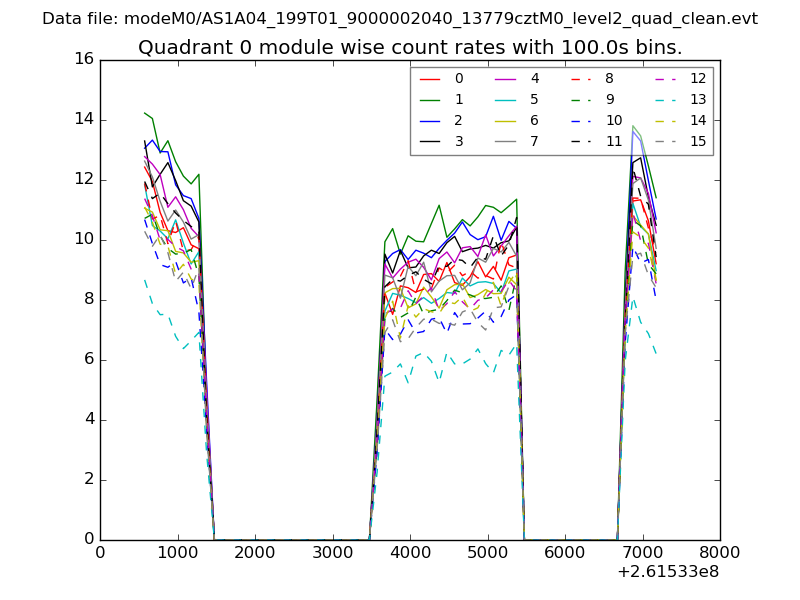 |
 |
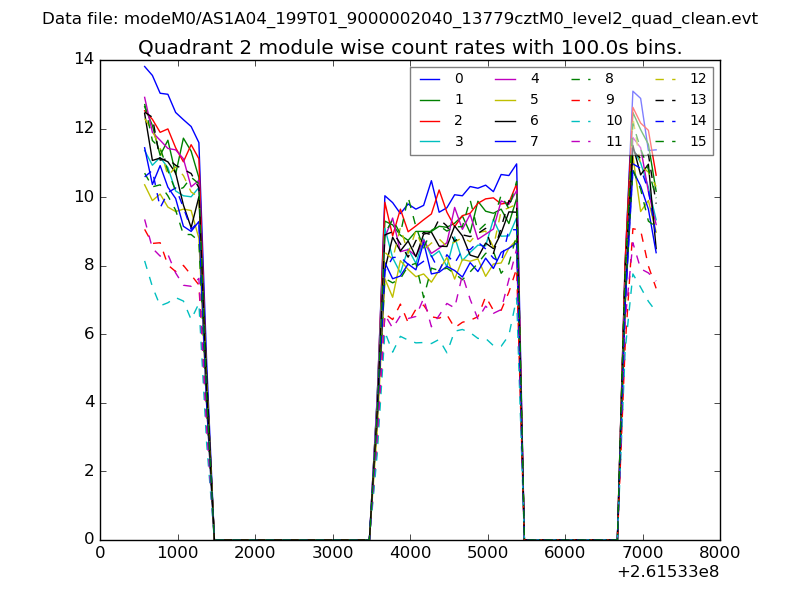
| Module-wise count rates for Quadrant B Data is divided into 100 sec bins |
 |
 |
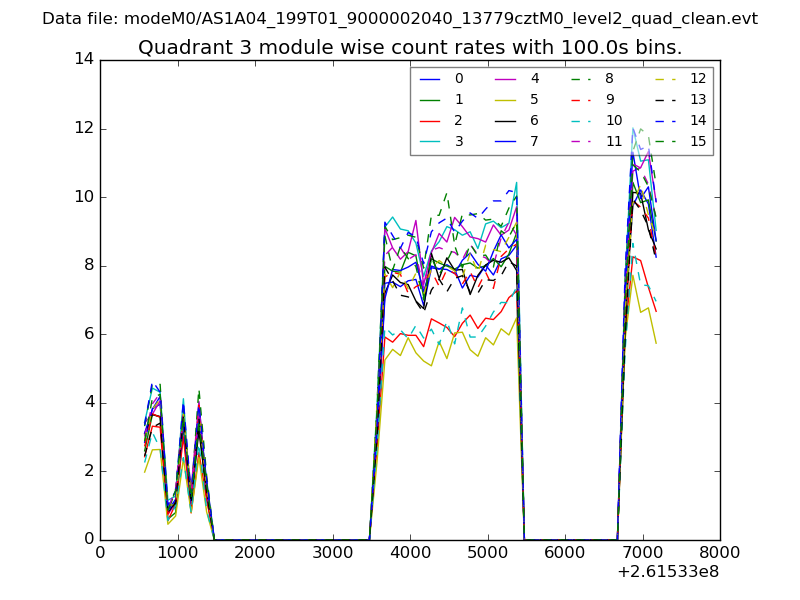
| Module-wise count rates for Quadrant C Data is divided into 100 sec bins |
 |
 |
| Module-wise count rates for Quadrant D Data is divided into 100 sec bins |
 |
 |
| Parameter | Plot |
|---|---|
| CZT HV Monitor | 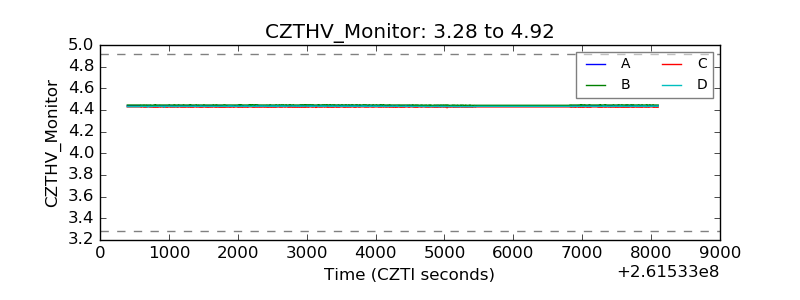 |
| D_VDD | 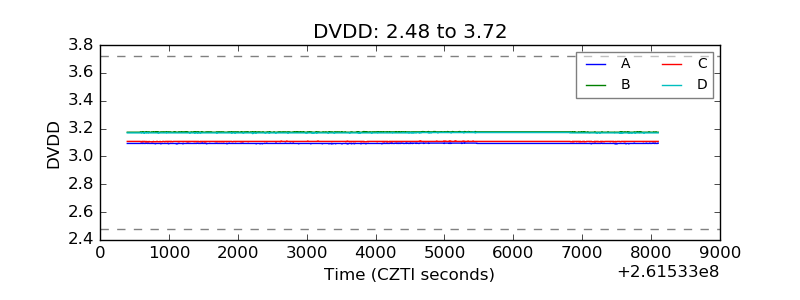 |
| Temperature 1 |  |
| Veto HV Monitor | 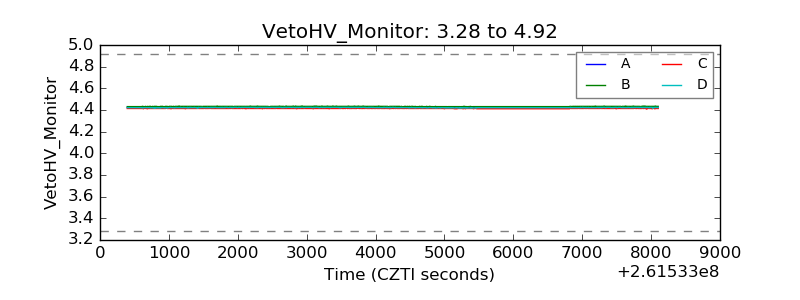 |
| Veto LLD | 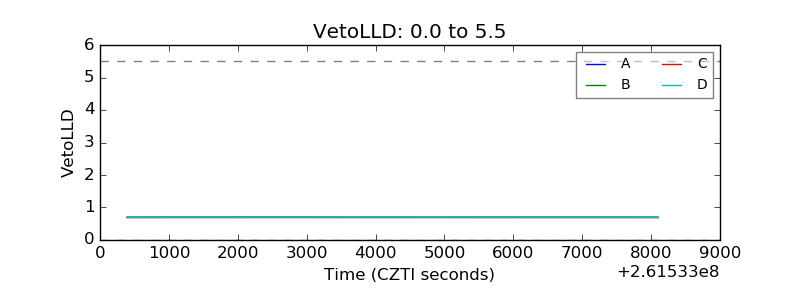 |
| Alpha Counter | 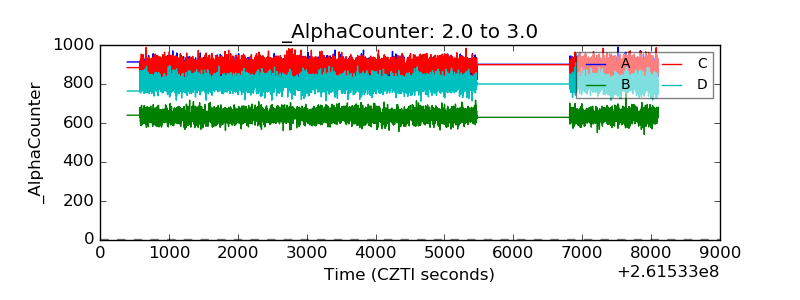 |
| _CPM_Rate | 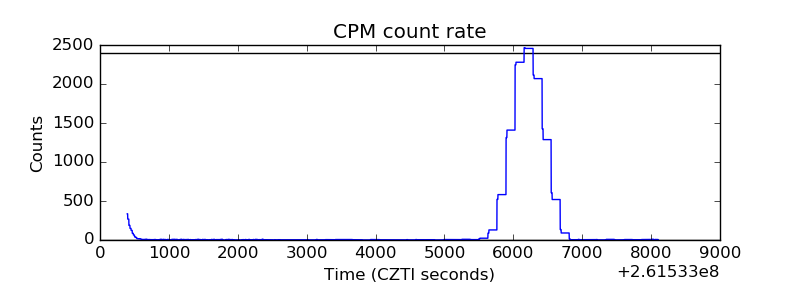 |
| CZT Counter | 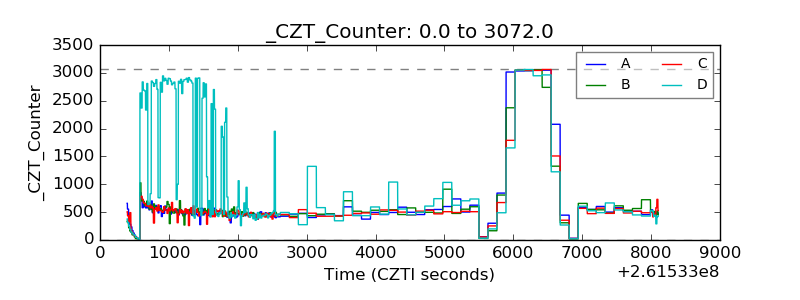 |
| +2.5 Volts monitor |  |
| +5 Volts monitor |  |
| _ROLL_ROT | 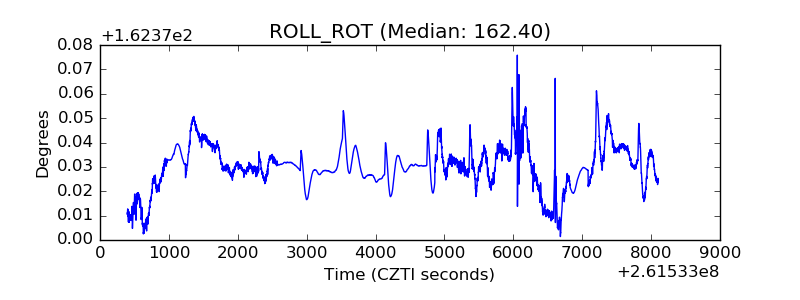 |
| _Roll_DEC | 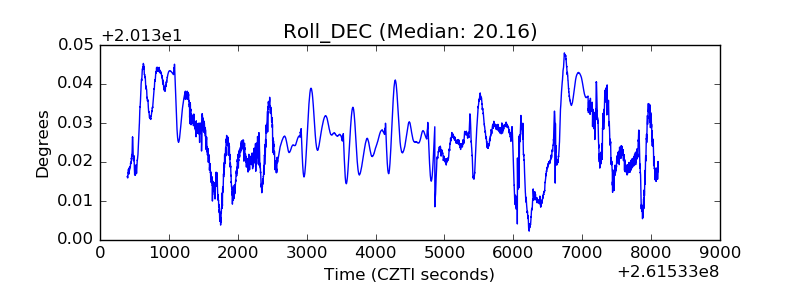 |
| _Roll_RA | 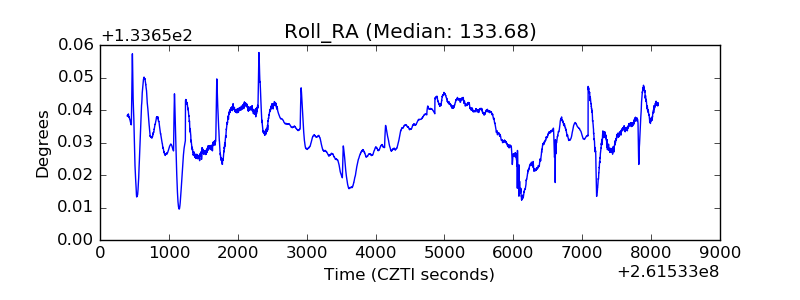 |
| Veto Counter |  |