| Param | Original file | Final file |
|---|---|---|
| Filename | modeM0/AS1A04_199T01_9000002040_13783cztM0_level2.evt | modeM0/AS1A04_199T01_9000002040_13783cztM0_level2_quad_clean.evt |
| Size (bytes) | 605,263,680 | 103,000,320 |
| Size | 577.2 MB | 98.2 MB |
| Events in quadrant A | 4,299,915 | 635,266 |
| Events in quadrant B | 4,416,037 | 642,942 |
| Events in quadrant C | 4,201,692 | 633,206 |
| Events in quadrant D | 4,831,723 | 613,224 |
| Mode M9 | |||
|---|---|---|---|
| Quadrant | BADHDUFLAG | Total packets | Discarded packets |
| A | 0 | 10 | 0 |
| B | 0 | 10 | 0 |
| C | 0 | 10 | 0 |
| D | 0 | 10 | 0 |
| Mode SS | |||
|---|---|---|---|
| Quadrant | BADHDUFLAG | Total packets | Discarded packets |
| A | 0 | 176 | 0 |
| B | 0 | 176 | 0 |
| C | 0 | 176 | 0 |
| D | 0 | 176 | 0 |
| Mode M0 | |||
|---|---|---|---|
| Quadrant | BADHDUFLAG | Total packets | Discarded packets |
| A | 0 | 18177 | 4 |
| B | 0 | 18459 | 3 |
| C | 0 | 17938 | 3 |
| D | 0 | 19816 | 3 |
| Quadrant | Total seconds | Saturated seconds | Saturation percentage |
|---|---|---|---|
| A | 8559 | 357 | 4.171048% |
| B | 8559 | 400 | 4.673443% |
| C | 8559 | 269 | 3.142891% |
| D | 8559 | 332 | 3.878958% |
Noise dominated data is calculated using 1-second bins in cleaned event files. If a bin has >2000 counts, and if more than 50% of those come from <1% of pixels, then it is considered to be noise-dominated and hence unusable.
| Quadrant | # 1 sec bins | Bins with >0 counts | Bins with >2000 counts | High rate bins dominated by noise | Noise dominated (total time) | Noise dominated (detector-on time) | Marked lightcurve |
|---|---|---|---|---|---|---|---|
| A | 9595 | 8561 | 0 | 0 | 0.00% | 0.00% | 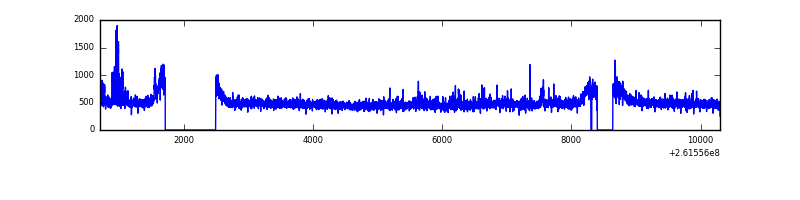 |
| B | 9595 | 8562 | 9 | 9 | 0.09% | 0.11% | 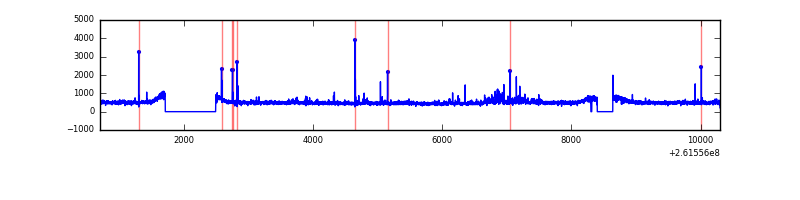 |
| C | 9595 | 8562 | 0 | 0 | 0.00% | 0.00% | 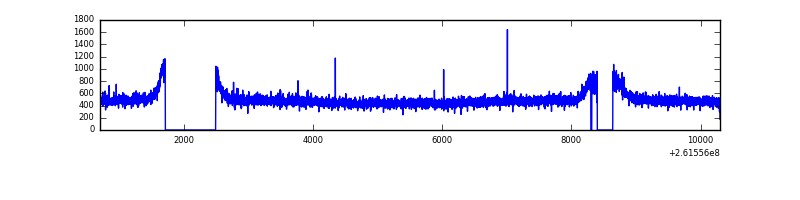 |
| D | 9595 | 8563 | 50 | 50 | 0.52% | 0.58% | 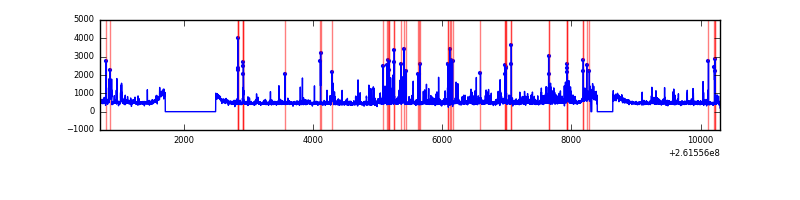 |
Top three noisy pixels from each quadrant. If the there are fewer than three noisy pixels in the level2.evt file, extra rows are filled as -1
| Pixel properties | Quadrant properties | ||||||
|---|---|---|---|---|---|---|---|
| Quadrant | DetID | PixID | Counts | Sigma | Mean | Median | Sigma |
| A | 0 | 23 | 62969 | 281.79 | 1071 | 1042 | 219.8 |
| A | 8 | 15 | 40485 | 179.48 | 1071 | 1042 | 219.8 |
| A | 9 | 143 | 26622 | 116.4 | 1071 | 1042 | 219.8 |
| B | 0 | 219 | 89059 | 426.98 | 1069 | 1038 | 206.1 |
| B | 8 | 250 | 34764 | 163.6 | 1069 | 1038 | 206.1 |
| B | 3 | 64 | 34278 | 161.24 | 1069 | 1038 | 206.1 |
| C | 3 | 233 | 106787 | 431.25 | 1049 | 1052 | 245.2 |
| C | 13 | 61 | 7353 | 25.7 | 1049 | 1052 | 245.2 |
| C | 0 | 207 | 5016 | 16.17 | 1049 | 1052 | 245.2 |
| D | 1 | 52 | 504165 | 1827.43 | 1032 | 1010 | 275.3 |
| D | 5 | 222 | 144866 | 522.48 | 1032 | 1010 | 275.3 |
| D | 13 | 249 | 59753 | 213.35 | 1032 | 1010 | 275.3 |
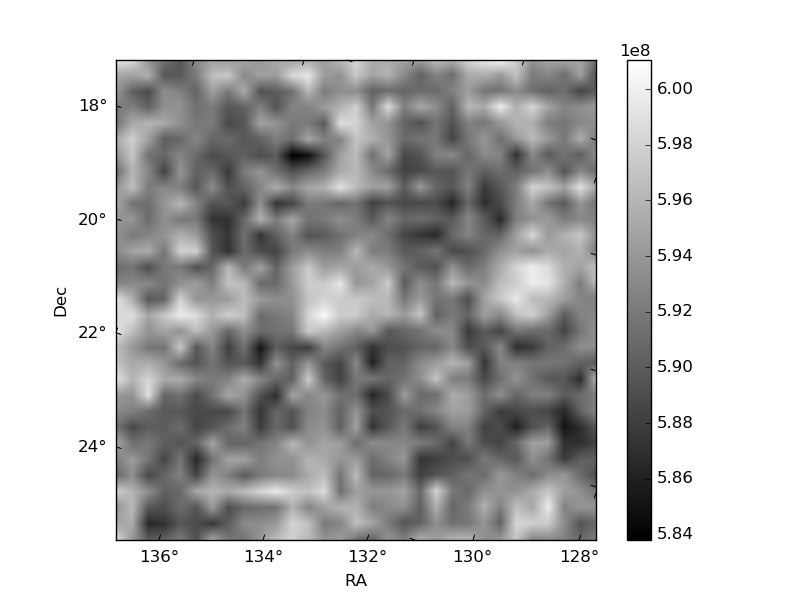
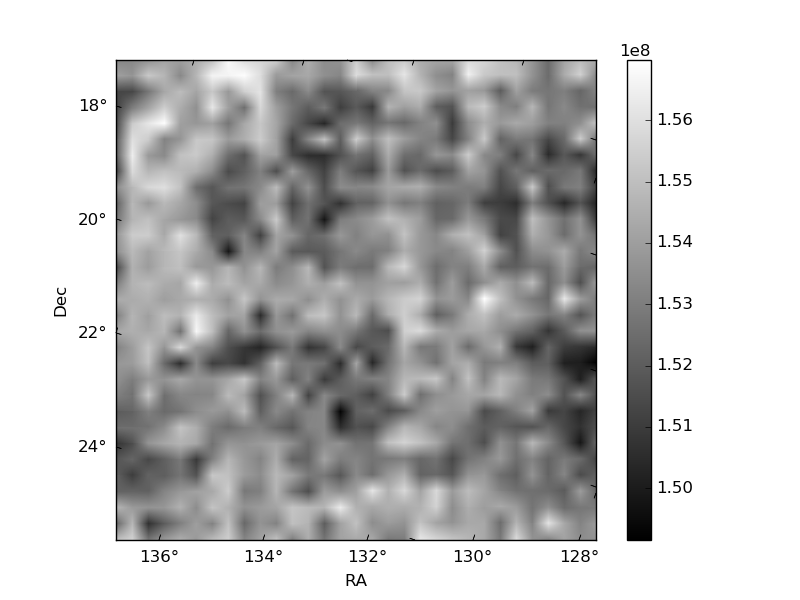
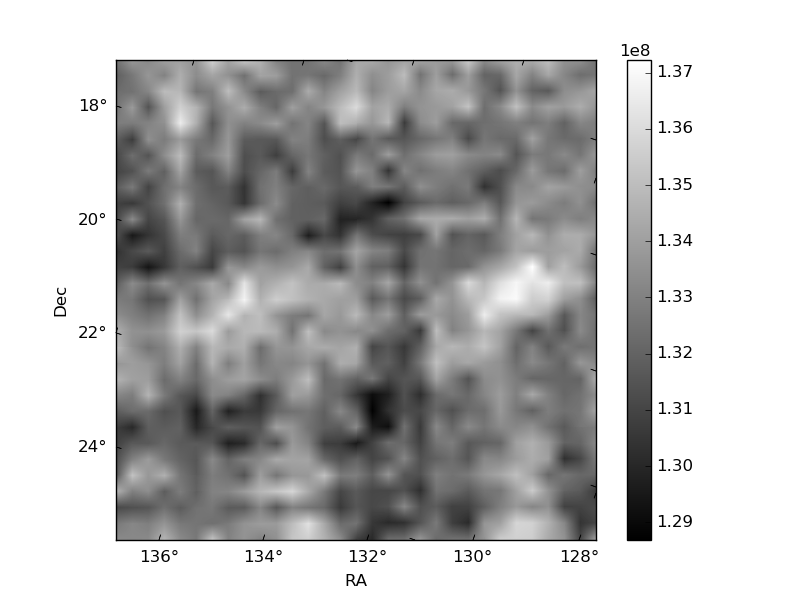
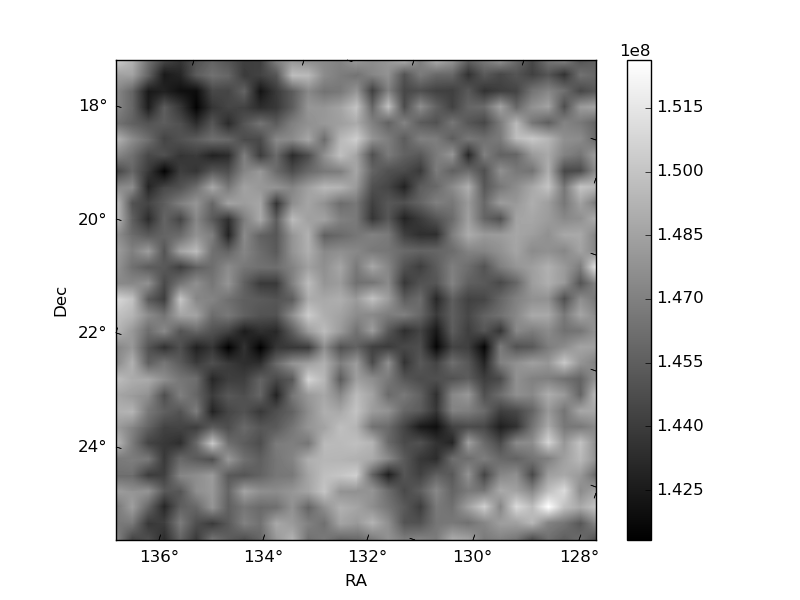
Histogram calculated using DETX and DETY for each event in the final _common_clean file
| Quadrant A | 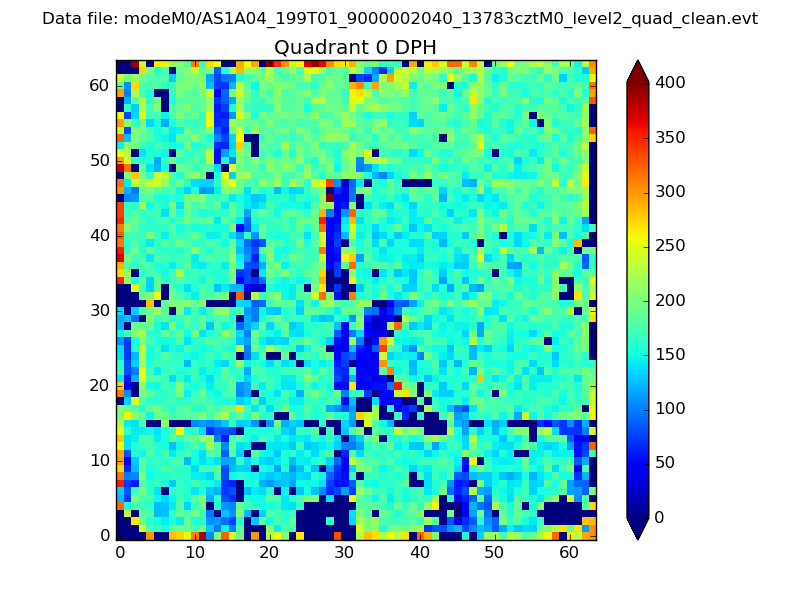 |
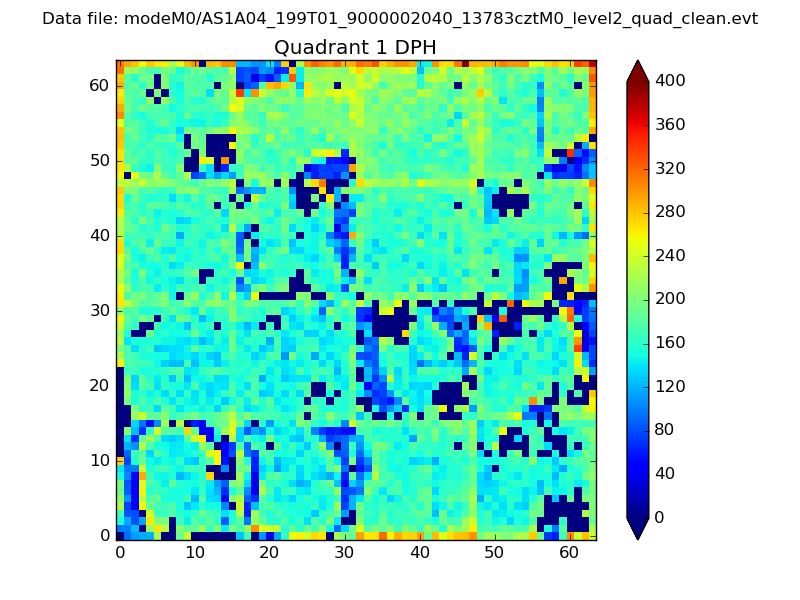 |
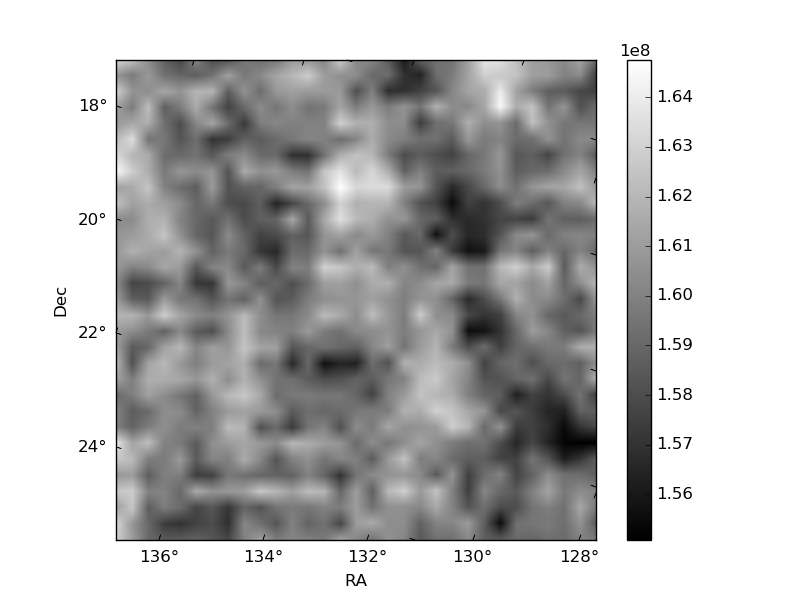
Quadrant B |
|---|---|---|---|
| Quadrant D | 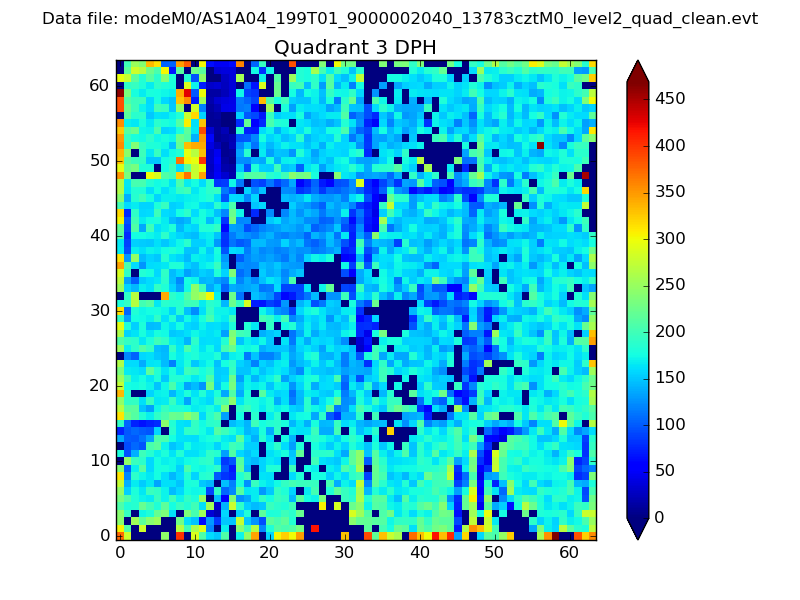 |
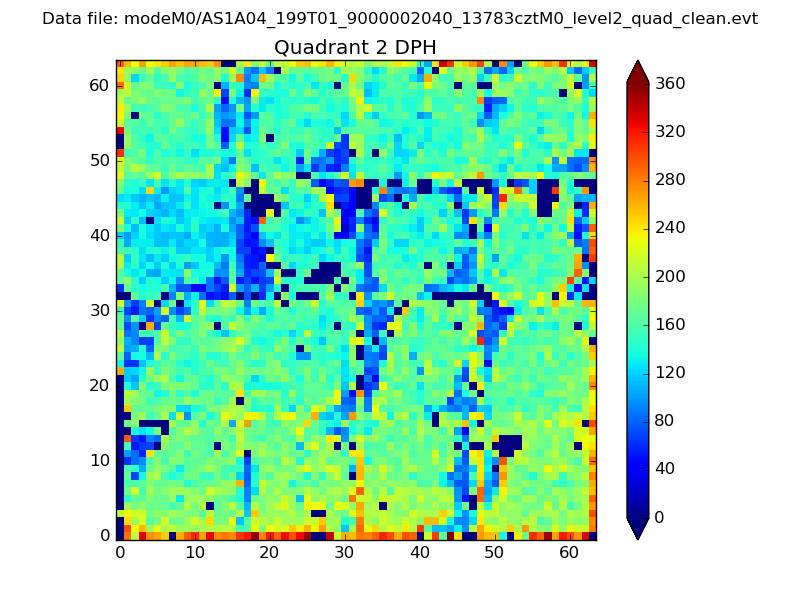 |
Quadrant C |
| Plot type | Count rate plots | Images |
|---|---|---|
| Comparison with Poisson distribution Blue bars denote a histogram of data divided into 1 sec bins. Red curve is a Poisson curve with rate = median count rate of data. |
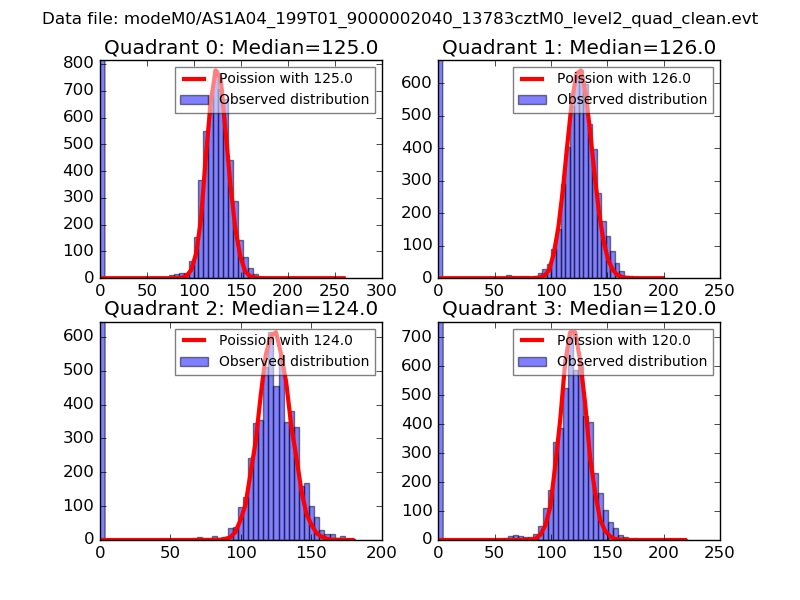 |
 |
| Quadrant-wise count rates Data is divided into 100 sec bins |
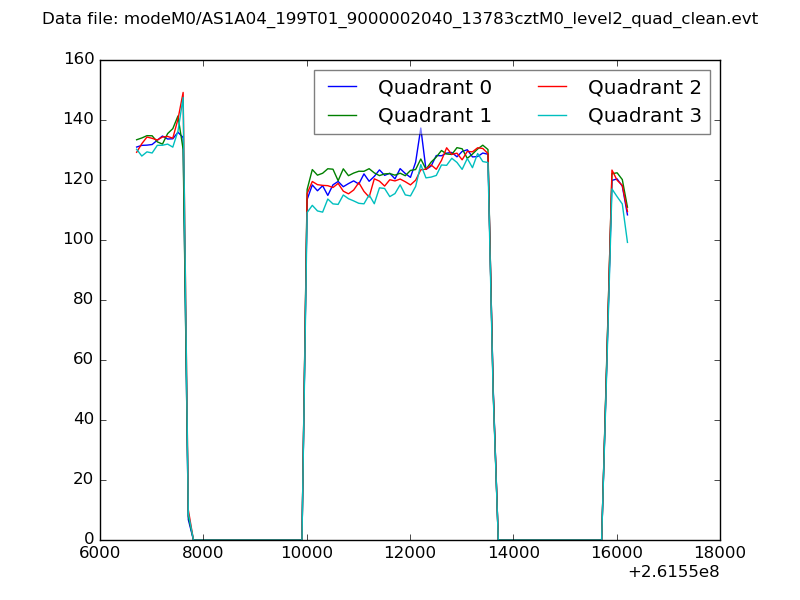 |
|
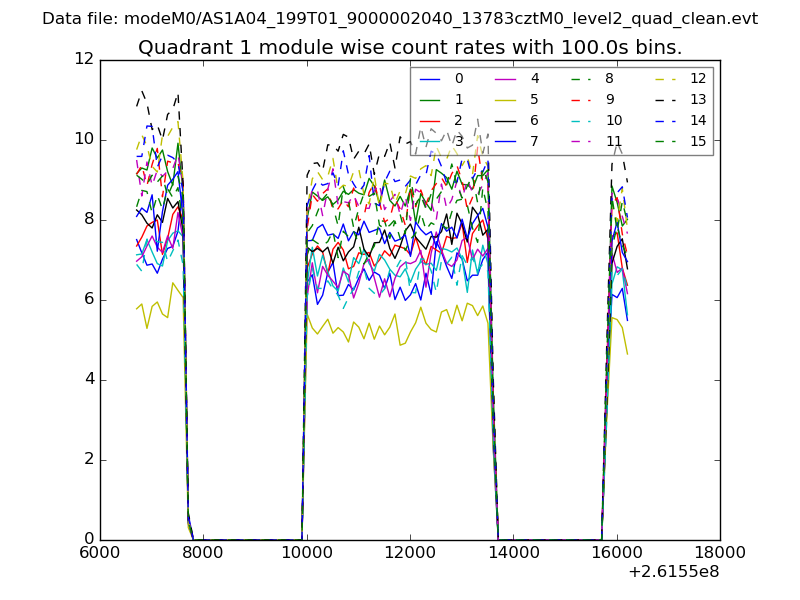
| Module-wise count rates for Quadrant A Data is divided into 100 sec bins |
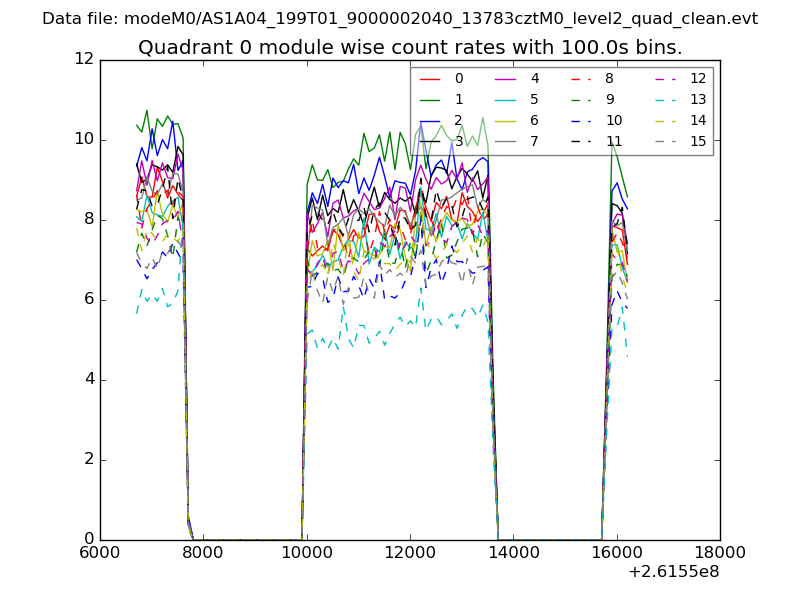 |
 |
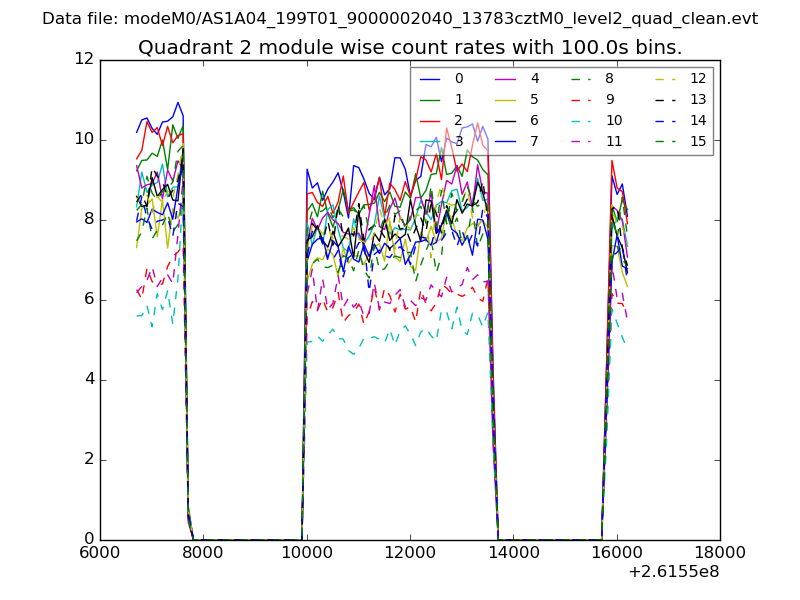
| Module-wise count rates for Quadrant B Data is divided into 100 sec bins |
 |
 |
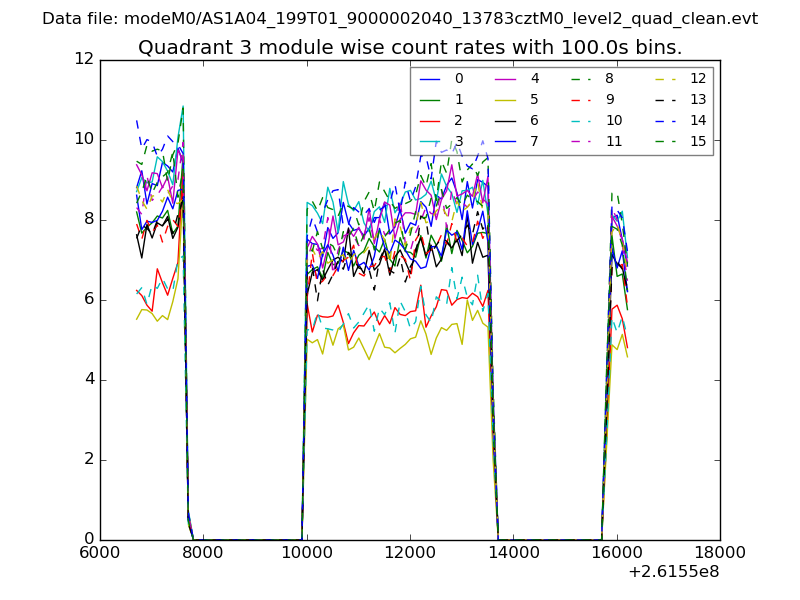
| Module-wise count rates for Quadrant C Data is divided into 100 sec bins |
 |
 |
| Module-wise count rates for Quadrant D Data is divided into 100 sec bins |
 |
 |
| Parameter | Plot |
|---|---|
| CZT HV Monitor | 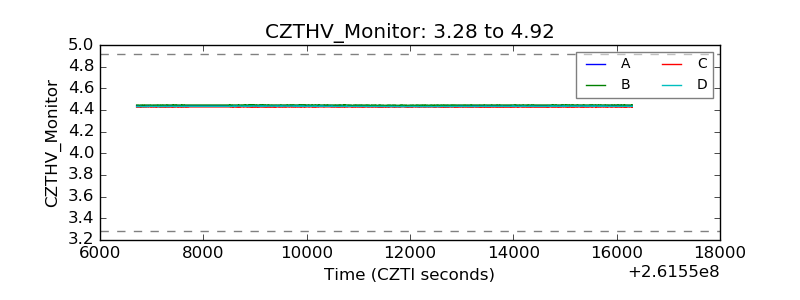 |
| D_VDD | 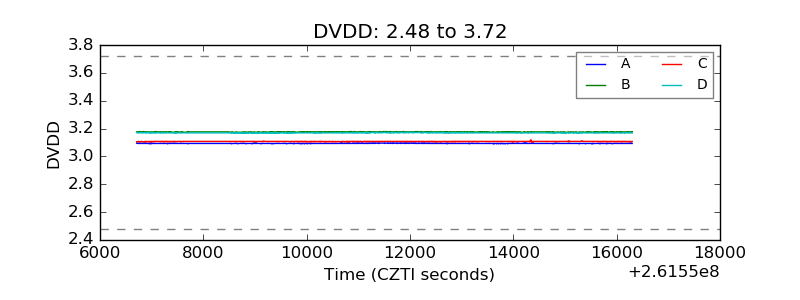 |
| Temperature 1 |  |
| Veto HV Monitor | 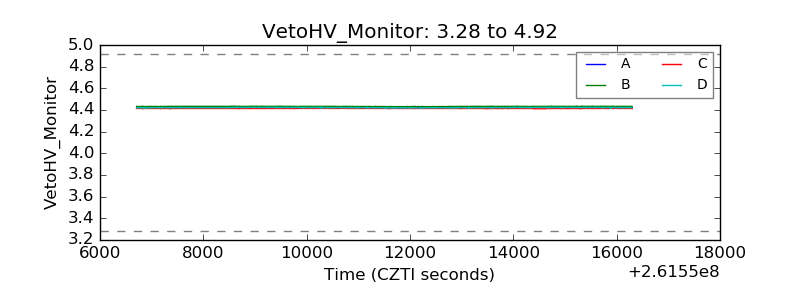 |
| Veto LLD | 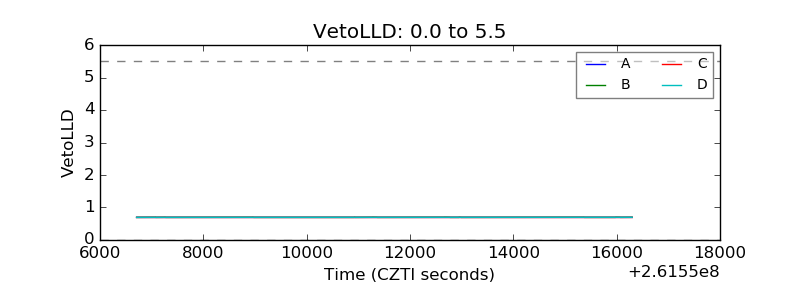 |
| Alpha Counter | 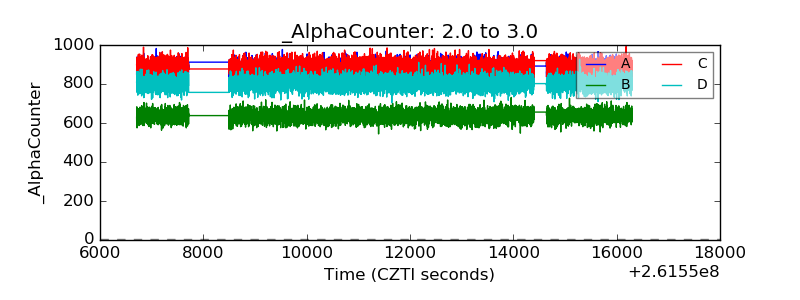 |
| _CPM_Rate | 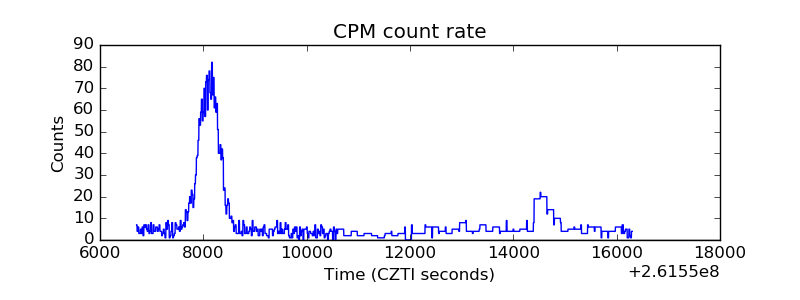 |
| CZT Counter | 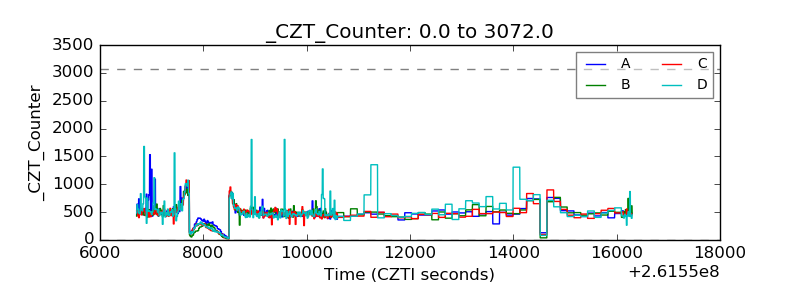 |
| +2.5 Volts monitor |  |
| +5 Volts monitor |  |
| _ROLL_ROT | 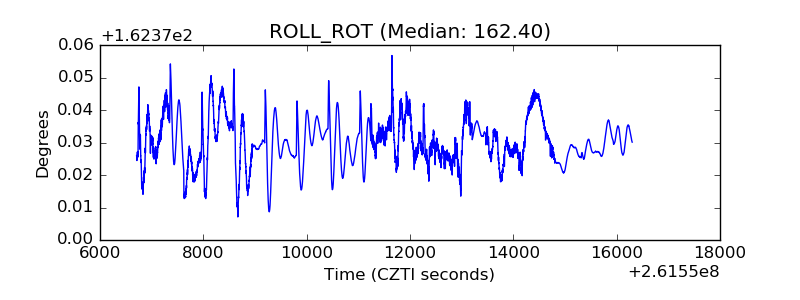 |
| _Roll_DEC | 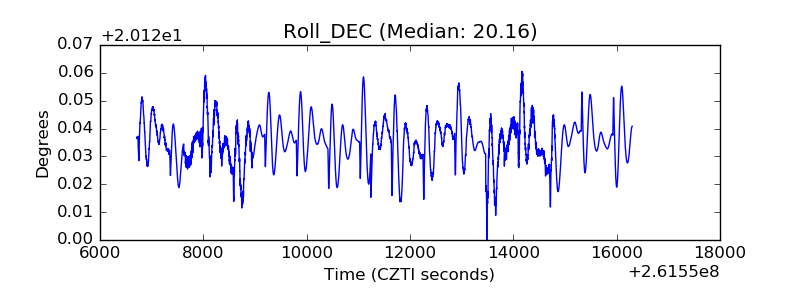 |
| _Roll_RA | 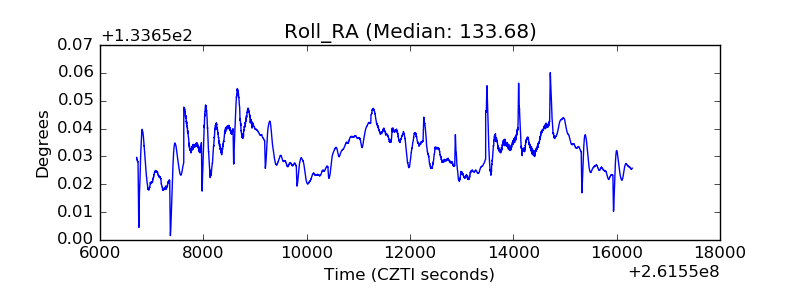 |
| Veto Counter | 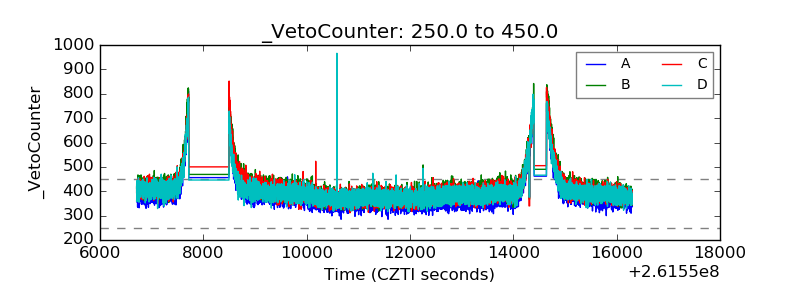 |